CHAPTER 20
Reading edition
Limited Response to Discrimination
The good feelings brought on by the integration of the armed forces lasted less than a decade. By the early 1960's the Department of Defense and the civil rights advocates had begun once more to draw apart, the source of contention centering on their differing interpretations of the scope of the Truman order. The Defense Department professed itself unable to interfere with community laws and customs even when those laws and customs discriminated against men in uniform. The civil rights leaders, however, rejected the federal government's acceptance of the status quo. Reacting especially to the widespread and blatant discrimination encountered by servicemen both in communities adjacent to bases at home and abroad and in the reserve components of the services in many parts of the country, they stepped up demands for remedial action against a situation that they believed continued at the sufferance of the armed forces.
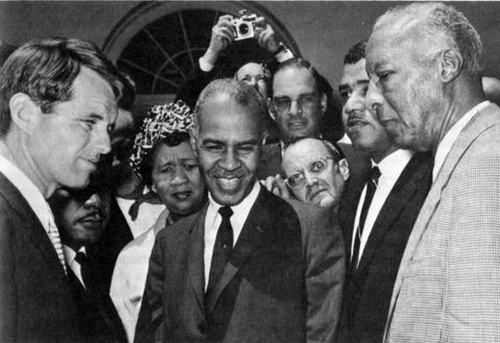
Civil Rights Leaders at the White House. Attorney General Robert F. Kennedy poses with (from left) Martin Luther King, Jr., Roy Wilkins, Whitney M. Young, Jr., and A. Philip Randolph.
The Kennedy Administration and Civil Rights
Kennedy was convinced that the only answer to the injustices suffered by Negroes was a series of strong laws, but he was also certain that such legislation was impossible to achieve in 1961. To urge it on an unwilling Congress would only jeopardize his legislative program, increase the black minority's feeling of frustration, and divide the nation in a period of national crisis. Discussing the Civil Rights Commission's "non-negotiable" demands concerning the organized reserves, for example, commission member Father Theodore Hesburgh remembered the President saying:
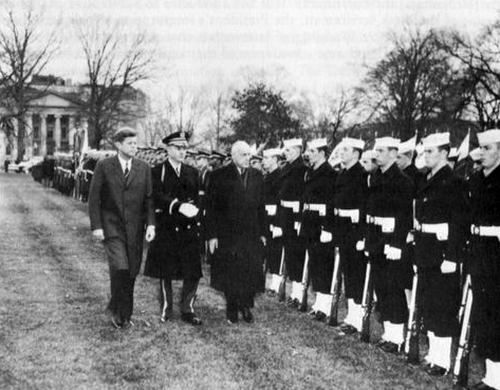
President Kennedy and President Allessandri of Chile review an all-white honor guard unit, White House, 1962.
The Department of Defense, 1961-1963
The number of Department of Defense rulings that pertained directly to black servicemen was matched by the comprehensiveness of their subject matter. Many concerned the recruitment of Negroes and the increase in their proportion of the military establishment. Others pertained to off-base matters, ranging from prohibitions against the use of segregated facilities during field exercises to the use of military units in ceremonies and shows involving segregated audiences. Continued segregation in the reserves, the racial policies of the United Services Organization, and even the racial rule of morticians who dealt with the services came in for attention.
Yet if these investigations and directives bespoke a quickened tempo in the fight for equal treatment and opportunity in the armed forces, they did not herald a substantive reinterpretation of policy. The Defense Department continued to limit its actions to matters obviously and directly within its purview. The same self-imposed restriction that kept McNamara's immediate predecessors from dealing with the most pressing demands for reforms by black servicemen and the civil rights leaders continued to be observed. This fact was especially clear in the case of the Defense Department's four major policy pronouncements involving the complex problem of discrimination visited upon servicemen and their dependents outside the gates of the military reservation.
Discrimination Off the Military Reservation
Where the order was specific, it carefully limited the extent of reforms. It barred the use of military police in the enforcement of local segregation laws, a positive step but a limited reform since only in very rare instances had military police ever been so employed. The order also provided "as circumstances warranted" for legal assistance to servicemen to insure that they were afforded due process of law in cases growing out of the enforcement of local segregation ordinances. Again what seemed a broad commitment and extensive interference with local matters was in practice very carefully circumscribed, as demonstrated by the Air Force policy statement issued in the wake of the secretary's order.
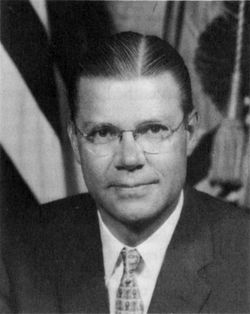
Secretary of Defense McNamara
Reserves and Regulars: A Comparison
While the interest of both civil rights advocates and defense officials was focused on off-base concerns during the early 1960's, discrimination continued to linger in the armed forces. A particularly sensitive issue to the services, which in the public mind had complete jurisdiction over all men in uniform, was the position of the Negro in the reserve components. To generalize on the racial policies of the fifty-four National Guard organizations is difficult, but whereas some state guards had been a progressive force in the integration of the services in the early postwar period, others had become symbols of racism by 1961. Some fourteen years after the Truman order, ten states with large black populations and understaffed guard units still had no Negroes in the guard. The Kennedy administration was not the first to wrestle with the problem of applying a single racial policy to both the regulars and the guard. It was aware that too much tampering with the politically influential and volatile guard could produce an explosion. At the same time any appearance of timidity courted antagonism from another quarter.
The move toward complete integration of the reserves was slow. In 1956, for example, more than 75 percent of the Army's reserve units in southern states were still segregated. The other services followed a similar pattern; in 1962 more than 40 percent of all reserve units in the country were white; the Army retained six all-black reserve units as well. Racial exclusion persisted in the Reserve Officers' Training Corps also, although here the fault was probably not so much a matter of reserve policy as the lingering segregation pattern in some state school systems. At the same time, the reserves had more blacks in nondrill status than in drill status. In other words, more blacks were in reserve pools where, unassigned to specific units, they did not participate in active duty training. In 1962, some 75 percent of the black reservists in the Army and Air Force, 85 percent in the Navy, and 38 percent in the Marine Corps were assigned to such pools. For many reservists, paid drill status was desirable; apart from the money received for such active duty, they had the opportunity to gain credit toward retirement and pensions.
Pleas of an absence of legal authority in regard to the National Guard and generalized promises of racial reform in the reserves were not going to still the complaints of the civil rights organizations nor discourage the interest of their allies in the administration. Clearly, the Department of Defense would be hearing more about race in the reserve components in the months to come.
At first glance the 1963 study of racial discrimination by the U.S. Commission on Civil Rights seemed to contradict Diggs's charges. The commission concluded that taken as a whole the status of black servicemen had improved considerably since the Truman order. It noted that black representation had remained relatively constant since the early days of integration, 8.2 percent of the total, 9.2 percent of the enlisted strength, and approached national population averages. The percentage of black officers, 1.6 percent of all officers, while admittedly low, had been rising steadily and compared favorably with the number of black executives in the civilian economy. The occupational status of the black enlisted man had also undergone steady improvement since the early days of integration, especially when one compared the number and variety of military occupation specialties held by black servicemen with opportunities in the rest of the civil service and the business community.
These important generalizations aside, the commission nevertheless offered impressive statistical support for some of Diggs's charges when it investigated the diverse and conflicting enlistment and assignment patterns of the different services. The Navy and Marine Corps came in for special criticism. Even when the complexities of mental aptitude requirements and use of draftees versus enlistees were discounted, the commission found that these two services consistently employed a significantly smaller percentage of Negroes than the Army and Air Force. A similar disparity existed in assignment procedures. The commission found that both services failed to match the record of the civilian economy in the use of Negroes in technical, mechanical, administrative, clerical, and craft fields. It suspected that the services' recruiting and testing methods intensified these differences and wondered whether they might not operate to exclude Negroes in some instances.
They found a general increase in black strength ratios between 1949 and 1962 (Table 13). They blamed the "selective" recruiting practices in vogue before the Truman order for the low enlistment ratios in 1949, just as they attributed the modest increases since that time to the effects of the services' equal treatment and opportunity programs. In the judgment of these analysts, racial differences in representation since the Truman order, and indeed most of the other discrepancies between black and white servicemen, could usually be explained by the sometimes sharp difference in aptitude test results (Table 14). A heritage of the Negro's limited, often segregated and inferior education and his economic and related environmental handicaps, low aptitude scores certainly explained the contrast in disqualification rates (Tables 15 and 16). By 1962 fully half of all Negroes—as compared to 8 percent of all whites—failed to qualify for service under minimum mental test standards. In some southern states, the draftee rejection rate for Negroes exceeded 80 percent.
Table 13—Black Strength in the Armed Forces for Selected Years (In Percentage)
Army Navy Marine Corps Air Force
Year Enlisted Men Officers Enlisted Men Officers Enlisted Men Officers Enlisted Men Officers
1949 12.4 1.8 4.7 0.0 2.1 0.0 5.1 0.6
1954 13.7 3.0 3.6 0.1 6.5 0.1 8.6 1.1
1962 12.2 3.2 5.2 0.2 7.6 0.2 9.2 1.2
Table 14—Estimated Percentage Distribution of Draft-Age Males in U.S. Population by AFQT Groups (Based on Preinduction Examination, 1959-1962)
Group White Nonwhite
I 11.8 0.3
II 31.3 2.6
III 31.9 15.0
IV 19.0 40.1
V 6.0 42.0
Table 15—Rate of Men Disqualified for Service in 1962 (In Percentage)
Cause White Nonwhite
Medical and other 21.8 10.1
Mental test failure 8.4 50.6
Total 30.2 60.7
Table 16—Rejection Rates for Failure to Pass Armed Forces Mental Test, 1962
Area Number Examined Failed Mental Test
Number Percent
Grand total, Continental United States 286,152 64,536 22.6
Total, white 235,678 36,204 15.4
Total, black 50,474 28,332 56.1
First Army: Connecticut, Maine, Massachusetts, New Hampshire, New Jersey, New York, Rhode Island, Vermont
White 49,171 12,989 26.4
Black 7,937 3,976 50.1
Second Army: Delaware, Washington, D.C., Kentucky, Maryland, Ohio, Pennsylvania, Virginia, West Virginia
White 48,641 5,888 12.1
Black 9,563 4,255 44.5
Third Army: Alabama, Florida, Georgia, Mississippi, North Carolina, South Carolina, Tennessee
White 30,242 5,786 19.1
Black 20,343 13,772 67.7
Fourth Army: Arkansas, Louisiana, New Mexico, Oklahoma, Texas
White 15,048 2,039 13.5
Black 4,796 2,988 62.3
Fifth Army: Colorado, Illinois, Iowa, Michigan, Minnesota, Missouri, Nebraska, North Dakota, South Dakota, Wisconsin, Wyoming
White 51,117 4,495 8.9
Black 5,723 2,684 46.9
Sixth Army: Arizona, California, Idaho, Montana, Nevada, Oregon, Utah, Washington
White 41,459 5,007 12.1
Black 2,112 657 31.1
This problem became critical for black enlistments in the mid-1950's when the services, with less need for new servicemen, raised the mental standards for enlistees, denying Group IV men the right to enlist. (An exception to this pattern was the Navy's decision to accept Group IV enlistments in 1956 and 1957 to replace post-Korean enlistment losses.) In terms of total black representation, however, the new mental standards made a lesser difference (Table 17). Denying Group IV men enlistment during the 1950's only increased their number in the draft pool, and when the Army stepped up draft inductions in the early 1960's the number of Group IV men in uniform, including Negroes, rapidly increased.
Table 17—Nonwhite Inductions and First Enlistments, Fiscal Years 1953-1962[1]
Fiscal Year Total Accessions (000) [1] Percent Nonwhite
DOD Army Navy Marine Corps Air force
Inductees [2] Enlistees
1953 886.1 12.8 14.7 13.4 4.3 8.0 11.1
1954 576.3 10.0 9.9 13.0 4.0 7.8 11.9
1955 622.6 10.6 8.8 12.7 9.0 5.4 13.5
1956 481.9 11.2 10.3 15.1 9.5 10.6 12.2
1957 456.7 9.1 10.8 9.3 3.6 9.5 9.7
1958 367.1 7.9 13.2 6.4 2.8 5.1 7.1
1959 392.0 7.1 10.4 8.1 2.4 5.0 6.5
1960 389.4 8.1 12.3 8.4 3.0 7.9 8.4
1961 394.7 8.2 14.4 8.2 2.9 5.9 9.5
1962 518.6 9.7 15.3 9.0 4.1 6.5 8.6
Total 5,085.4 9.9 12.3 10.3 4.9 7.4 10.4
Tablenote 1: Includes inductions and male "non-prior service" enlistments into the Regular components. Tablenote 2: The Army was the only service drafting men during this decade.
While the Army's dependence on the draft, and thus Group IV men, explained part of the continuing high percentage of Negroes in that service, the Defense Department manpower group was at a loss to explain the notable variation in black enlistments among the services. All employed similar enlistment standards, yet during the period 1958—1960, for example, black enlistment in the Army and Air Force averaged 7 percent, the Marine Corps 6 percent, and the Navy 2.7 percent. Nor could the analysts isolate the factors contributing to the low officer ratios in all four services. Almost all military officers during the period under analysis were college graduates, Negroes comprised about 4 percent of all male college graduates, yet only the Army maintained a black officer ratio approaching that figure. (See Table 13.)
The inability of many black servicemen to score highly in the tests might also explain why training in some technical occupations continued more restricted for them (Tables 18 and 19). In contrast to ground combat and service occupations, which required little formal school training, some occupation groups—electronics, for example—had high selection standards. The Defense Department group admitted that occupations for blacks in the armed forces had also been influenced by historical patterns of segregated assignments to food service and other support occupations. Among men with twenty or more years in uniform, 40 percent of the blacks and 12 percent of the whites were assigned to service occupations. But this pattern was changing, the analysts pointed out. The reduction in the differential between whites and blacks in service occupations among more recent recruits clearly reflected the impact of policies designed to equalize opportunities (Table 20). These policies had brought about an increasing proportion of Negroes in white collar skills as well as in ground combat skills.
Table 18—Distribution of Enlisted Personnel in Each Major Occupation, 1956
Occupation Percentage Distribution by AFQT Groups
I & II III IV
Electronics 60.3 31.4 8.3
Other technical 57.9 30.7 11.4
Admin. & clerical 51.5 37.4 11.1
Mechanics & repairmen 37.6 43.8 18.6
Crafts 30.0 44.1 25.9
Services 21.5 43.3 35.2
Ground combat 24.5 37.1 38.4
Table 19—Occupational Group Distribution by Race. All DOD, 1962
Percentage Distribution Total Percent of Negroes in Each Group
Negroes White
Ground combat 23.7 15.0 14.3
Electronics 7.0 14.9 4.7
Other technical 6.8 7.7 8.5
Admin. & clerical 21.5 19.2 10.6
Mechanics & repairmen 15.1 26.0 5.8
Crafts 5.6 6.6 8.4
Services 20.3 10.7 16.6
Total 100.0 100.0 9.2
Table 20—Occupational Group Distribution of Enlisted Personnel By Length of Service and Race
White Black White Black White Black White Black White Black
Ground combat 20.3 32.7 9.8 17.7 9.6 17.8 9.8 14.5 8.4 12.5
Electronics 14.1 5.6 19.7 10.3 15.6 8.1 14.2 6.7 10.5 3.6
Other technical 7.5 7.1 7.3 7.0 7.8 6.8 8.6 6.1 7.3 5.0
Admin. & clerical 18.3 22.3 17.5 22.6 19.6 22.0 22.0 18.5 24.5 18.7
Mechanics 23.9 12.8 29.6 20.5 28.9 16.2 24.2 15.1 29.1 13.6
Crafts 5.3 4.0 6.9 7.4 7.7 6.8 8.8 7.2 8.6 6.1
Services 10.6 15.5 9.2 15.1 10.8 22.3 12.3 31.9 11.7 40.4
This change was dramatically highlighted by the occupational distribution of naval personnel in 1962 (Table 21). Among General Qualification Test Groups I and II, the percentage of Negroes assigned to service occupations, mainly stewards, commissarymen, and the like, declined from 22 percent of those with more than twelve years' service to 2 percent of those with less than twelve years' service, with sharp increases in the "other technical" group, mainly medical and dental specialists, and smaller increases in other technical skills. A similar trend also appeared in the lower mental categories. One persisting occupational difference was the tendency to assign a relatively large percentage of Negroes with high aptitudes to "other technical" skills and those of low aptitude to service occupations. The group admitted that these differences required further analysis.
Table 21—Percentage Distribution of Navy Enlisted Personnel by Race, AFQT Groups and Occupational Areas, and Length of Service, 1962
AFQT Group and Occupational Area[1] 0-12 Years 12 Years & Over
White Negro White Negro
Groups I and II
Electronics 35.7 29.5 25.6 21.1
Other technical 11.4 25.9 10.4 10.5
Admin. & clerical 8.5 10.9 14.6 14.0
Mechanics & repairmen 37.5 26.1 33.1 22.5
Crafts 6.4 5.4 12.9 10.3
Services .6 2.2 3.5 21.6
Total 100.0 100.0 100.0 100.0
Group III
Electronics 10.3 9.1 8.8 4.2
Other technical 7.1 12.3 6.2 3.0
Admin. & clerical 9.7 12.9 12.4 8.2
Mechanics & repairmen 56.7 42.2 36.7 16.5
Crafts 13.2 11.1 25.2 16.9
Services 3.0 12.4 10.8 51.2
Total 100.0 100.0 100.0 100.0
Group IV
Electronics 5.3 1.4 2.9 .5
Other technical 3.7 1.7 2.9 .4
Admin. & clerical 6.9 8.1 7.0 2.5
Mechanics & repairmen 60.8 44.2 35.8 7.3
Crafts 16.4 13.5 32.5 9.5
Services 6.9 31.1 19.4 79.7
Total 100.0 100.0 100.0 100.0
Tablenote 1: Excludes personnel not classified by occupation, such as recruits and general duty seamen.
Reporting on promotions, the Defense Department group found that the relatively limited advancement of black officers was caused chiefly by their disadvantage in point of time in service and grade, branch of service, and educational background (Table 22). Although the difference in grade distribution among black and white enlisted men was much smaller, it too seemed related to disadvantages in education and service occupation. Again, for Negroes entering the services since 1950, the grade distribution had become similar to that of whites. The Navy's experience illustrated this point. In the case of those entering the Navy since the Korean War, the grade distribution of whites and nonwhites within the first three mental categories was nearly identical (Table 23). The divergences were much wider among the more senior men in the service groups, but this was probably due at least in part to the concentration of senior black servicemen in relatively overmanned specialties, such as food service, where promotional opportunities were limited. With this exception little evidence exists that whites enjoyed an advantage over blacks in the matter of promotions in the enlisted ranks.
Table 22—Percentage Distribution of Blacks and Whites by Pay Grade, All DOD, 1962
Grade Black White
Officers
O-1 to O-2 35.9 34.5
O-3 47.7 30.2
O-4 12.1 18.0
O-5 4.0 12.0
O-6 to O-10 .3 5.3
Total 100.0 100.0
Enlisted Men
E-1 to E-3 45.5 46.9
E-4 23.1 19.6
E-5 20.1 16.1
E-6 8.2 10.0
E-7 to E-9 3.0 7.5
Total 100.0 100.0
Table 23—Percentage Distribution of Navy Enlisted Personnel by Race, AFQT Groups, Pay Grade, and Length of Service, 1962
Pay grade 0-12 Years Over 12 Years
White Negro White Negro
AFQT Groups I & II
E-1 to E-3 50.0 50.4 0.1 0.5
E-4 22.5 21.8 1.0 5.3
E-5 17.8 18.6 6.6 16.8
E-6 8.3 8.5 30.8 33.9
E-7 to E-9 1.4 .7 61.5 43.6
Total 100.0 100.0 100.0 100.0
AFQT Group III
E-1 to E-3 60.6 60.5 0.5 3.5
E-4 20.7 20.4 4.4 14.7
E-5 13.1 14.2 19.3 28.8
E-6 5.1 4.6 40.1 33.7
E-7 to E-9 .5 .3 35.7 19.3
Total 100.0 100.0 100.0 100.0
AFQT Group IV
E-1 to E-3 77.1 61.2 2.2 12.2
E-4 13.0 23.3 14.9 32.6
E-5 7.9 13.0 34.0 29.9
E-6 1.9 2.4 32.4 19.3
E-7 to E-9 .1 [a] 16.5 6.0
Total 100.0 100.0 100.0 100.0
Tablenote a: Less than .05 percent.