PART IV (continued 2)
Reading edition
Some years ago there was received at Cornell University a letter from a boy working upon a farm in Canada. In this letter he said:
“I have read your leaflet entitled, ‘The Soil, What It Is,’ and as I trudged up and down the furrows every stone, every lump of earth, every shady knoll, every sod hollow had for me a new interest. The day passed, the work was done, and I at least had had a rich experience.”
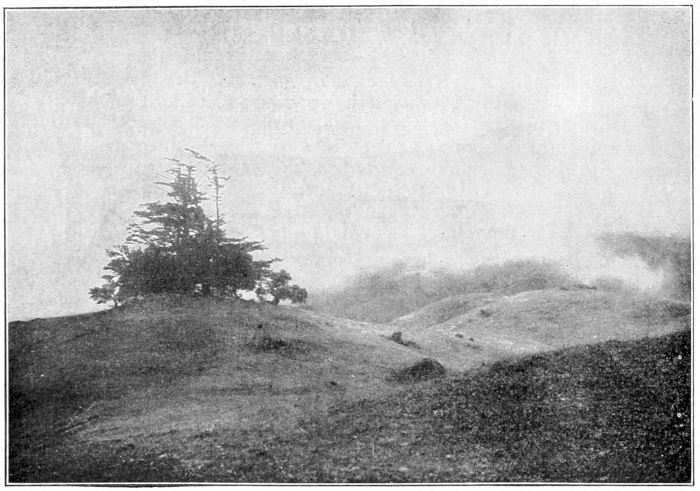
Fog on Mount Tamalpais, California.
Photo by G. K. Gilbert.
WATER FORMS
Teacher’s Story
Water, in its various changing forms, is an example of another overworked miracle—so common that we fail to see the miraculous in it. We cultivate the imagination of our children by tales of the Prince who became invisible when he put on his cap of darkness, and who made far journeys through the air on his magic carpet. And yet no cap of darkness ever wrought more astonishing disappearances than occur when this most common of our earth’s elements disappears from under our very eyes, dissolving into thin air. We cloak the miracle by saying “water evaporates,” but think once of the travels of one of these drops of water in its invisible cap! It may be a drop caught and clogged in a towel hung on the line after washing, but as soon as it dons its magic cap, it flies off in the atmosphere invisible to our eyes; and the next time any of its parts are evident to our senses, they may occur as a portion of the white masses of cloud sailing across the blue sky, the cloud which Shelley impersonates:
“I am the daughter of Earth and Water, And the nursling of the Sky; I pass through the pores of the ocean and shores; I change, but I cannot die.”
We have, however, learned the mysterious key-word which brings back the vapor spirit to our sight and touch. This word is “cold.” For if our drop of water, in its cap of darkness, meets in its travels an object which is cold, straightway the cap falls off and it becomes visible. If it be a stratum of cold air that meets the invisible wanderer, it becomes visible as a cloud, or as mist, or as rain. If the cold object be an ice pitcher, then it appears as drops on its surface, captured from the air and chained as “flowing tears” upon its cold surface. And again, if it be the cooling surface of the earth at night that captures the wanderer, it appears as dew.
But the story of the water magic is only half told. The cold brings back the invisible water vapor, forming it into visible drops; but if it is cold enough to freeze, then we behold another miracle, for the drops are changed to crystals. The cool window-pane at evening may be dimmed with mist caught from the air of the room; if we examine the mist with a lens we find it composed of tiny drops of water. But if the night be very cold, we find next morning upon the window-pane exquisite ferns, or stars, or trees, all formed of the crystals grown from the mist which was there the night before. Moreover, the drops of mist have been drawn together by crystal magic, leaving portions of the glass dry and clear.
If we examine the grass during a cool evening of October we find it pearled with dew, wrung from the atmosphere by the permeating coolness of the surface of the ground. If the following night be freezing cold, the next morning we find the grass blades covered with the beautiful crystals of hoar frost.
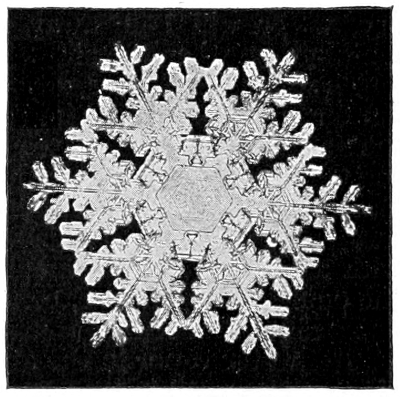
Composite snow crystal formed in high and medium clouds.
Photomicrograph by W. A. Bentley.
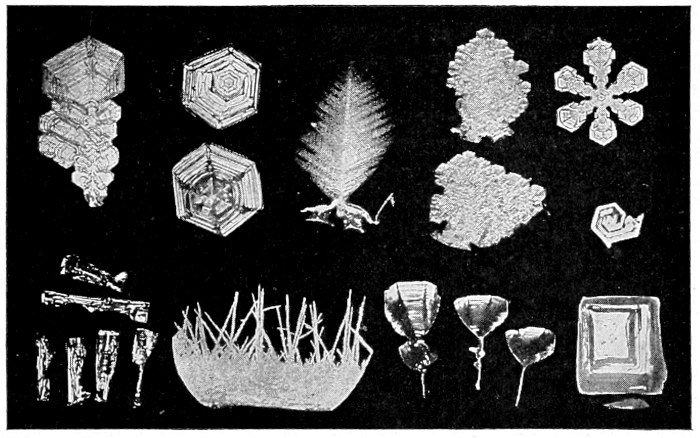
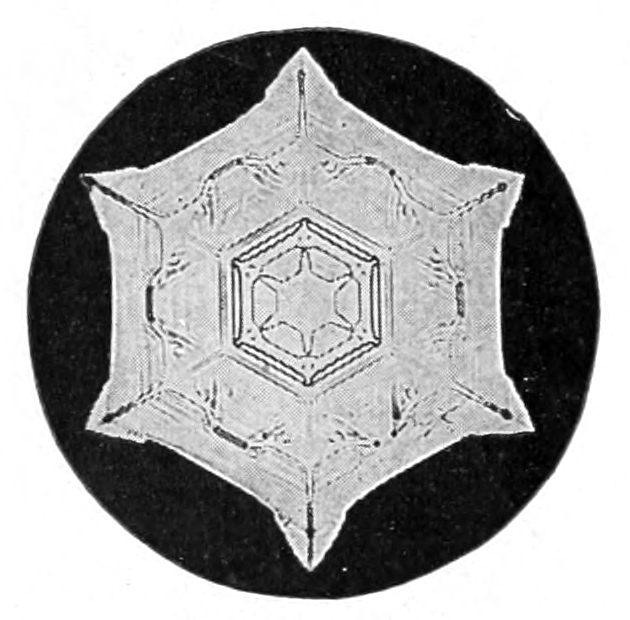
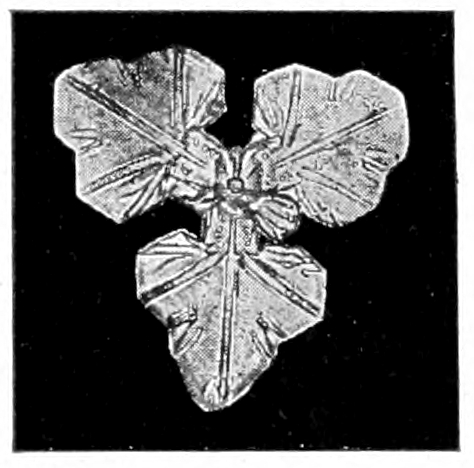
If a raincloud encounters a stratum of air cold enough to freeze, then what would have been rain or mist comes down to us as sleet, hail or snowflakes, and of all the forms of water crystals, that of snow in its perfection is the most beautiful; it is, indeed, the most beautiful of all crystals that we know. Why should water freezing freely in the air so demonstrate geometry by forming, as it does, a star with six rays, each set to another, at an angle of 60 degrees? And as if to prove geometry divine beyond cavil, sometimes the rays are only three in number—a factor of six—and include angles of twice 60 degrees. Moreover, the rays are decorated, making thousands of intricate and beautiful forms; but if one ray of the six is ornamented with additional crystals the other five are decorated likewise. Those snow crystals formed in the higher clouds and, therefore, in cooler regions may be more solid in form, the spaces in the angles being built out to the tips of the rays including air spaces set in symmetrical patterns: and some of the crystals may be columnar in form, the column being six-sided. While those snow crystals formed in the lower currents of air, and therefore in warmer regions, show their six rays marvellously ornamented. The reason why the snow crystals are so much more beautiful and perfect than the crystals of hoar frost or ice, is because they are formed from water vapor, and grow freely in the regions of the upper air. Mr. W. A. Bentley, who has spent many years photographing the snow crystals, has found more than 1300 distinct types.
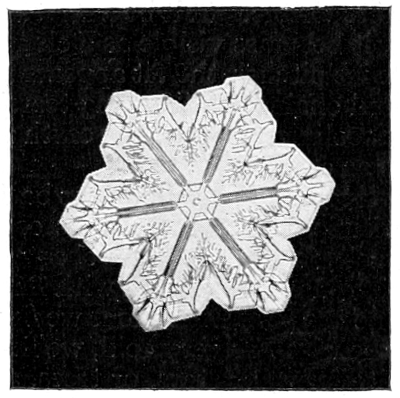
Snow crystal formed in high clouds.
Photomicrograph by W. A. Bentley.
The high clouds are composed of ice crystals formed from the cloud mists; such ice clouds form a halo when veiling the sun or the moon.
When the water changes to vapor and is absorbed into the atmosphere, we call the process evaporation. The water left in an open saucer will evaporate more rapidly than that in a covered saucer, because it comes in contact with more air. The clothes which are hung on the line wet, dry more rapidly if the air is dry and not damp; for if the air is damp, it means that it already has almost as much water in it as it can hold. The clothes will dry more rapidly when the air is hot, because hot air takes up moisture more readily and holds more of it than does cold air. The clothes will dry more rapidly on a windy day, because more air moves over them and comes in contact with them than on a still day.
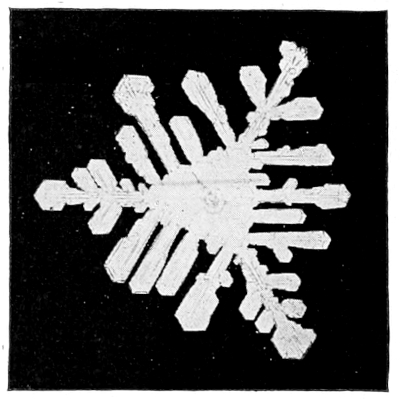
Blizzard type of snow crystal formed in low cloud.
Photomicrograph by W. A. Bentley.
If we observe a boiling teakettle, we can see a clear space of perhaps an inch or less in front of the spout. This space is filled with steam, which is hot air saturated with hot water vapor. But what we call “steam” from a kettle, is this same water vapor condensed back into thin drops of water or mist by coming into contact with the cooler air of the room. When the atmosphere is dry, water will boil away much more rapidly than when the air is damp.
The breath of a horse, or our own breath, is invisible during a warm day; but during a cold day, it is condensed to mist as soon as it is expelled from the nostrils and comes in contact with the cold air. The one who wears spectacles finds them unclouded during warm days; but in winter the glasses become cold out of doors, and as soon as they are brought into contact with the warmer, damp atmosphere of a room, they are covered with a mist. In a like manner, the window-pane in winter, cooled by the outside temperature, condenses on its inner surface the mist from the damp air of the room.
The water vapor in the atmosphere is invisible, and it moves with the air currents until it is wrung out by coming into contact with the cold. The air thus filled with water vapor may be entirely clear near the surface of the earth; but, as it rises, it comes in contact with cooler air and discharges its vapor in the form of mist, which we call clouds; and if there is enough vapor in the air when it meets a cold current, it is discharged as rain and falls back to the earth. Thus, when it is very cloudy, we think it will rain, because clouds consist of mist or fog; and if they are subjected to a colder temperature, the mist is condensed to rain. Thus, often in mountainous regions, the fog may be seen streaming and boiling over a mountain peak, and yet always disappears at a certain distance below it. This is because the temperature around the peak is cold and condenses the water vapor as fast as the wind brings it along, but the mist passes over and soon meets a warm current below and, presto, it disappears! It is then taken back into the atmosphere. The level base of a cumulus cloud has a stratum of warmer air below it, and marks the level of condensation.
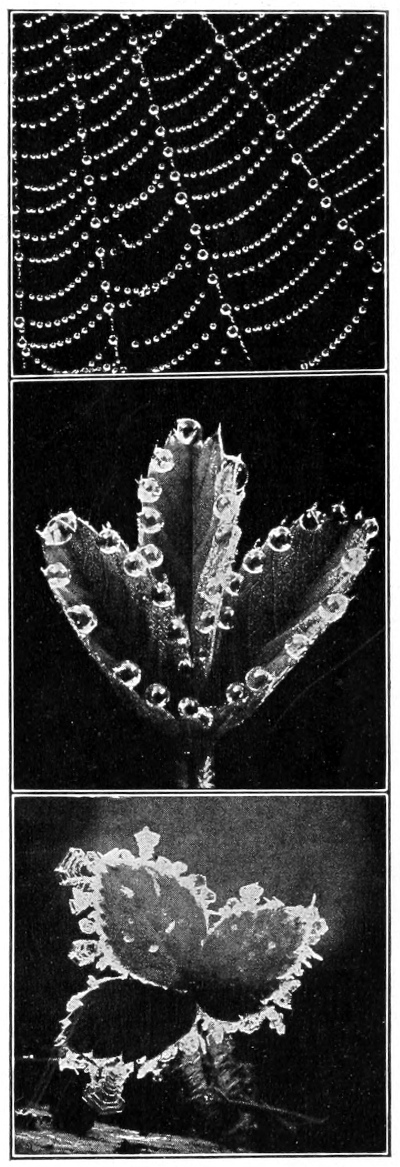
Dew on spider’s web; Dewdrops on strawberry leaf; Hoar frost on strawberry leaf.
Photographs by W. A. Bentley.
At the end of the day, the surface of the ground cools more quickly than the air above it. If it becomes sufficiently cold and the air is damp, then the water from it is condensed and dew is formed during the night. However, all dew is not always condensed from the atmosphere, since some of it is moisture pumped up by the plants, which could not evaporate in the cold night air. On windy nights, the stratum of air cooled by the surface of the earth is moved along and more air takes its place, and it therefore does not become cold enough to be obliged to yield up its water vapor as dew. If the weather during a dewy night becomes very cold, the dew becomes crystallized into hoar frost. The crystals of hoar frost are often very beautiful and are well worth our study.
The ice on the surface of a still pond begins to form usually around the edges first, and fine, lancelike needles of ice are sent out across the surface. It is a very interesting experience to watch the ice crystals form on a shallow pond of water. This may easily be seen during cold winter weather. It is equally interesting to watch the formation of the ice crystals in a glass bottle or jar. Water, in crystallizing, expands, and requires more room than it does as a fluid; therefore, as the water changes to ice it must have more room, and often presses so hard against the sides of the bottle as to break it. The ice in the surface soil of the wheat fields expands and buckles, holding fast in its grip the leaves of the young wheat and tearing them loose from their roots; this “heaving” is one cause for the winter-killing of wheat. Sleet consists of rain crystallized in the form of sharp needles. Hail consists of ice and snow compacted together, making the hard, more or less globular hailstones.
LESSON CCXXI
Water Forms
Leading thought—Water occurs as an invisible vapor in the air and also as mist and rain; and when subjected to freezing, it crystallizes into ice and frost and snow.
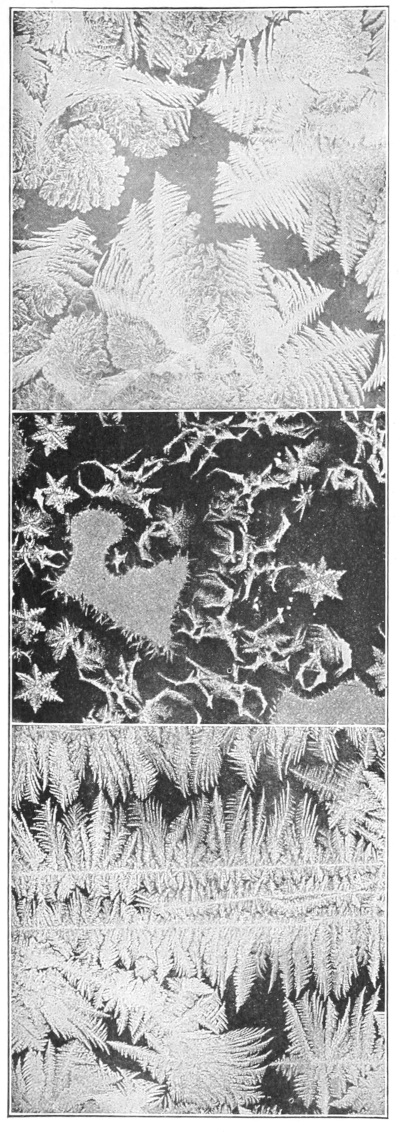
Frost crystals on window-pane.
Photo by W. A. Bentley.
Method—The answers to the questions of this lesson should, as far as possible, be given in the form of a demonstration. All of the experiments suggested should be tried, and the pupils should think the matter out for themselves. In the study of the snow crystals a compound microscope is a great help, but a hand lens will do. This part of the work must be done out of doors. The most advantageous time for studying the perfect snow crystals is when the snow is falling in small, hard flakes; since, when the snow is soft, there are many crystals massed together into great fleecy flakes, and they have lost their original form. The lessons on frost or dew may be given best in the autumn or spring.
Observations—1. Place a saucer filled with water near a stove or radiator; do not cover it nor disturb it. Place another saucer filled with water near this but cover it with a tight box. From which saucer does the water evaporate most rapidly? Why?
2. We hang the clothes, after they are washed, out of doors to dry; what becomes of the water that was in them? Will they dry more rapidly during a clear or during a damp day? Why? Will they dry more rapidly during a still or during a windy day? Why? Will they dry more rapidly during hot or cold weather? Why?
3. Watch a teakettle of water as it is boiling. Notice that near its spout there is no mist, but what we call steam is formed beyond this. Why is this so? What is steam? Why does water boil away? Do kettles boil dry sooner on some days than on others? Why?
4. If the water disappears in the atmosphere where does it go? Why do we say “the weather is damp”? What force is it that wrings the water out of the atmosphere?
Forms of hoar frost.
Photo by W. A. Bentley.
5. Why does the breath of a horse show as a mist on a cold day? Why do persons who wear spectacles find their glasses covered with mist as soon as they enter a warm room after having been out in the cold? Why do the window-panes become covered with mist during cold weather? Is the mist on the outside or on the inside? Why does steam show as a white mist? Why does the ice pitcher, on a warm day, become covered on the outside with drops of water? Would this happen on a cold day? Why not?
6. Why, when the water is invisible in the atmosphere, does it become visible as clouds? What causes the lower edges of cumulus clouds to be so level? What is fog? Why do clouds occur on mountain peaks? What causes rain?
7. What causes dew to form? When the grass is covered with dew, are the leaves of the higher trees likewise covered? Why not? What kind of weather must we have in order to have dewy nights? What must be the atmosphere of the air in relation to that of the ground in order to condense the dew? Does dew form on windy nights? Why not? Does all dew come from the air, or does some of it come from the ground through the plants? Why is not this water, pumped up by the plants, evaporated?
8. What happens to the dew if the weather becomes freezing during the night? What is hoar frost? Why should water change form when it is frozen? How many forms of frost crystals can you find on the grass on a frosty morning?
9. When a pond begins freezing over, what part of it freezes first? Describe how the first layer of ice is formed over the surface.
10. Place a bottle of water out of doors in freezing weather. How does the ice appear in it at first? What happens later? Why does the bottle break? How is it that water which has filled the crevices of rocks scales off pieces of the rock in cold weather? Why does winter wheat “winter-kill” on wet soil?
11. Why does frost form on a window-pane? How many different figures can you trace on a frosted pane? Are there any long, needlelike forms? Are there star forms? Can you find forms that resemble ferns and trees? Do you sometimes see, on boards or on the pavement, frost in forms like those on the window-pane?
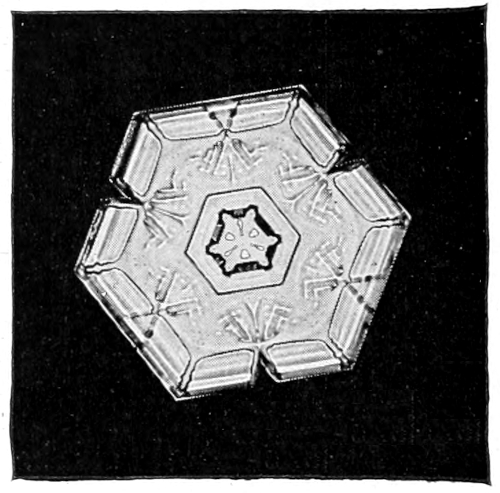
High cloud snow crystal.
Photomicrograph by W. A. Bentley.
12. When there is a fine, dry snow falling, take a piece of dark flannel and catch some flakes upon it. Examine them with a lens, being careful not to breathe upon them. How many forms of snow crystals can you find? How many rays are there in the star-shaped snow crystals? Do you find any solid crystals? Can you find any crystals that are triangular? When the snow is falling in large, feathery flakes, can you find the crystals? Why not?
13. What is the difference between a hailstone and a snow crystal? What is sleet?
Supplementary reading—Water Wonders, Thompson; Forms of Water, Tyndall.
“When in the night we wake and hear the rain Which on the white bloom of the orchard falls, And on the young, green wheat-blades, where thought recalls How in the furrow stands the rusting plow, Then fancy pictures what the day will see— The ducklings paddling in the puddled lane, Sheep grazing slowly up the emerald slope, Clear bird-notes ringing, and the droning bee Among the lilac’s bloom—enchanting hope— How fair the fading dreams we entertain, When in the night we wake and hear the rain!” —Robert Burns Wilson.
“The thin snow now driving from the north and lodging on my coat consists of those beautiful star crystals, not cottony and chubby spokes, but thin and partly transparent crystals. They are about a tenth of an inch in diameter, perfect little wheels with six spokes without a tire, or rather with six perfect little leaflets, fern-like, with a distinct straight and slender midrib, raying from the center. On each side of each midrib there is a transparent thin blade with a crenate edge. How full of creative genius is the air in which these are generated! I should hardly admire more if real stars fell and lodged on my coat. Nature is full of genius, full of divinity. Nothing is cheap and coarse, neither dewdrops nor snowflakes.”
“A divinity must have stirred within them before the crystals did thus shoot and set. Wheels of storm-chariots. The same law that shapes the earth-star shapes the snow-stars. As surely as the petals of a flower are fixed, each of these countless snow-stars comes whirling to earth, pronouncing thus, with emphasis, the number six.”—Thoreau’s Journal.
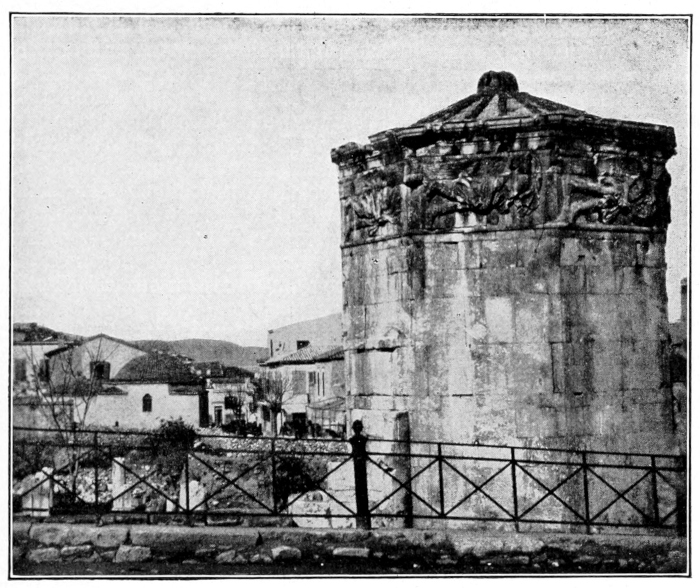
Temple of the winds at Athens.
Photo by J. H. Comstock.
THE WEATHER
By Wilford M. Wilson Section Director, U. S. Weather Bureau, and Professor of Meteorology in Cornell University.
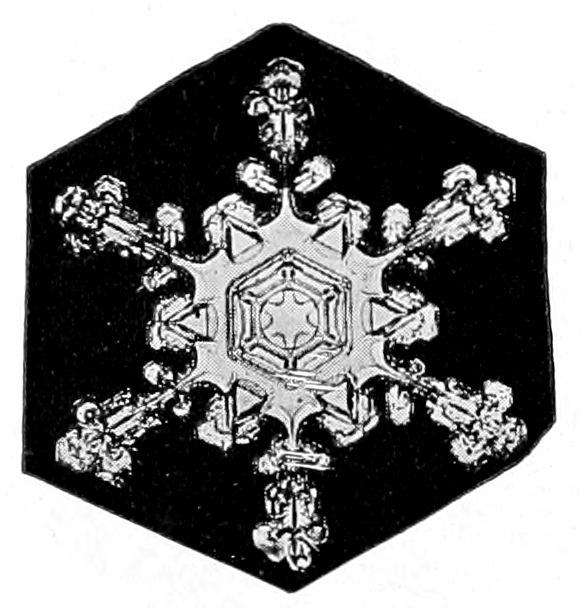
Composite snow crystal; the center formed in a high cloud and the margins in a lower cloud. Photomicrograph by W. A. Bentley.
The atmosphere, at the bottom of which we live, may be compared to a great ocean of air, about two hundred miles deep, resting upon the earth. The changes and movements that take place in this ocean of air, the storms that invade it, the clouds that float in it, the sunshine, the rain, the dew, the sleet, the frost, the snow, and the hail are termed “weather.” We live in it; we partake of its moods; we reflect its sunshine and shadows; it invades the everyday affairs of life, influences every business and social activity, and molds the character of nations; and yet nearly everything we know about the weather has been learned within the lifetime of the present generation. Not that the weather did not interest men of early times, but the problem appeared to be so complicated and so complex that it baffled their utmost endeavors.
The Temple of the Winds at Athens
The Temple of the Winds, erected probably about five hundred years B. C., indicates the knowledge of the weather possessed by the ancient Greeks. This temple is a little octagon tower, the eight sides of which face the eight principal winds. On each of its eight sides is a human figure cut in the marble, symbolizing the kind of weather the wind from that particular direction brought to Athens.
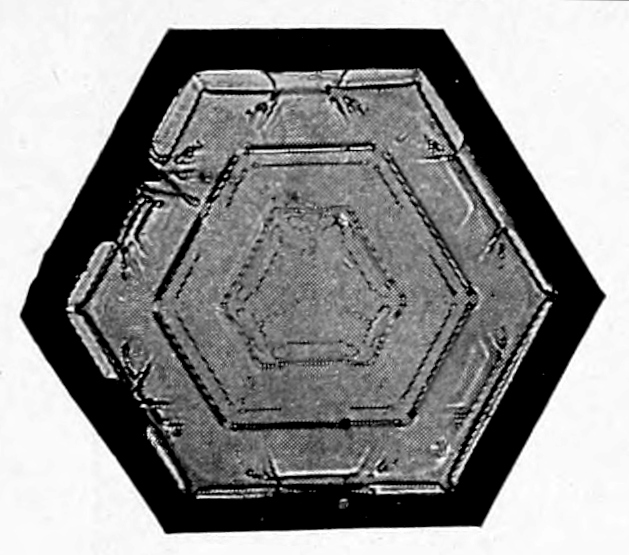
Snow crystal.
Photomicrograph by W. A. Bentley.
Boreas, the cold north wind, is represented by the figure of an old man wearing a thick mantle, high buskins (boots) and blowing on a “weathered horn.” The northeast wind, which brought, and still brings to Athens, cold, snow, sleet and hail, is symbolized by a man with a severe countenance who is rattling slingstones in a shield, thus expressing the noise made by the falling hail and sleet.
The east wind, which brought weather favorable to the growth of vegetation, is shown by the figure of a beautiful youth bearing fruit and flowers in his tucked-up mantle.
Natos, the warm south wind, brought rain, and he is about to pour the water over the earth from the jar which he carries.
Lips, the southwest wind, beloved of the Greek sailors, drives a ship before him, while Zephros, the gentle west wind, is represented by a youth lightly clad, scattering flowers as he goes.
The northwest wind, which brought dry and sometimes hot weather to Athens, is symbolized in the figure of a man holding a vessel of charcoal in his hands. Thus, the character of the weather brought by each separate wind is fixed in stone, and from this record we learn that, even with the lapse of twenty centuries, there has come no material change.
Historical
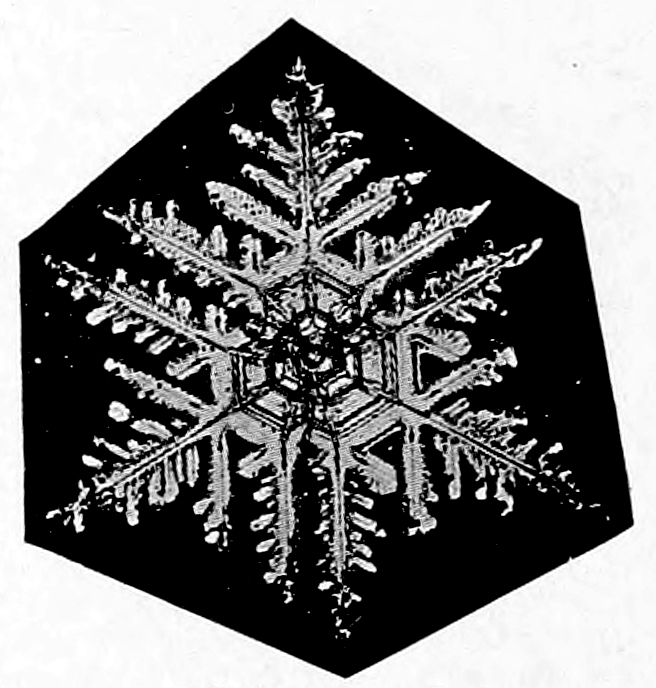
Snow crystal.
Photomicrograph by W. A. Bentley.
There is no record of any rational progress having been made in the study of the weather until about the middle of the seventeenth century, when Torricelli discovered the principles of the barometer. This was a most important discovery and marks the beginning of the modern science of meteorology. Soon after Torricelli’s discovery of the barometer his great teacher, Galileo, discovered the thermometer, and thus made possible the collection of data upon which all meteorological investigations are based. About one hundred years after the discovery of the barometer, Benjamin Franklin made a discovery of equal importance. He demonstrated that storms were eddies in the atmosphere, and that they progressed or moved as a whole, along the surface of the earth.
It might be interesting to learn how Franklin made this discovery. Franklin, being interested at that time in astronomy, had arranged with a friend in Boston to take observations of a lunar eclipse at the same time that he, himself, was to take observations at Philadelphia. On the night of the eclipse a terrific northeast wind and rain storm set in at Philadelphia, and Franklin was unable to make any observations. He reasoned, that as the wind blew from the northeast, the storm must have been experienced in Boston before it reached Philadelphia. But imagine his surprise, when he heard from his friend in Boston that the night had been clear and favorable for observation, but that a fierce wind and rain storm set in on the following morning. Franklin determined to investigate. He sent out letters of inquiry to all surrounding mail stations, asking for the time of the beginning and ending of the storm, the direction and strength of the wind, etc. When the information contained in the replies was charted on a map it showed that, at all places to the southwest of Philadelphia, the beginning of the storm was earlier than at Philadelphia, while at all places to the northeast of Philadelphia the beginning of the storm was later than at Philadelphia. Likewise, the ending was earlier to the southwest and later to the northeast of Philadelphia than at Philadelphia. He also found that the winds in every instance passed through a regular sequence, setting in from some easterly point and veering to the south as the storm progressed, then to the southeast and finally to the west or northwest as the storm passed away and the weather cleared.
A further study of these facts convinced Franklin that the storm was an eddy in the atmosphere, and that the eddy moved as a whole from the southwest toward the northeast, and that the winds blew from all directions toward the center of the eddy, impelled by what he termed suction.
Franklin was so far in advance of his time that his ideas about storms made little impression on his contemporaries, and so it remained for Redfield, Espy, Loomis, Henry and Maury and other American meteorologists, a hundred years later, to show that Franklin had gained the first essentially correct and adequate conception of the structure and movement of storms.
During the first half of the nineteenth century, considerable progress was made in the study of storms, principally by American meteorologists, among whom was William Redfield of New York, who first demonstrated that storms had both a rotary and progressive movement. James Espy followed Redfield in the construction of weather maps, although he had already published much on meteorological subjects before the latter entered the field.
Professor Joseph Henry, Secretary of the Smithsonian Institution at Washington, was the first to prepare a daily weather map from observations collected by telegraph. He made no attempt to make forecasts, but used his weather map to demonstrate to members of Congress the feasibility of a national weather service.
An incident occurred during the Crimean War that gave meteorology a great impetus, especially in Europe. On November 10th, 1854, while the French fleet was at anchor in the Black Sea, a storm of great intensity occurred which practically destroyed its effectiveness against the enemy. The investigation that followed showed that the storm came from western Europe, and had there been adequate means of communication and its character and direction of progress been known, it would have been possible to have warned the fleet of its approach and thus afforded an opportunity for its protection.
This report created a profound impression among scientific men and active measures were taken at once that resulted in the organization of weather services in the principal countries of Europe between 1855 and 1860.
The work of Professor Henry Abbe, and others in this country would, doubtless, have resulted in such an organization in the United States in the early 60’s, had not the Civil War intervened, absorbing public attention to the exclusion of other matters. It was not until 1870, that Dr. Increase A. Lapham of Milwaukee, in conjunction with Representative Paine of that city, was able so to present the claims for a national weather service that the act was finally passed that gave birth to the present meteorological bureau in the United States. Dr. Lapham issued from Chicago on November 10, 1871, the first official forecast of the weather made in this country.
The Atmosphere
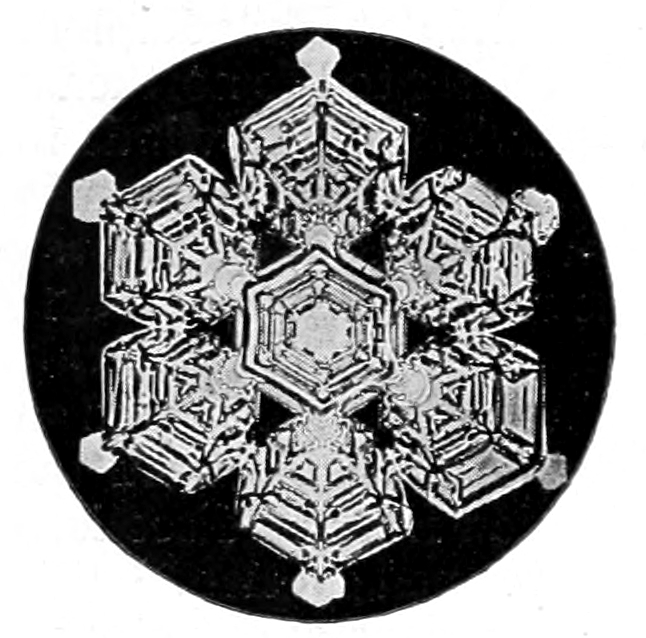
Snow crystal.
Photomicrograph by W. A. Bentley.
What is known about the atmosphere of our earth has been learned from the exploration of a comparatively thin layer at the bottom. There is reason to believe that the atmosphere extends upwards about two hundred miles from the surface of the earth. We have a great mass of observations made at the surface, some on mountains, but few in the free air more than a few miles above the surface. Our knowledge of the upper atmosphere is, therefore, in the nature of conclusions drawn from such observations as are at hand, and is subject to changes and modifications as the facts become known by actual observation.
During the past few years a concerted effort has been made in various parts of the world to explore the upper atmosphere by means of kites and balloons, carrying meteorological instruments that automatically record the temperature, pressure, humidity, velocity and direction of the wind, etc. In this country this work has been carried on principally at the Mount Weather Observatory, which is located in Loudon County, Virginia, and is under the direction of the United States Weather Bureau and at Blue Hill Observatory, a private institution located near Boston and supported by Professor Lawrence Rotch. From observations thus obtained much has been learned about the upper atmosphere that was not even suspected before. Some theories have been confirmed and some destroyed, but this line of research is gradually bringing us nearer the truth.
Air as a Gas
Air is not a simple substance, as was once supposed, but is composed of a number of gases, each one of which tends to form an atmosphere of its own, just as it would if none of the other gases were present. The different gases of the atmosphere are not chemically combined but are very thoroughly mixed, as one might mix sugar and salt. Samples of air collected from all parts of the world show that the relative proportion of the gases forming the atmosphere is practically uniform.
The Composition of Air
Dry air is composed chiefly of oxygen and nitrogen. There are, however, small quantities of carbon dioxide, argon, helium, krepton, neon, hydrogen and xenon, and probably other gases yet to be discovered.
The approximate proportion, by volume is as follows: Nitrogen 78 parts, oxygen 21 parts, argon 1 part, carbon-dioxide .03 parts, and krepton helium and xenon a trace. Pure dry air does not exist in nature, so there is always present in natural air a variable amount of water vapor, depending upon the temperature and the source of supply. Besides these, which may be termed the permanent constituents of the atmosphere, many other substances are occasionally met with. Lightning produces minute quantities of ammonia, nitrous acid and ozone. Dust comes from the earth, salt from the sea, while innumerable micro-organisms, most of which are harmless, besides the pollen and spores of plants, are frequently found floating in the atmosphere. Recent investigations in atmospheric electricity lead to the conclusion that electric ions are also present, and perform important functions, especially with respect to precipitation.
Oxygen
Oxygen is one of the most common substances. It exists in the atmosphere as a transparent, odorless, tasteless gas. It combines with hydrogen to form the water of the oceans, and with various other substances to form much of the solid crust of the earth. Chemically, it is a very active gas, and because of its tendency to unite with other substances to form chemical compounds, it is believed that the volume of oxygen now in the atmosphere, is less than during the early history of the earth. It supports combustion by combining with carbon and other substances, producing light and heat. It combines with some of the organic constituents of the blood, through the function of respiration, which is in itself a slow process of combustion, and thus supports life and maintains the bodily heat.
Nitrogen
Nitrogen forms the largest proportion of the atmosphere, but unlike oxygen it is a very inert substance, uniting with no element at ordinary temperatures, and at high temperatures with only a few; and when so united the bonds that hold it are easily broken and the gas set free. For this reason, it is utilized in the manufacture of explosives, such as gunpowder, guncotton, nitroglycerine, dynamite, etc. Its office in the atmosphere appears to be to give the air greater weight and to dilute the oxygen, for in an atmosphere of pure oxygen a fire once started could not be controlled. Although nitrogen does not contribute directly to animal life, in that it is not absorbed and assimilated from the air direct as oxygen is, nevertheless, it is a very important element of food both for animals and plants, and in combination with other substances forms a large proportion of animal and vegetable tissues.
Carbon Dioxide
Carbonic acid gas, known chemically as CO₂ is a product of combustion. It results from the burning of fuel and is exhaled by the breathing of animals. It also results from certain chemical reactions. The amount in the atmosphere varies slightly, being somewhat greater at night than by day and during cloudy weather than during clear weather. Air containing more than 0.06% of carbon dioxide is not fit to breathe, not because air loaded with carbon dioxide is poisonous, but because it excludes the oxygen and thus produces death by suffocation. It is considerably heavier than air, and in certain localities, where it is emitted from the ground, accumulates in low places in such quantities as to suffocate animals. Death’s Gulch, a deep ravine in Yellowstone Park, and Dog’s Grotto near Naples, are examples. At the latter place, the gas, on account of being heavier than air, lies so close to the ground that a man, standing erect, will have no difficulty in breathing, while a dog will die of suffocation. It also accumulates in unused wells, cisterns and mines, and can usually be detected by lowering a lighted candle. If carbon dioxide is present in large quantities, the candle will be extinguished because of the lack of oxygen to support combustion.
Although carbon dioxide forms but a small proportion of the atmosphere, it is a very important element in plant life. Animals consume oxygen and exhale carbon dioxide, while plants take in carbon dioxide and give off oxygen; thus, the amount of these gases in the atmosphere is maintained at an equilibrium. Plants, through their leaves, absorb the carbon dioxide, which is decomposed by the sunlight, returning the oxygen free into the air, while the carbon is used to build up plant tissue.
Other Gases
Argon, on account of its resemblance to nitrogen, was not discovered until 1894, having been included with the nitrogen in all previous analyses of air. It constitutes about 1% of air by volume. Krepton, neon and xenon exist in minute quantities and have some interest chemically, but little for the meteorologists. Helium and hydrogen probably exist at great elevations in the atmosphere.
Water Vapor
The vapor of water in the atmosphere varies from about one per cent. for arid regions to about five per cent. of the weight of the air for warm, humid regions. It is a little over one-half as heavy as air and moist air is, therefore, lighter than dry air; but the increase of moisture near the center of cyclones has only a slight effect in reducing the pressure. The amount of vapor decreases very rapidly with elevation, and probably disappears at an elevation of five or six miles above the surface. The amount of water in the form of vapor that can exist in the atmosphere increases with the temperature, being .54 grains Troy per cubic foot at zero temperature and 14.81 at 90°. When the air has taken up all the moisture it can contain at a given temperature it is said to be saturated.
The dewpoint is the temperature at which saturation occurs. If the air is saturated, the temperature of the air and the dewpoint will be the same, but if the air is not saturated the dewpoint will be below that of the air.
Relative humidity is expressed in percentages of the amount necessary to saturate. If the air contains one-half enough vapor to saturate it, the relative humidity will be 50%; if one-fourth, enough to saturate, 25%; if saturated 100% etc.
The absolute humidity is the actual amount of water in the form of vapor in the air, and is usually expressed by weight in grains per cubic foot or in inches of mercury, the weight of which would counterbalance the weight of the vapor in the air. The conditions present in a volume of saturated air at a temperature of 32° may be expressed as follows: Relative humidity 100%; dewpoint 32°; absolute humidity 2.11 grains per cu. ft. or .18 inch.
Pressure of Atmosphere
Although the atmosphere is composed of these various gases, it acts in all respects like a simple, single gas. It is very elastic, easily compressed, expands when heated and contracts when cooled. It is acted upon by gravity and, therefore, has weight and exerts pressure, which at sea level amount to about 14.7 pounds on each square inch of the surface. Because it is compressible and has weight, it is more dense at the surface than at any elevation above the surface, and as we ascend in the atmosphere the weight or pressure decreases in proportion to the weight of that part of the atmosphere left below. The weight or pressure of the atmosphere is measured by means of a barometer and is expressed in terms of inches of mercury. The normal atmosphere at sea level will sustain a column of mercury about thirty inches high, and we therefore say that the normal pressure of the atmosphere is thirty inches. (See Lessons on air pressure and the barometer.)
The Height of the Atmosphere
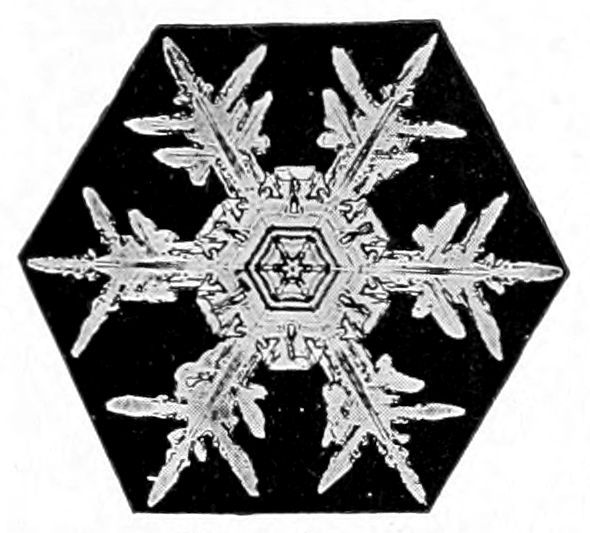
Snow crystal.
Photomicrograph by W. A. Bentley.
The air that surrounds the earth is called its atmosphere, but it is a rather curious fact that the earth has really ten atmospheres and may have others not yet discovered.
The air near the surface is a mixture of eight different gases, and each individual gas arranges itself so as to form an atmosphere just as it would if no other gases were present. Thus, the earth is surrounded by an atmosphere of oxygen, an atmosphere of nitrogen, one of carbon dioxide, one of water vapor, one each of argon, krypton, neon, and xenon, while hydrogen and helium are believed to exist at great elevations above the earth’s surface.
These gases are kept from flying off into space by the force of gravity, just as a piece of iron, stone, or a building is held fast to the earth by the same force. Gravity acts with greater force on some things than on others. For example, a piece of iron is pulled down by gravity with greater force than is a piece of wood of the same size; likewise, a piece of lead is pulled down with greater force than a piece of iron. We, therefore, say that iron is heavier than wood and that lead is heavier than iron, simply because gravity acts with greater force on the one than on the other. The weight of gases differ just as the weight of different solids, such as lead, wood or iron differ. For instance, nitrogen is 14 and oxygen 16 times heavier than hydrogen.
Gases having the least weight extend upward the farthest, because the lighter the gas the greater its expansive force. Every boy who rides a bicycle takes advantage of the expansive force of air when he pumps his tires. The air is compressed by the pump into the tube and the expansive force exerted by the air in trying to expand makes the tire “stand up.” If it requires 10 pounds pressure to compress the gas into the tube, the expansive force will be just ten pounds.
There are two forces in constant operation on each gas that surrounds the earth, viz., expansive force and gravity. Expansive force pushes the gas up and gravity pulls it down, but the force of gravity decreases as the distance from the center of the earth increases, so there is a point at a certain distance above the earth where the two forces just balance each other, and each gas will expand upward to that point but will not rise beyond it. Therefore, if we know the expansive force of a gas and the rate at which gravity decreases, it is possible to calculate the height to which the different gases that compose the air will rise.
In this way it has been determined that carbon dioxide, which is one of the heavier gases, extends upward about ten miles, water vapor about 12 miles, oxygen about 30 miles and nitrogen about 35 miles while hydrogen and helium, the lightest gases known, do not appear at the surface at all, but probably exist at a height of from 30 miles to possibly 200 miles.
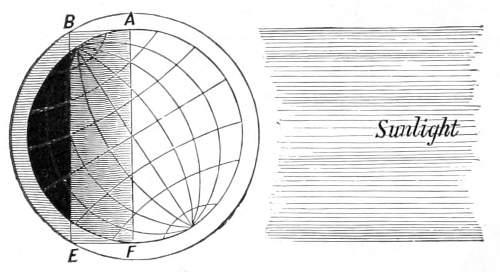
The zone of twilight in midwinter.
From Todd’s New Astronomy.
There are other ways in which we are able to gain some idea of the approximate height at which there is an appreciable atmosphere. When the rays of light from the sun enter our atmosphere they are broken up or scattered—diffracted—so that the atmosphere is partially lighted for some time before sunrise and after sunset. This is called twilight. If there were no atmosphere, there would be no twilight, and darkness would fall the instant the sun passed below the horizon. Twilight, which is caused by the sun shining on the upper atmosphere, is perceptible until the sun is about 16° below the horizon. From this it is calculated that the atmosphere has sufficient density at a height of 40 miles to scatter, or diffract, sunlight.
Observations of meteors, commonly called shooting stars, indicate that there is an appreciable atmosphere at a height of nearly 200 miles. Meteors are solid bodies flying with great velocity through space. Occasionally they enter our atmosphere. Their velocity is so great that the slight resistance offered by the air generates enough heat by friction, or by the compression of the air in the path of the meteor, to make it red hot or to burn it up before it reaches the bottom of the atmosphere. Only the largest meteors reach the earth.
When a meteor is observed by two or more persons at a known distance from each other, and the angle which the line of vision makes with the horizon is noted by each, it is a simple matter to calculate the distance from the earth where the lines of vision intersect, and thus determine the height of the meteor. In this way, reliable observations have given the height at which there is sufficient density in the atmosphere to render meteors luminous as 188 miles.
Temperature of the Atmosphere
The condition of the atmosphere with respect to its temperature is determined by means of the thermometer. This instrument is in such common use that a detailed description is not necessary. It might be interesting to note that the instrument invented by Galileo was very different from those now in use. Galileo’s original thermometer was what is known as an air thermometer, and its operation when subjected to different degrees of heat or cold depended upon the expansion and contraction of air instead of mercury or alcohol. It had one serious defect, viz., the length of a column of air is affected by pressure as well as by temperature and it was, therefore, necessary, when using this thermometer, to obtain the pressure of the atmosphere by means of the barometer before the temperature could be determined. This is obviated in the modern thermometer by the use of mercury or alcohol in a vacuum tube. Mercury is not used when it is expected to register very low temperatures, because it congeals at about 45 degrees below zero Fahr.
Thermometer Scales in Use
There are three systems in common use for marking the degrees on the scale, viz., Fahrenheit, Centigrade and Reaumur.
The Fahrenheit scale was the invention of a German by that name, but it is worthy of note that this scale is used principally by English speaking nations and is not in common use in Germany. Fahrenheit found that by mixing snow and salt he was able to obtain a very low temperature, and believing that the temperature thus obtained was the lowest possible he started his scale at that point, which he called zero. He then fixed the freezing temperature of water 32 degrees above this zero, and the boiling point of water at 212 degrees. There are, therefore, 180 divisions or degrees between the freezing and boiling point of water on the Fahrenheit scale.
The Centigrade scale starts with zero at the freezing point of water and makes the boiling point 100. Thus 180 degrees on the Fahrenheit scale equal 100 degrees on the Centigrade. The Fahrenheit degree is, therefore, only a little more than half as large, to be exact five-ninths of a degree, as a degree on the Centigrade scale. The Centigrade scale is in common use in France and is used almost exclusively in all scientific work throughout the world.
The Reaumur scale is used generally in Russia and quite commonly in some parts of Europe, especially in Germany. On this scale the zero is placed at the freezing point of water and the boiling point at 80 degrees. The divisions are, therefore, larger than those of the Centigrade scale and more than twice as large as the Fahrenheit. The general use of these different scales has led to endless confusion and made the comparison of records difficult, so that even at the present time when making a temperature record it is necessary to indicate the scale in use.
Distribution of the Temperature and Pressure
The heat received on the earth from the sun is the controlling factor in all weather conditions. If the earth were composed of all land or all water, and the amount of heat received were everywhere the same throughout the year, there would be no winds, no storms and probably no clouds and no rain, because the force of gravity, which acts on everything on the earth’s surface and on the air as well, would soon settle all differences and the atmosphere would become perfectly still. But the earth is composed of land and water and the land heats up more rapidly under sunshine than the water and also gives off—“radiates” its heat more rapidly than water. As a result, the air over the land is warmer in summer than the air over the water. During the winter this is reversed, and the air over the oceans is warmer than the air over the land. The great ocean currents, by carrying the heat from the equatorial regions toward the poles, and by bringing the cold from the polar regions toward the equator, assist in maintaining a constant difference in temperature between the continents and the adjacent oceans.
Furthermore, the fact that the path of the earth about the sun is not a circle but an ellipse, and that the axis of the earth is not perpendicular to the plane of its orbit, result in an unequal distribution of heat over the surface. It is always warmer near the equator than at the poles, and warmer in summer than in winter. All these differences in temperature cause corresponding differences in density, which, in turn, cause differences in weight or pressure over various parts of the earth’s surface. These changes are, in no way, the result of chance but are determined by the operation of fixed natural laws, and with this in mind we may now take up the study of the winds of the world.
The Winds of the World
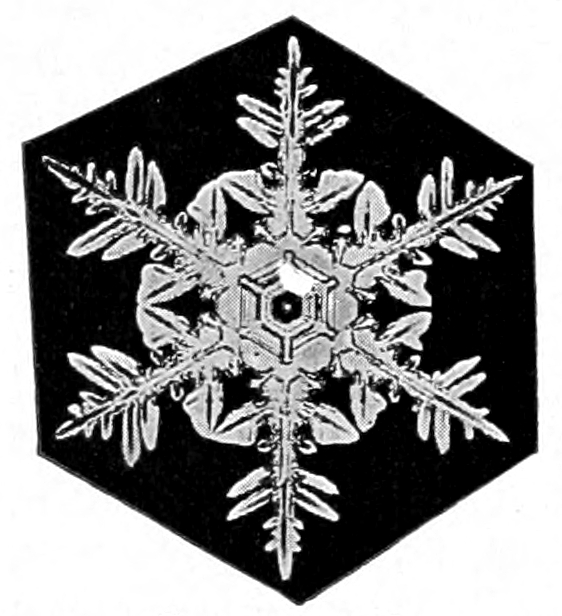
Snow crystal.
Photomicrograph by W. A. Bentley.
The general circulation of the atmosphere may be best studied by disregarding those smaller differences of temperature and pressure that result from local causes and by viewing the earth and its atmosphere as a whole, considering only those larger differences which are in constant operation. In the great oceans of the world we find the water constantly moving in a very systematic manner, and we call this system of movements ocean currents. The Gulf Stream, the Equatorial Current, the Japan Current and others may be likened to great rivers of water moving systematically on their courses in the ocean.
There are greater rivers of air in the atmosphere than any in the oceans, and they move on their courses with equally systematic precision and in obedience to fixed laws, which we may in a measure understand.
The river, at the bottom of which we live, is broad and deep, extending in width from Florida northward nearly to the north pole. It flows from west to east circling the globe and its name is The Prevailing Westerlies. The other river in this hemisphere extends southward from latitude about 35° nearly to the equator. Its name is The Northeast Trade Winds.
In the southern hemisphere are two similar rivers, one extending southward from latitude about 30° nearly to the south pole with its current, like its counterpart in the northern hemisphere, flowing from west to east, circling the globe. It is also called The Prevailing Westerlies. The other river in the southern hemisphere extends from about latitude 30° northward nearly to the equator and flows from the southeast toward the northwest, hence the name Southeast Trade Winds. The dividing line, or bank, between the rivers in each hemisphere belts the earth at about 35° north and 30° south of the equator. Why does the air move and why does it move in such a regular, systematic manner? To answer these questions we will rely upon gravity, the heat from the sun and the effect of the rotation of the earth on moving wind currents.
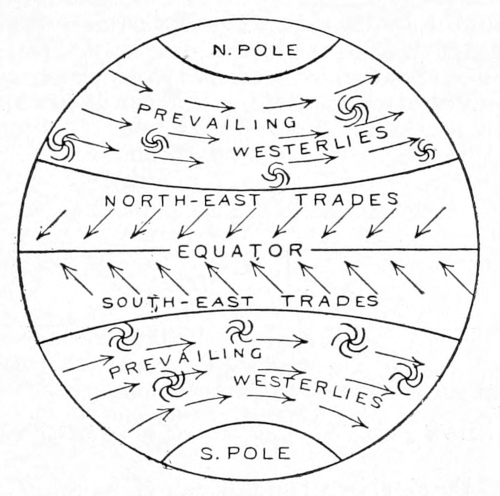
WINDS OF THE WORLD
Everyone knows that water flows down hill because of the force of gravity. Gravity is nature’s great peacemaker. It is always trying to settle disturbances, even things up, smooth them over. If there were no winds to bring rain to the land or to stir up the ocean, gravity would soon run all the water into the lakes and the seas, and then smooth them out like sheets of glass; and if there were nothing to stir up the winds, gravity would soon settle all differences in the atmosphere and the air would become perfectly quiet. So gravity is kept busy trying to smooth out the water which the wind stirs up, at the same time trying to quiet the winds which are stirred up by the heat of the sun.
Tyndall says that heat is a mode of motion, that when heat is imparted to a substance the molecules of which it is composed are set into very rapid vibration. They are continually trying to get away from each other and usually succeed in getting more space, and thus increase the size or volume of the substance, or, in other words, expand it. Iron, brass, copper, water and many other substances expand under heat. Air is a gas and expands very rapidly when heated. One cubic foot of cold air becomes two cubic feet when heated. Now gravity pulls things down toward the center of the earth in accordance with their weight-density, and a cubic foot of cold air, being more dense and thus heavier than an equal volume of warm air, is pulled down with greater force. We, therefore, say that warm air is lighter than cold air, and if lighter it will rise. What it actually does is to press equally in all directions and when a place is found where there is less resistance than elsewhere it moves in that direction. So when heat causes air to expand and become lighter than the surrounding cool air, it moves, and air in motion is wind.
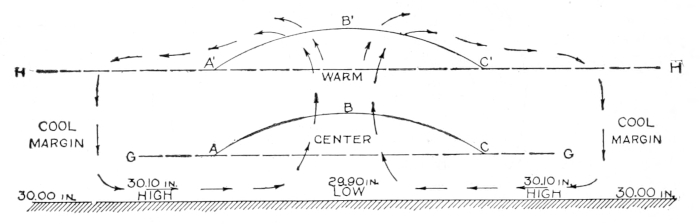
Fig. 1. Diagram showing air currents set up by sun’s heat.
This diagram represents a section of the atmosphere over a broad, level plain with the air at rest and pressing down equally on every part of the surface. The dotted line H represents the top of the quiet atmosphere. Such a condition occurs frequently at night after the heat from the sun is withdrawn and gravity has settled the atmosphere. When the rays of the sun fall upon the earth upon which this quiet air rests they warm the earth first, then the layer of air immediately in contact with the surface, so the atmosphere is heated from the bottom upward. We will assume that the layer of air between the earth and the dotted line, G, is thus heated to a higher temperature than the air above it. It will, therefore, expand. It cannot expand downward because of the earth. It cannot expand much laterally because it is pressed upon by air that is also seeking more space. It, therefore, expands upward as represented by the line A B C. Now in expanding upward it lifts all the air above it and the line H, representing the top of the atmosphere, will become bowed upward also as indicated by the line A′ B′ C′. As a result, the air at the top of the atmosphere over the warm center slides down the slopes on either side toward the cool margins. As soon as the flow of air away from the warm center begins, just that instant the pressure upon the heated layer at the surface is relieved and the warm air rushes upward (is pushed upward) and the whole circulation, as indicated by the arrows, begins. It must be remembered that gravity is the really active force in maintaining this movement, because it pulls down the denser, heavier air at the cool margins with greater force than the warm, expanded, light air at the warm center. The descent of the cool air actually lifts the warm air.
The normal pressure, or weight, of the atmosphere at sea level is about 14.7 pounds on each square inch of surface. It is customary, however, to express the weight of the atmosphere in terms of inches of mercury instead of in pounds and ounces. A column of air one inch square from sea level to the top of the atmosphere will just counterbalance a column of mercury 30.00 inches high in a barometer tube of the same size. We, therefore, say that the normal pressure of the atmosphere at sea level is about 30.00 inches. If, for any reason, the atmosphere becomes heavier than normal, it will raise the column of mercury above the 30 inch mark, and we say that the pressure is “high.” If the atmosphere becomes lighter than normal, we say that the pressure is “low.” So high pressure means a heavy atmosphere and low pressure a light atmosphere.
At the beginning we assumed that the atmosphere over the broad, level plain was quiet and that it pressed down equally on every part of the surface. We will now assume that the pressure was normal, or 30.00 inches, and note the changes in pressure that result from the interchange of air between the warm center and the cool margins. So long as none of the air raised by the expanding layer at the surface, moved away toward the cool margins, no change in pressure occurred; but the instant the air began to glide down the slopes away from the warm center, then the pressure at the surface decreased, because, some air having moved away, there was less to press down than before. The pressure at the warm center, therefore, became less than 30.00 inches, or in other words, low. Likewise, the air as it moved away from the warm center, having lost much of its heat during its ascent, was gradually pulled down by gravity because of its greater density, thus increasing the pressure over the cool margins. We, therefore, have low pressure at the warm center, 29.90 inches and high pressure, 30.10 inches, at the cool margins. From this illustration we obtain the six principles of convectional circulation, viz.:
1. Low pressure at warm center.
2. High pressure at cool margins.
3. Ascending currents at warm center.
4. Descending currents at cool margins.
5. Surface winds from high pressure to low pressure.
6. Upper currents from low pressure to high pressure.
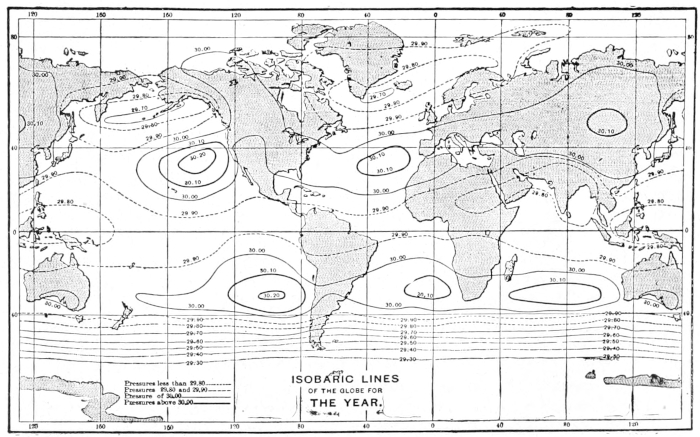
Fig. 2. Isobars of the world.
Now, we all know that the temperature of air is much higher at the equator than at the poles and we may, therefore, let Fig. 1 represent a section of the atmosphere along any meridian from the north to the south pole. The equator would then become the warm center and the poles the cool margins. We would then expect to find a belt of low pressure around the world near the equator because of the high temperature, and high pressure at the poles because of the low temperature. We would, also, expect to find ascending currents at the equator; upper currents flowing from the equator toward the poles; descending currents at the poles, and surface winds blowing from the poles toward the equator. Let us now test our theory by actual facts and see how far they are in accord.
The chart, Fig. 2, represents the normal, or average, pressure at sea level for the world, and if our theory is in accord with the facts, we should find a belt of low pressure all around the world near the equator, with areas of high pressure at the poles. Let us examine the chart. Beginning at the equator, and bearing in mind that the normal pressure is about 30.00 inches, we find irregular lines, representing pressures of 29.90 inches—slightly below normal—around the world on both sides of the equator. Between these lines we find pressure as low as 29.80. It is, therefore, evident that there is a belt of low pressure around the world near the equator, as anticipated. Let us look for the high pressure at the poles. We have comparatively few observations near the poles, but the line nearest the south pole is marked 29.30 inches, a surprisingly low pressure, much lower even than the low belt at the equator, and just the reverse of what we expected to find. When we look at the north pole we find that the pressure is not so low as at the south pole, but still below normal and about as low as at the equator. Going north and south from the equator we find that the pressure increases gradually up to about latitude 35° in the northern hemisphere and to about latitude 30° in the southern, after which it decreases toward the poles. So there are two well marked belts of high pressure circling the globe; the one about 35° north, and the other about 30°, south of the equator. May it not be significant that these belts of high pressure coincide so nearly with the margins, or banks, of the air rivers mentioned on page 867?
Thus far our theory does not accord very well with the facts. True, we found the low pressure at the equator as anticipated; but we also found low pressure at the poles, where the reverse was expected; and the high pressure that we anticipated at the poles, we found not far north and south of the equator. We will, therefore, have to discard our theory, or reconstruct it to accord with the facts. Let us reconstruct Fig. 1, and mark the pressure on the line representing the earth’s surface along any meridian to accord with the facts as they appear on Fig. 2.
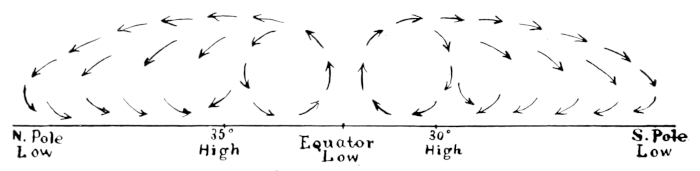
Fig. 3. Diagram showing air currents along any meridian.
The above diagram now represents the true pressure along any meridian, as determined by actual observations, and we cannot escape the conviction that the requirements as to temperature and pressure at the warm center are fulfilled by the high temperature and low pressure found at the equator. Furthermore, the temperature decreases north and south from the equator, and thus the belts of high pressure near the tropics may be taken to represent the conditions at the cool margins. The first and second principles of a convectional circulation, viz., low pressure at the warm center and a high pressure at the cool margins, are thus fulfilled. To satisfy the remaining conditions, we should find ascending currents near the equator, upper currents flowing from the equator toward the tropical belts of high pressure, descending currents at the tropics, and surface winds blowing from the tropics toward the equator. Let us now examine the surface winds of the world as illustrated by the diagram on page 867.
On either side of the equator and blowing toward it, we find the famous trade winds—the most constant and steady winds of the world. Their northern and southern margins coincide with the tropical belts of high pressure. They blow from high pressure to low pressure and we cannot doubt that they act in obedience to the fifth principle of convectional circulation. From observation of the lofty, cirrus clouds in the trade wind belts, we have abundant evidence of upper currents, flowing away from the equator toward the tropical belts of high pressure; thus the sixth principle is satisfied. The torrential rains and violent thunderstorms, characteristic of the equatorial regions, bear evidence to the rapid cooling of the ascending currents near the equator; while the clear, cool weather and light winds of the Horse Latitudes clearly indicate the presence of descending currents at the tropics. Thus, the six principles of a convectional circulation are satisfied, and the evidence is conclusive that the trade winds form a part of a convectional circulation between the tropical belts of high pressure and the equatorial belt of low pressure.
You have doubtless observed that the trade winds do not blow directly toward the equator but are turned to the west so that they blow from the northeast in the northern hemisphere, and from the southeast in the southern. This peculiarity is not in strict accord with our ideas of a simple convectional circulation and suggests, at least, the presence of some outside influence. If we turn to Ferre’s treatise on the winds, we find a demonstration of the following principle: a free moving body, such as air, in moving over the surface of a rotating globe, such as the earth, describes a path on the surface that turns to the right of the direction of motion in the northern hemisphere and to the left in the southern. The curvature of the path increases with the latitude, being zero at the equator and greatest at the poles, and is independent of direction. With this in mind, if we take position at the northern limit of the trade winds in the northern hemisphere and face the equator, (see p. 867), we find that the winds moving toward the equator turn to our right; likewise, if we face the equator from the southern limit of the southeast trades, we find them turning to our left. Observations of upper clouds in the trade wind belts show that the upper currents also turn to the right in the northern hemisphere, and to the left in the southern. It is, therefore, clear that the systematic turning of the trade winds from the meridian is due to the rotation of the earth. The value of a force at various latitudes and for various velocities that would cause a body to turn away from a straight line, is purely a problem in mathematics, and for the benefit of those versed in the science the formula is given. The amount of such a force is expressed by 2 MVW sin D, where M is the mass, V the velocity, W the angular rotation of the earth, and D the latitude.
Not all of us may be able to solve the problem, but we may understand something of the effect of the rotation of the earth on moving wind currents. It is a well-known principle of physics that if a body be given a motion in any direction, it will continue to move in a straight line by reason of its inertia, without reference to north, south, east or west. A personal experience of this principle may be gained in a street car while it is rounding a curve.
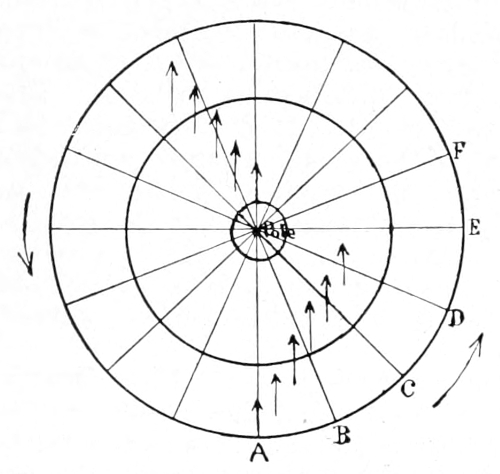
Diagram showing effect of earth’s rotation on the atmosphere.
In this diagram, we have a view of the northern hemisphere. The direction of the rotation is indicated by the curved arrows outside the circle representing the equator. Suppose that a wind starts from the equator, moving along the meridian A directly toward the north pole. It is clear that it cannot continue to move along the meridian, because the direction of the meridian with reference to space, is continually changing, and the inertia of the wind compels it to move in a straight line without reference to the points of the compass. So when the meridian A has been moved to B by the rotation of the earth, the wind, although it maintains its original direction, no longer points toward the pole but to the right of the pole. Likewise, a wind starting from the pole toward the equator also turns to the right of the meridians and becomes a northeast wind as it approaches the equator. A wind moving east or west, also turns to the right of the parallels for the same reason. So a wind starting out from the equator with the best possible intention of hitting the pole, and all the while continuing in the same straight line, will miss the pole by many miles, and always on the right side in the northern and on the left side in the southern hemisphere. Thus, the oblique movement of both the trade winds and the prevailing westerlies is accounted for.
It now remains to consider the cause of the unexpected low pressure found at the poles, and the reason for the belts of high pressure at the tropics. If we refer to Fig. 2, it is evident that not all the air that ascends at the equator descends at the tropics, else there would be an absence of air at the higher latitudes, which is manifestly not the case. On the other hand, it is equally impossible that all the air ascending at the equator should move to the poles, because the space it could occupy decreases rapidly from a maximum at the equator to zero at the poles. Only a part of the air that ascends at the equator is, therefore, involved in the trade wind circulation and a part passes over the tropics and moves on toward the low pressure at the poles. Furthermore, some of the air that descends at the tropics moves along the surface toward the poles, obeying the law that impels air to move from high pressure to low pressure. Now every particle of air that passes over the tropics, every particle that moves northward along the surface, turns to the right in the northern and to the left in the southern hemisphere. All, therefore, miss the poles—on the right side in the northern and on the left side in the southern hemisphere. The result is that two great whirlpools develop in the atmosphere; one whirling about the north and the other whirling about the south pole. The outer margins of these whirlpools coincide with the tropical belts of high pressure.
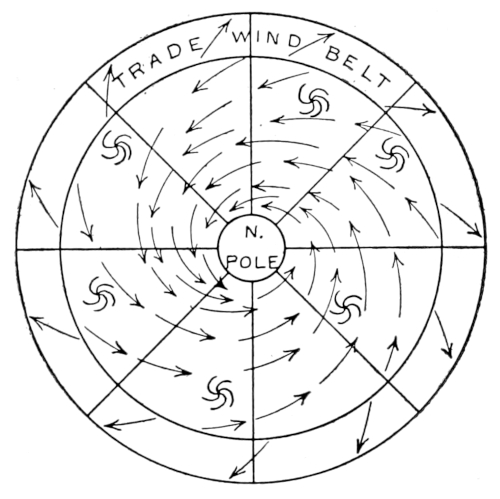
CIRCUMPOLAR WHIRL
As an example of a whirlpool we may take a basin having a vent at the center of the bottom. If the basin is filled with water, the plug withdrawn and the water given a slight rotary motion, its velocity will increase as it approaches the center and the rapid whirling will develop sufficient centrifugal force to open an empty core. Those who have visited the great whirlpool at Niagara, undoubtedly noticed that the whirling waters are held away from the center and piled up around the margins by the centrifugal force developed. Let us suppose that air starting from the equator, moves without friction or other resistances toward the pole. Its velocity must increase as its radius shortens, because the law of the conservation of areas requires that the radius must always sweep over equal areas in a given unit of time. (See law of conservation of areas.) At the equator, the air has an easterly motion equal to the eastward motion of the earth, which is 1,000 miles per hour. At latitude 60° the radius will have decreased one-half and the velocity, therefore, doubled; but at latitude 60° the eastward motion of the earth is only 500 miles per hour, so the air would be moving 1,500 miles per hour faster than the earth. At a distance of 40 miles from the pole the wind would attain an easterly velocity of 100,000 miles per hour, and moving on so short a radius would develop sufficient centrifugal force to hold all the air away from the pole and thus form a vacuum. That the supposed case of no friction is far from the truth is evidenced by the fact that the pressure at the north pole is but little less than at the equator, but the centrifugal force developed by the gyration winds, in thus withdrawing the air from the poles and piling it up at the tropics, may be fairly taken as sufficient cause for the low pressure found at the poles and the belts of high pressure at the tropics.
The questions that remain to be considered are: (1) the low pressure at the south pole as compared with the pressure at the north pole and (2) the unequal distance of the tropical belts of high pressure from the equator. These questions may be considered together.
It is to be remembered that the southern hemisphere is the water hemisphere, and that the prevailing westerlies, in gliding over the smooth water surface, are but little retarded by friction and, therefore, attain a higher velocity than the corresponding winds of the northern hemisphere, where the rougher surface materially retards their movement. As a consequence, the circumpolar whirl of the southern hemisphere is stronger, and develops a greater centrifugal force, thus holding a larger quantity of air away from the south pole and reducing the pressure to a greater degree than is brought about by the weaker winds of the northern hemisphere.
Since the circumpolar whirl of the southern hemisphere is the stronger of the two, it withdraws the air to a greater distance from the pole than does its weaker counterpart of the northern hemisphere, and piles it up in the tropical belt of high pressure about five degrees nearer the equator than does the weaker forces of the northern hemisphere.
Storms
Snow crystal.
Photomicrograph by W. A. Bentley.
Having gained a comprehensive view of the general, planetary wind system, we may now undertake the study of local disturbances that arise within the general circulation and are known as “storms.”
Storms are simply eddies in the atmosphere. They may be compared to the eddies that are often seen floating along with the current of a river or creek. In these eddies the water is seen to move rapidly around a central vertex, developing sufficient centrifugal force to hold some of the water away from the center, thus forming a well marked depression, frequently of considerable depth. The whole circulation of the eddy is quite independent of the current of the stream which carries it along its course, and while its general direction and velocity of movement coincide with that of the current, there are times when it will be seen to move quickly from side to side and again when it will remain nearly stationary for a time or take on a rapid movement.
The eddies or storms in the atmosphere act in much the same way. They are carried along by the general currents of the river of air in which they exist. Their general direction coincides with the direction of the current in which they are floating, and their rate of movement conforms in a general way to its velocity; but like the eddies in the river, they do not always move in straight lines nor at a uniform rate of speed.
There is one important respect in which the eddies in the air differ from eddies in water. The water eddy may revolve in either direction, depending upon the direction in which the initial force was applied, but the storm eddies in the atmosphere always revolve counter-clockwise in the northern hemisphere, and clockwise in the southern.
This is due to the deflecting force of the earth’s rotation, which is fully explained on page 872.
Weather Maps
Snow crystal.
Photomicrograph by W. A. Bentley.
A weather map is a sort of flashlight photograph of a section of the bottom of one or more of these great rivers of air. It brings into view the whole meteorological situation over a large territory at a given instant of time; and, while a single map conveys no indication of the movements continually taking place in the atmosphere, a series of maps, like a moving picture, shows not only the whirling eddies, the hurrying clouds and the fast-moving winds, but the ceaseless on-flow of the great river of air in which they float. Our present knowledge of the movements of the atmosphere has been gained chiefly from a study of weather maps; they form the basis of the modern system of weather forecasting, and their careful study is essential to any adequate understanding of the problems presented by the atmosphere. (See pages 884–885.)
The Principles of Weather Forecasting
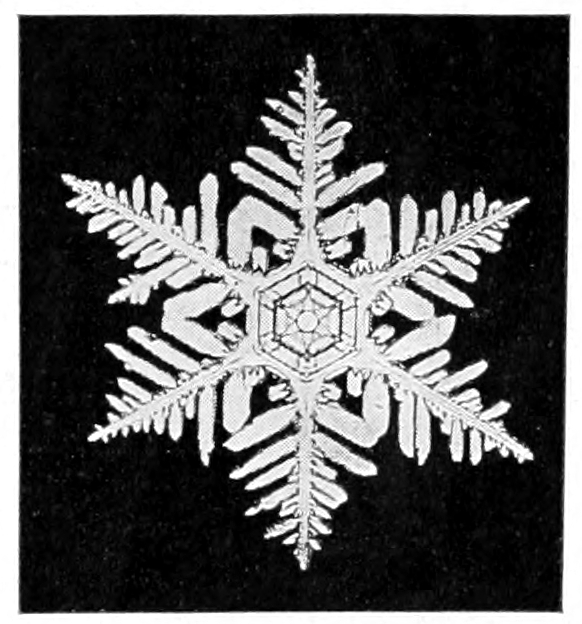
Snow crystal.
Photomicrograph by W. A. Bentley.
The forecasting of the weather has been made possible by the electric telegraph. It is based upon a perfectly simple, rational process constantly employed in everyday affairs. We go to a railway station and ask the operator about a certain train. He tells us that it will arrive in an hour. We accept his statement without question, because we are confident that he knows the speed at which the train is approaching, a few clicks of his telegraph instrument has told him just where it is and the time it will arrive, barring accidents, is a simple calculation. Information of coming weather changes are obtained in a similar manner. Although storms do not run on steel rails like a train, nevertheless their movements may be foreseen with a reasonable degree of accuracy, depending chiefly upon the size of the territory from which telegraphic reports are received and the experience and skill of the forecaster. As a rule, the larger the territory brought under observation, especially in its longitudinal extent (the general currents carry storms of the middle latitudes eastward around the world and those or the tropics westward), the earlier advancing changes may be recognized and the more accurately their movements foreseen.
Forecasts Based on Weather Maps
The forecasts issued by the United States Weather Bureau are based on weather maps, prepared from observations taken at 8 a. m. and 8 p. m. at about 200 observatories. In addition to the reports received by telegraph by the Central Office at Washington, the several forecast centers and other designated stations from observatories or stations in the United States, a system of interchange with Canada, Mexico, the West Indies and other island outposts in the Atlantic and Pacific gives to the forecaster two daily photographs of the weather conditions over a territory embracing nearly the whole of the inhabited part of the western hemisphere north of the equator. Any sort of disturbance within this vast region is photographed at once upon the weather map. If it be a West Indies hurricane or other destructive storm, its character is recognized instantly, its rate and direction determined and information of the probable time of its arrival sent to those places that lie in its path. The method is perfectly simple. Anyone with a weather map and a little experience can forecast the weather with some degree of accuracy, or, at least, gain an intelligent understanding of the conditions upon which the forecasts that accompany the map are based.
Maps, Where Published and How Obtained
Weather maps are published in many daily papers, and in somewhat larger form and more in detail, at many Weather Bureau stations. They may usually be obtained for school use by applying to the nearest Weather Bureau station or to the Chief of the Weather Bureau at Washington, D. C.
The forecasts that accompany the maps are simply an expression on the part of the official forecaster as to the weather changes he expects to occur in various parts of the country within the time specified, usually within 36 to 48 hours. His opinion is based upon the conditions shown by the map. He has no secret source of information. You may accept his conclusions, or, if in your opinion they are not justified, you have all the information necessary to make a forecast for yourself. Weather maps are published so extensively with a view to thus stimulating an intelligent interest in the problem of weather forecasting, and also that one may see at a glance what the temperature, rainfall, wind and weather is in any part of the country in which he may be interested. The friends of the weather service are those who best understand its work.
The Value of the Weather Service
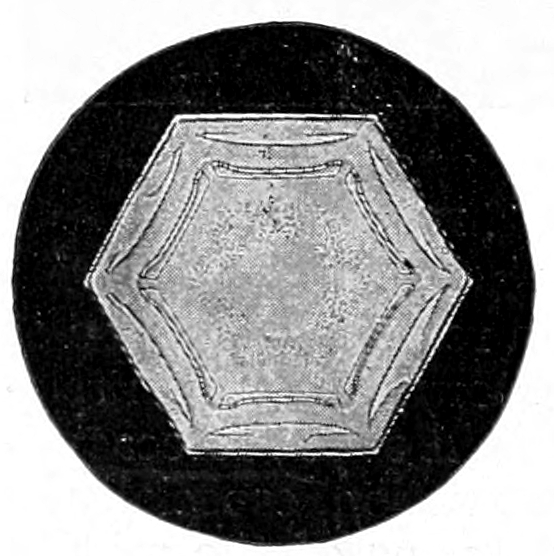
Snow crystal.
Photomicrograph by W. A. Bentley.
No one knows so well as the forecaster that the changes that appear most certain to come sometimes fail, or come too late; but taking all in all, about 85 out of 100 forecasts are correct. Of those that fail, probably not more than three or four per cent. fail because the changes come unannounced. Most forecasters predict too much, and their forecasts fail because the expected changes come after the time specified or not at all. It is fortunate that this is so; for it is better to be prepared for the change though it be late in coming than to have it come without warning.
The value of the weather service to the agriculture and commerce of the United States cannot be questioned seriously. That the appropriations for its support have been increased year by year from $1,500 in 1871 to nearly $1,500,000 in 1910 is evidence of its value and efficiency. A conservative estimate places the value of property saved by the warnings issued by the Weather Bureau at $30,000,000 annually.
LESSON CCXXII
Experiments to Show Air Pressure
Leading thought—The air presses equally in all directions.
Experiment 1—To show that air presses upward—Fill a tumbler which has an unbroken edge as full of water as possible. Take a piece of writing paper and cover the tumbler, pressing the paper down firmly upon the edge of the glass. Turn the glass bottom side up and ask why the water does not flow out. Allow a little air to enter; what happens? Why? Turn the glass filled with water and covered with paper sidewise; does the water flow out? If not, why?
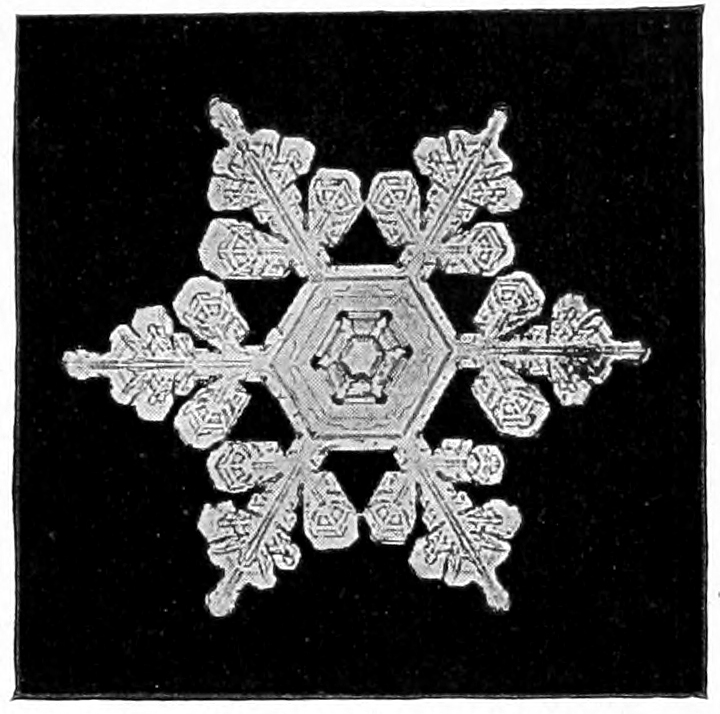
Composite crystal; high cloud at center and medium high cloud at the border.
Photomicrograph by W. A. Bentley.
Experiment 2—To show that air passes downward—Ask some of the boys of the class to make what they call a sucker. This is a piece of leather a few inches across. Through its center a string is drawn which fits very closely into the leather and is held in place by a very flat knot on the lower side. Dampen the leather and press it against any flat surface, and try to pull it off. If possible, place the sucker on a flat stone and see how heavy a stone can be lifted by the sucker. Ask why a sucker clings so to the flat surface. If a little air is allowed to get between the sucker and the stone, what happens? Why?
Hints to the teacher regarding the Experiments—The water is kept in the tumbler in Experiment 1 by the pressure of the atmosphere against the paper. If the tumbler is tipped to one side the water still remains in the glass, which shows that the air is pressing against the paper from the side with sufficient force to restrain the water, and if the tumbler is tipped bottom side up it shows the air is pressing upward with sufficient force to keep the water within the glass.
In the case of Experiment 2, we know that the leather pressing upon the floor or on the stone is not in itself adhesive, but it is made wet simply so that it shall press against the smooth surface more closely. The reason why we cannot pull it off is that the air is pressing down upon it with the force of about fifteen pounds to the square inch. If the experiment is performed at sea level, we should be able to lift by the string of the sucker a stone weighing fifteen pounds. The reason why the water falls out of the tumbler after a little air is let beneath the paper, is that then the air is pressing on both sides of the paper; and the reason why the sucker will not hold if there is any air between it and the stone, is because the air is pressing in both directions upon it.
Supplementary reading—The Wonderbook of the Atmosphere, Houston, Chapters III, IV, V.
LESSON CCXXIII
The Barometer
Leading thought—The weight of our atmosphere balances a column of mercury about thirty inches high, and is equal to about fifteen pounds to the square inch. This pressure varies from day to day, and becomes less as the height of the place increases. The barometer is an instrument for measuring the atmospheric pressure. It is used in finding the height of mountains, and, to a certain extent, it indicates changes of the weather.
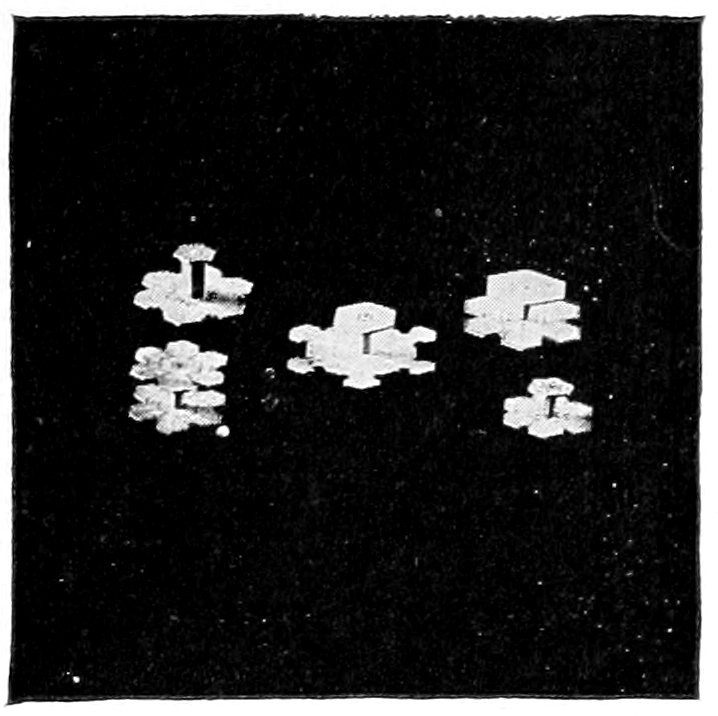
Compound snow crystals.
Photo by W. A. Bentley.
Method—A glass tube about 36 inches long, closed at one end; a little glass funnel about an inch in diameter at the top; a small cup—a bird’s bathtub is a good size since it allows plenty of room for the fingers; mercury enough to fill the tube and have the mercury an inch or more deep in the cup. Be careful not to spill the mercury in the following process, or you will be as badly off as old Sisyphus with his rolling stone.
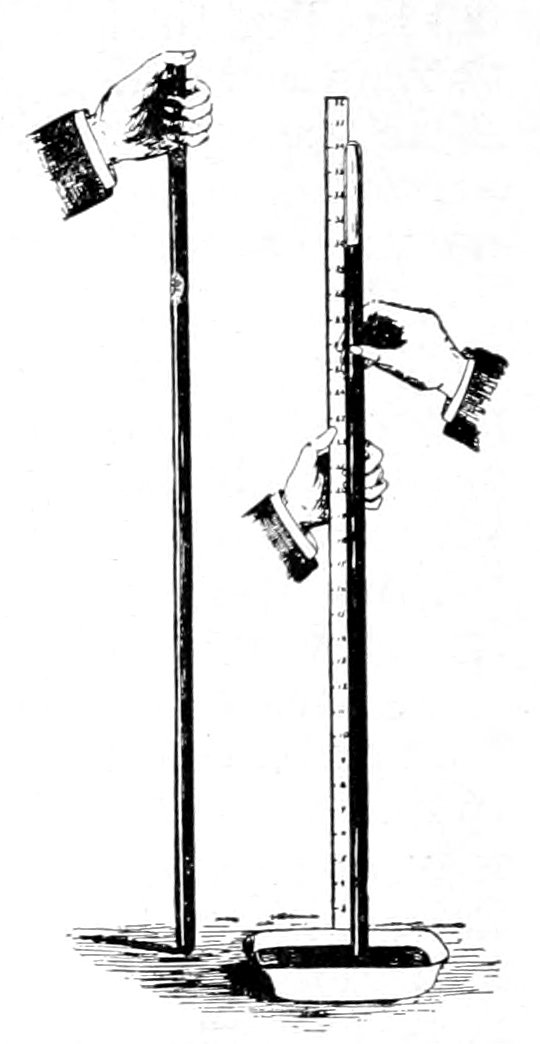
A barometer made by pupils.
Set the closed end of the tube in the cup so that any spilled mercury will not be lost; with the help of the funnel slowly and carefully fill the tube clear to the top with the mercury; empty the rest of the mercury into the cup; place the end of one of the fingers of the left hand tightly over the open end of the tube and keep it there; with the right hand invert the tube, keeping the end closed with the finger, and place the hand, finger and all, beneath the mercury in the cup then remove the finger, keeping the open end of the tube all the time below the surface of the mercury. When the mercury has ceased to fall measure the distance from the surface in the cup to the top of the mercury in the tube.
Observations—1. How high is the column of mercury in the tube?
2. What keeps the mercury in the tube? Place the cup and the tube on a table in the corner of the room, place behind the tube a yardstick, and note whether the column of mercury is the same height day after day. If it varies, why?
3. Would the mercury column be as high in the tube if it were placed on top of a mountain as it would at the foot? Why?
Supplementary reading—Chap. II in The Wonderbook of the Atmosphere, Houston.
HOW TO READ WEATHER MAPS
Teacher’s Story
Weather maps may be obtained by writing to the nearest Weather Station, or by writing to the Chief of the Weather Bureau, Dr. Willis L. Moore, Washington, D. C., stating that you wish to post the maps in a public place. A supply of maps for three successive days for use in these lessons may be obtained at 20 cents per hundred. Sometimes they are sent free, if it is stated that they are to be used for school purposes.
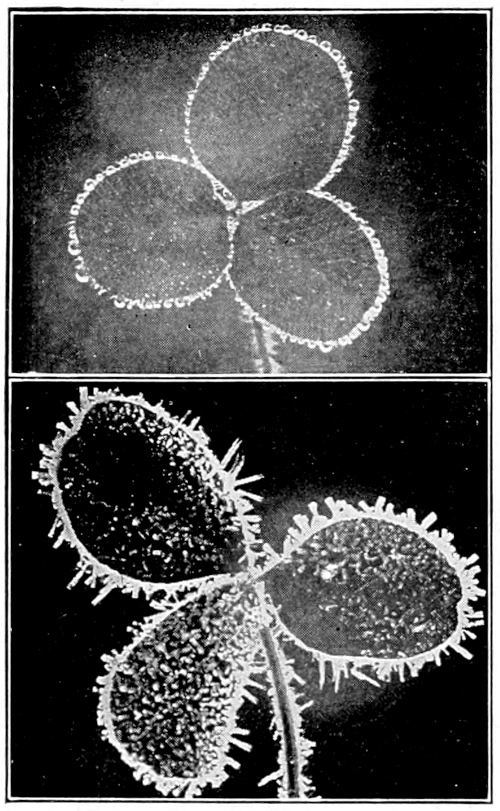
Dew on clover leaf. Hoar frost on clover leaf.
Photo by W. A. Bentley.
The words isobar and isotherm have been bogies which have frightened many a teacher from undertaking to teach about weather maps, and yet how simple are the meaning of these two words. Isobar is made up of two Greek words, isos meaning equal and baros meaning weight. Therefore, an isobar means equal weight, and on a map one of these continuous lines means that, wherever it passes, the atmosphere there has equal weight and the barometer stands at equal height. The isobar of 30 means that the mercury in the barometer stands 30 inches in height in all the regions where that line passes.
“Isotherm” comes from the two Greek words, isos meaning equal and therme meaning heat. Therefore, on the map the dotted lines show the region where the temperature is the same. If at the end of the dotted line you find 60 it means that, wherever that line passes, the thermometer stands at 60 degrees.
Many of the “highs” and “lows” enter the United States from the Pacific Ocean about the latitude of Washington State or southwest British Columbia. They follow one another alternately, crossing the continent in the general direction of west to east in a path which curves somewhat to the north, and they leave the United States in the latitude of Maine or New Brunswick. If they enter by way of lower California, they pass over to the Atlantic Ocean farther south. The time for the passage of a high or low across the continent averages about three and one-half days, sometimes a little more. These areas are usually more marked in winter, and wind storms are more marked and more regular.
A low area is called a cyclone and a high area an anti-cyclone. The destructive winds, popularly called cyclones, which occur in certain regions, should be called tornadoes instead, although in fact they are simply small and violent cyclones. But a cyclone, when used in a meteorological sense, extends over thousands of square miles and is not violent; while a tornado may be only a few rods in diameter and be very destructive. The little whirlwinds which lift the dust in the roads are rotary winds also, but merely the eddies of a gentle wind.
In a cyclone or “low,” and also in a tornado, the air blows from all sides spirally inward toward the center where there is a column of ascending air.
In an anti-cyclone or “high” the air blows outward in every direction in curved lines from a column of descending air.
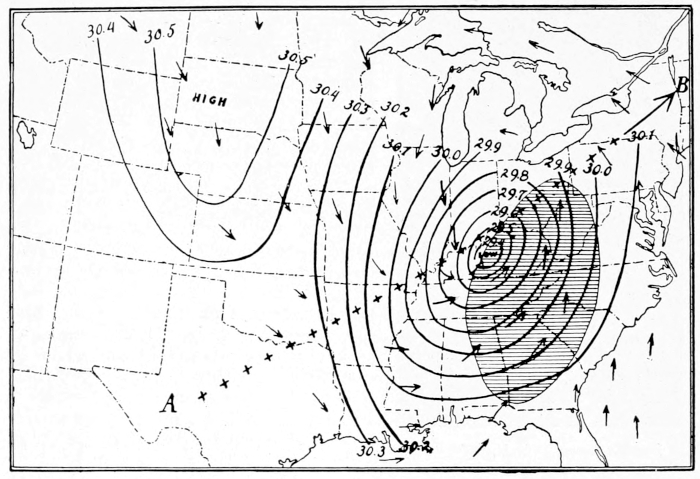
Map of a storm.
In the above map, the curved lines are isobars; the line of crosses from A to B indicates the course of the storm; the arrows indicate the direction of the wind, note that it is moving counter-clockwise around the area of low pressure; the shaded area indicates the region where it is raining or snowing; note that this is the area where the warm, moist air from the Gulf and the Ocean meets the colder air of the North.
The weather conditions during the passage of a cyclone are briefly as follows: Small, changing wisps of cirrus clouds appear about 24 hours before rain; these gradually become larger and cover the whole sky, making a nimbus cloud. The wind changes from northeast to east or southeast to south. The barometer falls; the thermometer rises, that is, air pressure is less to the square inch, and the temperature of the atmosphere is warmer. Rain begins and falls for a time, varying from an hour to a day or more. After the rain there appear breaks in the great nimbus clouds and finally the blue sky conquers until there are only a few or no clouds. The wind changes to southwest and west; the barometer rises, the temperature falls. The rain ceases, the sun shines out brightly. The low has passed and the high is approaching to last about three days.
U. S. DEPARTMENT OF AGRICULTURE, WEATHER BUREAU EXPLANATION OF WEATHER SIGNALS
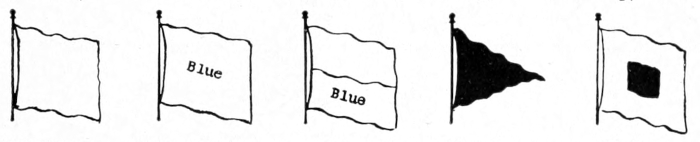
No. 1 No. 2 No. 3 No. 4 No. 5
Fair Weather Rain or Snow Local Rain or Snow Temperature Cold Wave
INTERPRETATION OF DISPLAYS
No. 1, alone, indicates fair weather, stationary temperature.
No. 2, alone, indicates rain or snow, stationary temperature.
No. 3, alone, indicates local rain or snow, stationary temperature.
No. 1, with No. 4 above it, indicates fair weather, warmer.
No. 1, with No. 4 below it, indicates fair weather, colder.
No. 2, with No. 4 above it, indicates rain or snow, warmer.
No. 2, with No. 4 below it, indicates rain or snow, colder.
No. 3, with No. 4 above it, indicates local rain or snow, warmer.
No. 3, with No. 4 below it, indicates local rain or snow colder.
WILLIS L. MOORE, Chief U. S. Weather Bureau.
EXPLANATION OF WHISTLE SIGNALS
A warning blast of fifteen to twenty seconds duration is sounded to attract attention. After this warning the longer blasts (of four to six seconds duration) refer to weather, and shorter blasts (of one to three seconds duration) refer to temperature; those for weather are sounded first.
Blasts Indicate.
One long Fair weather.
Two long Rain or snow.
Three long Local rain or snow.
One short Lower temperature.
Two short Higher temperature.
Three short Cold wave.
By repeating each combination a few times, with intervals of ten seconds, liability to error in reading the signals may be avoided.
STORM AND HURRICANE WARNINGS
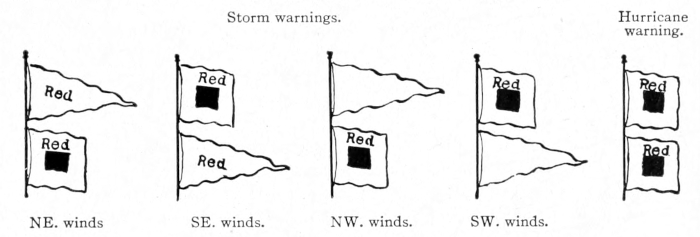
Explanation of Storm and Hurricane Signals
Storm warning—A red flag with a black center indicates that a storm of marked violence is expected.
The pennants displayed with the flags indicate the direction of the wind; red, easterly (from northeast to south); white (westerly from southwest to north). The pennant above the flag indicates that the wind is expected to blow from the northerly quadrants; below from the southerly quadrants.
By night a red light indicates easterly winds and a white light below a red light westerly winds.
Hurricane warning—Two red flags with black centers displayed one above the other indicates the expected approach of a tropical hurricane or one of those extremely severe and dangerous storms which occasionally move across the Lakes and northern Atlantic coast.
No night hurricane warnings are displayed.
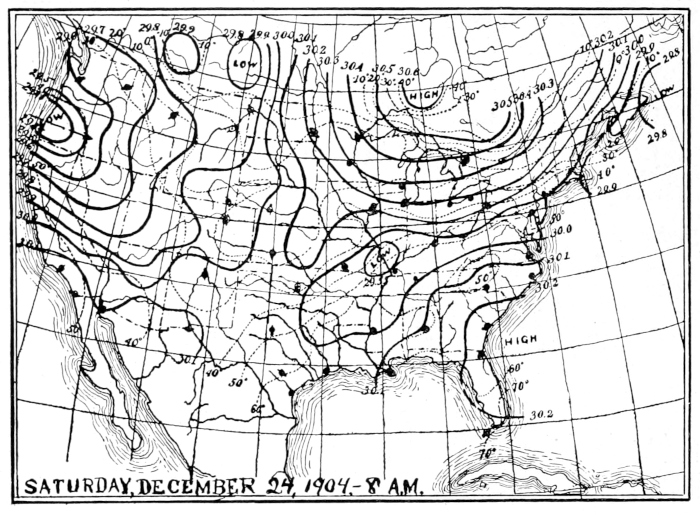
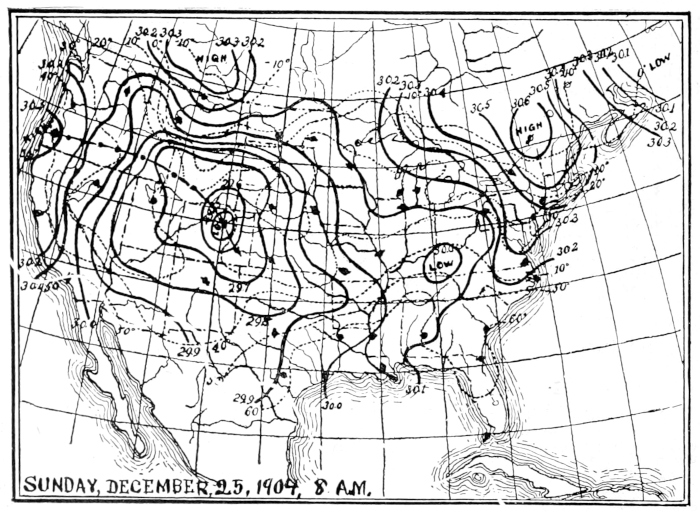
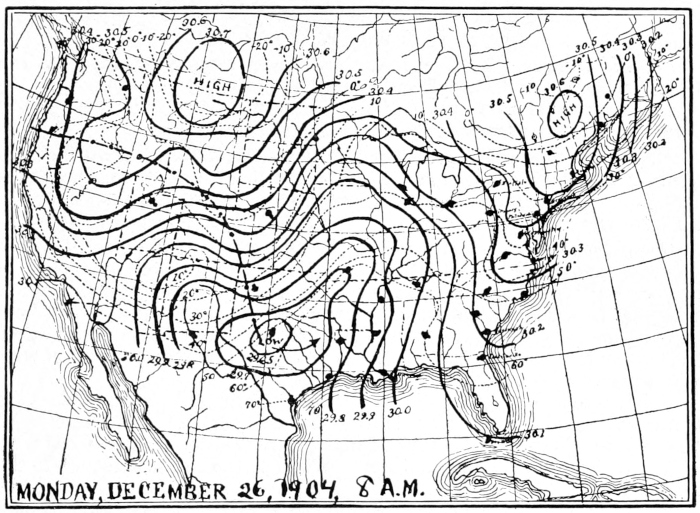
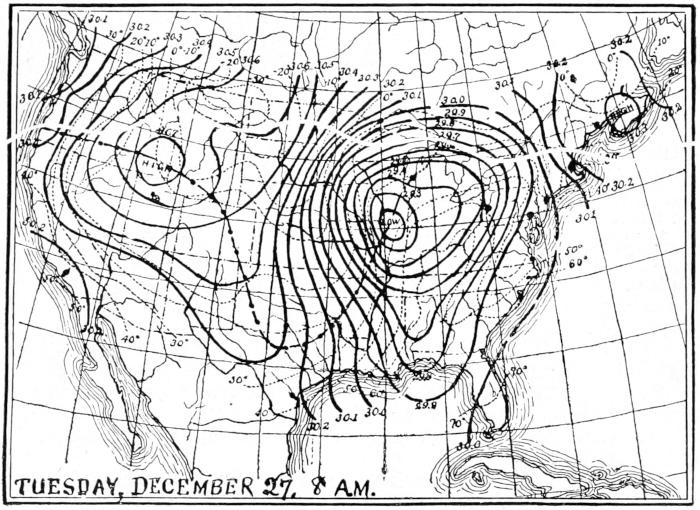
U. S. weather maps, showing the eastward progress of an area of low pressure for four consecutive days.
Note the course of the low that was on the Pacific Coast Dec. 24; this is indicated by the line of dots and dashes on the later maps.
LESSON CCXXIV
How to Read Weather Maps
Leading thought—Weather maps are made with great care by the Weather Bureau experts. Each map is the result of many telegraphic communications from all parts of the country. Every intelligent person should be able to understand the weather maps.
Method—Get several weather maps of the nearest Weather Bureau Station. They should be maps for successive days, and there should be enough so that each pupil can have three maps, showing the weather conditions for three successive days.
Observations—1. Take the map of the earliest date of the three. Where was your map used? What is its date? How many kinds of lines are there on your map? Are there explanatory notes on the lower left-hand corner of your map? Explain what the continuous lines mean. Find an isobar of 30; to what does this figure refer? Find all the towns on your map where the barometer stands at 30 inches. Is there more than one isobar on your map where the barometer stands at 30?
2. Where is the greatest air pressure on your map? How high does the barometer stand there? How are the isobars arranged with reference to this region? What word is printed in the center of this series of isobars?
3. What do the arrows indicate? What do the circles attached to the arrows indicate?
4. In general, what is the direction of the winds with reference to this high center?
5. Is the air rising or sinking at the center of this area? If the wind is blowing in all directions from a center marked high, what sort of weather must the places just east of the high be having? Do the arrows with their circles indicate this?
6. Find a center marked low. How high does the barometer stand there? Does the air pressure increase or diminish away from the center marked low, as indicated by the isobars? Do the winds blow toward this center or away from it?
7. What must the weather in the region just east of the low be? Why? Do the arrows and circles indicate this?
8. Is there a shaded area on your map? If so, what does this show?
9. Compare the map of the next date with the one you have just studied. Are the highs and lows in just the same position that they were the day before? Where are the centers high and low now? In what directions have they moved?
10. Look at the third map and compare the three maps. Where do the high and low centers seem to have originated? How long does it take a high or low to cross the United States? How far north and south does a high or low, with all its isobars, extend?
11. What do the dotted lines on your map mean? Do they follow exactly the isobars?
12. What is the greatest isotherm on your map? Through or near what towns does it pass?
13. Do the regions of high air pressure have the highest temperature or the lowest? Do high temperatures accompany low pressures? Why?
14. What is the condition of the sky just east of a low center? What is its condition just west of low?
15. If the isobars are near together in a low, it means that the wind is moving rather fast and that there will be a well marked storm. Look at the column giving wind velocity. Was the wind blowing toward the center of the low on the map? If so, does that mean it is coming fast or slow? How does this fact correspond with the indications shown by the distance between the isobars?
16. Describe the weather accompanying the approach and passage of a low in the region where your town is situated? What sort of clouds would you have, what winds, what change of the barometer and thermometer?
How to Find the General Direction and Average Rate of Motion of Highs and Lows
Observations—1. On the first map of the series of three given, put an X in red pencil or crayon at the center of the high and a blue one at the center of the low; or if you do not have the colored pencils, use some other distinguishing marks for the two. If there are two highs and two lows use a different mark for each one.
2. Mark the position of each center on this map for the following day with the same mark that you first used for that area. Do this for each of the highs and lows until it leaves the map or until your maps have been used. All the marks of one kind can be joined by a line, using a red line for the red marks and a blue line for the blue marks.
3. What do you find to be the general direction of the movement of the highs and lows?
4. Examine the scale marked statute miles at the bottom of the map. How many miles are represented by one inch on the scale?
5. With your ruler find out how many miles one area of high or low has moved in twenty-four hours; in three days. Divide the distance which the area has moved in three days by three and this will give the average velocity for one day.
6. In the same way find the average velocity of each of the areas on your map for three days and write down all your answers. From all your results find the average weekly velocity; that is, how many miles per hour and the general direction which has characterized the movement of the high and low areas.