Part 1 — II—WARTIME FOOD AND PRICE PROBLEMS Intricacies of a Perplexing and Critical Situation Which Taxed the Ingenuity of Statesmen of All the Belligerents (continued 2)
Reading edition
"A further evidence that the Food Administration could not avoid the onus of price fixing lies in the reasons for which the Administration was brought into existence and the services it was created to perform. The Food Administration is a war agency. Its chief purpose is the feeding of warring nations, our own nation and the Allies. All its other activities, its conservation, its stabilization of trade processes, its encouragement of production, are tributary to the one purpose of segregating stocks of food for the effective prosecution of the war. This latter purpose, in fact, takes the Food Administration directly or indirectly into the market.... By Section 14 of the Lever Bill, which became the Food Control Law, the President is authorized from time to time to determine and fix a reasonable guaranteed price for wheat and this section itself fixed the price for the crop of 1918 at not less than $2 per bushel at the principal interior primary markets. Pursuant to this section the President has, by two separate decrees, set the price of 1917 wheat and of the 1918 crop at $2.20 per bushel. Section 11 of the law authorizes the President to purchase and store and sell wheat and flour, meal, beans, and potatoes. Manifestly any purchase so made by the government would in effect fix the price. Aside from these delegations of power no authority is given by the Food Control Law to fix prices. And yet a study of the operations of these provisions as well as a regard for the implications of other functions of the Food Administration carry the conviction that price fixing is a necessary and inescapable corollary of the effective prosecution of the Food Administration program."
PRICE LEVEL, NOVEMBER, 1918
With the close of military operations there was noted a slight decline in commodity prices; how far the downward tendency would reach was considered a moot point. The apparent zenith point in prices was attained in July, 1918, but Bradstreet's prudently thought it unwise to indulge in any prophecies regarding low prices. The increased demand for food products among the stricken peoples of Europe would, it was believed, prevent any considerable fall in prices. There was not much to encourage consumers in the study of the index numbers of food commodities. The writer in Bradstreet's shows a wide range of price movements in the following table, in which are given the index numbers based on the prices per pound of ninety-six articles:
1912191319141915191619171918
January8.94939.49358.88579.143110.916313.727717.9636
February8.95789.45928.86199.662111.141513.942718.0776
March8.90199.40528.83209.619711.376014.136018.0732
April9.09789.29768.75629.775311.759814.576918.4656
May9.26969.13948.62249.797811.748515.120818.9133
June9.10179.07218.62209.742811.688715.468019.0091
July9.11198.95228.65669.869811.529416.068019.1849
August9.15959.01158.70879.821311.441416.398519.1162
August 159.8495
September9.21579.10069.75729.803411.780316.644119.0485
October9.45159.15269.24169.977412.069916.913519.0167
November9.47819.22528.862010.376812.799217.070118.9110
December9.54629.22909.035410.647313.662817.5966
The groups that make up the index number are as follows:
Nov. 1, 1917Sept. 1, 1918Oct. 1, 1918Nov. 1, 1918
Breadstuffs$0.2105$0.2077$0.2026$0.1999
Live stock.6785.7400.7100.6960
Provisions4.02854.32644.53594.5889
Fruits.4288.3725.3725.3725
Hides and leather2.39002.21502.21502.2050
Textiles5.11795.87425.75545.7029
Metals1.14771.42331.36621.3062
Coal and coke.0101.0119.0120.0120
Oils.90841.31851.31211.2734
Naval stores.0956.1295.1255.1348
Building materials.1448.2047.2047.2046
Chemicals and drugs1.42611.51531.52531.5278
Miscellaneous.4832.7095.6795.6870
Total$17.0701$19.0485$19.0167$18.9110
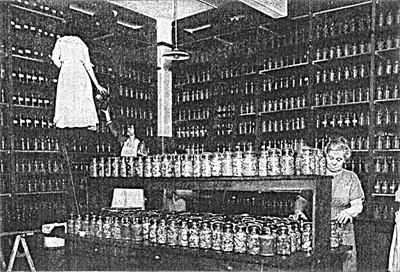
Photo by P. Thompson
A Municipal Canning Station
In city establishments like the one shown above, food that would otherwise go to waste in the markets was saved, and women were instructed in the best methods of putting up fruits and vegetables for winter use.
Click for a larger image.
FOOD CONDITIONS AND PRICE LEVEL, 1919
A clear summary of the food situation and price conditions in the half-year succeeding the armistice is to be found in the Federal Commission's Memorandum on food stocks and wholesale prices, June, 1919:
"The comparative amounts of food stocks on hand June 1, 1919, as against June 1, 1918, in the case of many important foods, show that the stocks are considerably larger.
"On June 1, 1918, the United States stocks were in demand for feeding the armies of the Allies as well as the civilian population. The fact that stocks of many important foods were much larger on June 1, 1919, while prices were as high or higher, apparently, means that they are being withheld speculatively for a world demand which is not now here but which is expected when hunger-impelled strikes secure higher wages with which higher food prices can be paid.
"The statistics of stocks are from the latest and last issue of the Bureau of Markets 'Food Surveys,' June 27, 1919. We use the quantities reported by identical firms for 1918 and 1919. (Stocks held June 1, 1919, by other firms not reporting for June 1, 1918, increase the actual stocks from 5 or 10 per cent. up to 20 or 25 per cent. over the comparable stocks). The stocks are those in warehouses and cold storage houses and in hands of wholesale dealers. Retail stocks are not reported. The prices are wholesale prices, furnished by the Bureau of Labor Statistics, for the first Tuesday in June.
COMMODITIES INCREASING IN STOCKS AND IN PRICE (Wholesale Prices)
CommodityUnit of quantity QuantityUnit of PricePrice
June, 1919June, 1918Per cent increase 1919 over 1918 June 1919June 1918
WheatBushel41,955,167 15,286,331174.5 Dollars per bu.2.51 2.20
2.462.17
Wheat flourBarrel 3,942,2053,236,671 21.8Dollars per bbl. 12 - 12.209.80
11.50 - 11.809.95
Canned salmonPound99,203,544 82,616,58220.1 Dollars per doz. No. 2 cans2.70 - 2.75 2.70
Canned cornPound 81,233,02342,352,994 91.8Dollars per doz. No. 2 cans 1.70
1.75-(Mch)1.75
Fresh eggsCase 5,975,8175,441,560 9.8Cents per doz. 40 - 40½29
30¾
Butter (creamery)Pound29,190,222 12,749,055129.0 Cents per lb.53 41
Salt BeefPound 25,701,13824,962,881 3.0Dollars per bbl. 35.0032.00
36.0034.00
Frozen fowlsPound10,962,670 2,749,077298.8 Cents per lb.37½ 34½
COMMODITIES INCREASING IN STOCKS AND DECREASING IN PRICE. (Wholesale Prices.)
CommodityUnit of quantity QuantityUnit of PricePrice
June, 1919June, 1918Percent increaseJune 1919 June 1918
BarleyBushel16,399,396 7,916,073107.2 Dollars per bu.1.19 - 1.27 1.21 - 1.26
RyeBushel11,613,127 3,355,349246.1 Dollars per bu.1.53½ 1.73
Buckwheat FlourPound18,053,230 5,523,850226.8 Dollars per cwt5.00(Apr) 5.75 6.25(Apr)
Canned TomatoesPound179,101,286 88,531,024102.3 Dollars per doz. No. 3 cans2.05 (Dec'18) 2.30
COMMODITIES DECREASING IN STOCKS AND IN PRICE. (Wholesale Prices)
CommodityUnit of quantity QuantityUnit of PricePrice
June, 1919June, 1918Percent increase June 1919June 1918
OatsBushel37,827,343 41,763,5559.4 Cents per bu.69 73½
Corn MealPound34,231,066 117,674,91870.9 Dollars per cwt3.90 4.25
BeansBushel4,252,451 4,408,6863.5 Dollars per cwt7.75 - 8.00 12.25 - 12.50
Rice (Blue Rose) (Honduras)Pound 75,134,92080,727,516 6.9Cents per lb. 6 - 77/88.5 - 8.9
COMMODITIES DECREASING IN STOCKS AND INCREASING IN PRICE. (Wholesale Prices)
CommodityUnit of quantity QuantityUnit of PricePrice
June, 1919June, 1918Percent increase June 1919June 1918
CornBushel13,260,910 27,883,36152.4 Dollars per bu.1.76 - 1.77 1.50 - 1.55
SugarPound207,622,237 217,632,3654.6 Cents per lb.8.82 7.30
Cheese (American)Pound10,174,502 15,875,23635.9 Cents per lb.31 21½
Dry Salt PorkPound395,940,437 488,344,83818.9 Dollars per bbl.58.00 - 58.50 48-50
LardPound81,275,392 106,649,58823.8 Cents per lb.33.80 - 34.30 24.15 - 24.25
The following data, taken from the Monthly Labor Review of July 1919, give a survey of the retail prices of food in the United States:
AVERAGE RETAIL PRICES AND PER CENT OF INCREASE OR DECREASE IN THE UNITED STATES MAY 15 OF EACH SPECIFIED YEAR COMPARED WITH MAY 15, 1913
ArticleUnit Average retail prices, May 15— Per cent of increase (+) or decrease (-) May 15 of each specified year compared with May 15, 1913.
19131914191519161917 191819191914191519161917 19181919
Cts.Cts. Cts.Cts. Cts.Cts. Cts.
Sirloin steakPound25.7 25.925.727.8 32.240.044.4 +1 [16]+8 +25+56+73
Round steakdo22.3 23.323.025.0 29.638.041.6 +4+3+12 +33+70+87
Rib roastdo19.9 20.119.921.6 25.731.835.2 +1 [16]+9 +29+60+77
Chuck roastdo16.1 17.016.317.5 21.827.829.7 +6+1+9 +35+73+84
Plate beefdo12.1 12.512.313.1 16.621.922.5 +3+2+8 +37+81+86
Pork chopsdo20.9 22.220.922.9 30.636.743.0 +6 [16]+10 +46+76+106
Bacondo27.0 26.726.428.4 41.650.556.7 -1-2+5 +54+ 87+110
Hamdo26.8 26.825.631.8 38.845.654.6 [16] -5+19+45 + 70+104
Lambdo19.4 19.821.723.2 29.736.839.6 +2+12+20 +53+ 90+104
Hensdo22.2 22.721.524.1 29.337.943.5 +2-3+9 +32+71+96
Salmon, canneddo 19.820.025.7 29.631.9
Milk, freshquart8.8 8.98.78.8 10.513.214.9 +1-1 [16] +1950+69
Milk, evaporated (unsweetened) [12] 15.1
ButterPound35.9 32.734.737.0 46.551.067.9 93+3 +30+42+89
Oleomargarinedo 40.4
Nut margarinedo 35.3
Cheesedo23.5 24.833.833.4 42.2
Larddo15.8 15.615.120.1 27.832.938.8 -14+27 +76+108+146
Criscodo 33.9
Eggs, strictly freshDozen26.3 26.626.328.1 39.842.453.1 +1 [16] +7+51+61 +102
BreadPound [13]5.6 6.27.27.0 9.69.89.8 +11+29+25 +71+75+75
FlourPound3.3 3.34.53.9 8.76.67.5 [16] +36+18+164 +100+127
Corn mealdo3.0 3.13.33.3 5.47.06.2 +3+10+10 + 80+133+107
Rolled oatsPound 8.4
Corn flakes [14]- 14.1
Cream of wheat [15] 25.1
RicePound9.1 9.110.512.3 13.4
Macaronido 19.0
Beans, navydo 7.69.419.1 17.812.0
Potatoesdo1.6 1.91.62.5 6.12.23.3 +19 [16] +56+281+38 +106
Onionsdo4.3 5.18.65.6 10.7
Cabbagedo 9.6
Beans, bakedNo. 2 can. 17.5
Corn, canneddo 19.1
Peas, canneddo 19.0
Tomatoes, canneddo 15.8
Sugar, granulatedPound5.4 5.06.88.5 10.09.110.6 -7+26+57 +85+69+96
Teado54.6 54.655.763.8 69.8
Coffeedo27.9 29.930.230.1 40.5
Prunesdo13.7 13.315.316.5 23.2
Raisinsdo12.5 12.614.415.1 16.3
BananasDozen 38.8
Orangesdo 54.1
All articles combined +1+3 +13+56+64 +91
"The total of dry storage stocks, including those that increased and those that decreased is as follows, all items being reduced to pounds:
June 1, 19197,875,280,040
June 1, 19186,336,763,505
"That is the total dry storage stocks reported on June 1, 1919, were 124 per cent. of those on June 1, 1918.
"The total of cold storage items reported in pounds in June, 1919, and June, 1918 (omitting apples in barrels but covering eggs; frozen eggs; butter; cheese, frozen and cured beef; frozen lamb and mutton; frozen, dry salt and pickled pork; lard; and frozen poultry), was as follows:
June 1, 19191,671,777,990
June 1, 19181,669,826,166
"That is, cold storage stocks this June are 100.1 per cent. of those last June.
"None of the above figures include army stores nor the army excess supply which is to be distributed by the War Department under resolution of the House of Representatives.
"The sum of dry storage and cold storage (except apples) for the two periods (combining the figures already given) was as follows:
June 1, 19199,547,058,030 pounds
June 1, 19188,006,589,671 pounds
"That is the total stocks reported on June 1, 1919, were 119 per cent. of those on June 1, 1918.
"This as noted does not include Army supplies.
"Grouping the commodities in four classes:
"(1) Those increasing in stocks and increasing in price.
"(2) Those increasing in stocks and decreasing in price.
"(3) Those decreasing in stocks and increasing in price.
"(4) Those decreasing in stocks and decreasing in price; we have the accompanying significant tables, which indicate that the 'law of supply and demand' is not working.