Part 1 — CHAPTER II. THE STATISTICIANS.
Henry P. (Henry Pomeroy) Horton translation
I.
A. M. Guerry.
In his “Essai sur la statistique morale de la France”, the author has made a study of the influence of age, sex, season, education, etc., upon criminality. But there is scarcely to be found an exposition of the influence of economic conditions upon the subject which we are considering. The following passages, however, are not devoid of interest.
“Wealth, (as determined by the amount of taxes on personal and real property) more often than density of population, coincides with crimes against property, of which it thus appears to be an indirect cause. We shall observe, however, that while the maximum of wealth falls in the departments of the North, where the greatest number of crimes against property are found; and the minimum in the center where these crimes are most rare; yet in the South the average is almost as high as in the North. Now if in the North is wealth which indirectly produces the crimes against property, why is it that the same is not true of the South? It would be unsafe to conclude from the fact that the poorest departments are those where the fewest crimes against property are committed, that poverty is not the principal cause of these crimes. In order to justify this conclusion, which in other regards we are far from rejecting, more direct proofs would be necessary. As a matter of fact, it is possible that the departments where there is the least wealth are not those where there are the greatest number of the very poor; and that the departments where the largest fortunes are to be found are just those where the poverty of a part of the population is greatest.
Further along Guerry shows that the departments where commerce and manufacturing are most highly developed furnish also the greatest number of crimes against property. But the author has not investigated the connection between these two symptoms. Although not rejecting, then, entirely the hypothesis that poverty is not the principal cause of crimes against property, Guerry recognizes nevertheless that a causal connection between poverty and crime is possible, that is to say he perceives that the department where the greatest poverty prevails is not necessarily that which is the poorest, nor that the richest is the one that has the fewest of the very poor.
II.
Ad. Quetelet.
An exposition of the whole system of this author would lead us too far. But the following quotations from his “Physique sociale” will suffice to show the breadth of his views and the vastness of his conception of society.
“Thus, to make our manner of procedure plain by an example, anyone who examines too closely a small portion of a very great circumference traced upon a plane, will see in this portion only a certain number of physical points, assembled in a more or less accidental way.… From a greater distance his eye will take in a greater number of points, which will already appear regularly distributed in an arc of a certain extent; soon, if the observer continues to recede, he loses sight of the individual points … grasps the law that has presided over their general arrangement, and recognizes the nature of the curve traced.…
“In all that relates to crimes, the same figures are reproduced with such constancy that it is impossible to misconstrue them, even in the case of those crimes which, it would seem, should be most likely to escape human prevision, such as homicides, since these are in general committed as a consequence of quarrels arising without motive, and under apparently fortuitous circumstances. Experience, however, proves that not only is the annual number of homicides nearly constant, but that even the weapons employed are used in the same proportions. What can be said then of crimes that are the result of reflection?
“This constancy with which the same crimes reappear annually in the same order, and lead to the same penalties in the same proportions, is one of the most curious of the facts that we learn from court statistics.… A budget which we pay with frightful regularity is that of the jails, the penitentiaries, and the gallows.… We can enumerate in advance how many individuals will stain their hands with the blood of their fellows, how many will be forgers, how many poisoners; almost as we can predict the births and deaths.…
“Society contains within itself the germs of all the crimes that are about to be committed. It is society, in a way, which prepares them, and the criminal is only the instrument that executes them.
In the second volume of the “Physique sociale”, Quetelet studies the influence of climate, age, and sex upon the tendency to crime. Although he merely touches upon our subject and treats it only indirectly, the following passages are worth the trouble of quoting:
In speaking of the three races that make up the population of France, Quetelet says:
III.
Edw. Ducpetiaux.
One of the parts of his “Paupérisme dans les Flandres” treats of the criminality in the two provinces of that name. We quote the following from it:
“Criminality is the inseparable companion of poverty. As the number of indigent persons increases, we see the number of crimes also increase. Hunger is a bad counselor. In the midst of crushing destitution, a man gradually loses the notion of justice and injustice, of good and bad; beset by needs that he cannot satisfy, he disregards the laws, and ends by recoiling from no attempt that appears capable of bettering his condition. Visiting a prison is enough to convince one of the influence of this cause upon the number and the nature of the offenses, and before even questioning the statistics that attest the progress of criminality in Flanders, we could be assured that this progress had coincided with that of pauperism. It is not then a demonstration (which we judge quite unnecessary) that we are about to offer here, it is only a series of facts that may serve to make the reader appreciate the greatness of the evil and the urgent necessity of attacking its source.
“The first of these facts is the high figure for convicts belonging to East and West Flanders, when compared with the total number of convicts in the central prisons.… In the ten years between 1838 and 1847, 23,075 convicts were received in the central prisons of the kingdom; 10,308 belonged to the two Flanders and 12,767 to the other provinces; the proportion, to 1000 convicts, was 447 for the first two provinces, and 553 for the seven others. Now this proportion is considerably in excess of that of the respective populations of the two divisions, since, to the thousand inhabitants, there are only 331 in Flanders and 669 in the rest of the kingdom. In other words, during the decennial period in question, one prisoner was received to 139 inhabitants in Flanders, and to 227 in the seven other provinces.
“The second fact is the increase in the number of persons arraigned and convicted in the Flemish provinces during the last few of these years, and particularly since the food shortage of 1845. In a space of seven years, the number of those arraigned in the two Flanders increased about in the ratio of 7 to 17; that of those condemned to imprisonment grew, during the same period from 35 to 123, or nearly quadrupled.
“These data are confirmed by an abstract of the numbers received into the jails and prisons of the two provinces, as well as by the average population of these establishments, during the period from 1839 to 1848:
Years. Persons Received into the Jails and Prisons of Totals. Average Population of the Prisons.
West Flanders.
Bruges. Courtrai. Ypres. Furnes.
1839 1,578 592 572 169 2,911 233
1840 1,502 643 821 196 3,162 238
1841 1,377 795 599 175 2,946 311
1842 1,489 863 836 271 3,459 346
1843 1,478 922 790 298 3,488 374
1844 1,502 941 696 270 3,409 379
1845 1,876 935 600 254 3,665 376
1846 2,378 1,108 935 601 5,022 574
1847 3,751 2,012 1,238 909 7,910 820
1848 2,859 1,960 1,070 690 6,579 694
East Flanders.
Ghent. Audenarde. Termonde.
1839 2,094 842 754 3,690 289
1840 2,311 919 852 4,082 357
1841 2,163 771 852 3,786 351
1842 2,171 844 905 3,920 333
1843 3,610 991 870 5,471 408
1844 2,548 760 718 4,026 345
1845 2,579 1,061 1,461 5,101 360
1846 5,499 2,732 2,092 0,323 619
1847 7,491 6,943 3,240 7,674 972
1848 6,309 4,462 2,829 3,600 698
“The increase in the numbers received into the jails and prisons of the two provinces took place especially in the years 1845, 1846, and 1847; in 1848 we note quite a pronounced decrease, which continues in 1849. Of all the signs to prove the existence and progress of pauperism, this is perhaps the most certain. During the disastrous years that had just elapsed, the prisons became in a sense annexes of the hospitals and almshouses; a great number of offenses were committed with the sole object of finding asylum.…
“As to the children, we shall understand the imminence of the danger when we realize that in the short space of three years, from 1845 to 1847, 26,247 children and young persons of both sexes under 18, were incarcerated in prison or were inmates of workhouses. Most of these children belonged to the two provinces of Flanders, and a great number were arrested outside the limits of their province. Here is the increase in the number of those received into the prisons of Ghent and Bruges, and the jails of Audenarde, Termonde, Courtrai, Ypres, and Furnes:
Cities. Young Prisoners (under 18) Received in Total during the 3 Yrs.
1845. 1846. 1847. Boys. Girls. General Total.
Prisons of E. Flanders.
Ghent 350 1,345 1,898 2,671 922 3,593
Audenarde 207 315 674 929 267 1,196
Termonde 123 235 406 616 148 764
Prisons of W. Flanders.
Bruges 459 299 550 1,110 198 1,308
Courtrai 116 170 331 560 57 617
Ypres 70 184 250 414 90 504
Furnes 43 139 57 151 88 239
Totals 1,368 2,687 4,166 6,451 1,770 8,221
“This deplorable fact of the increase of criminality among the young is explained by the statistics of indigence. We see in fact that, among the indigent persons aided in East Flanders, in 1847, there were:
In the Cities. In the Country. Total.
Indigent persons under 6 yrs. 6,693 34,637 41,530
Indigent,, persons,, under,, 12 yrs.,, 8,327 37,437 45,764
Indigent,, persons,, under,, 18 yrs.,, 5,597 20,060 25,653
General total 112,947
“Supposing that West Flanders, which has more dependents in proportion than East Flanders, has the same proportion of children, we arrive at a total for the two provinces, of 225,894 indigent persons whose age is not above 18. In this number there are 174,588 who have not passed their twelfth year! And there are thousands of orphans!
“Notwithstanding the improvement that begins to make itself felt, thanks to the resumption of work and the low price of provisions, many of these young unfortunates continue to give themselves up to begging and vagrancy. But lately driven from their homes by cold and hunger, they form a wandering population, incessantly buffeted from almshouse to almshouse, from prison to prison.
In speaking of England, after having sketched how industrialism, as it spread more and more, drew after it an increase of pauperism, the author says of the connection between criminality and economic conditions:
“Parallel with the ascending figure for pauperism, rises the growing figure for criminality. The number of persons arraigned at the assizes of England and Wales has increased as follows:
Years. Totals. Annual Average.
1814 to 1820 78,762 11,252
1821 to 1827 99,842 14,263
1828 to 1834 134,062 19,152
1834 to 1840 162,502 23,214
1841 to 1847 193,445 27,760
“Thus in a space of thirty-four years the number of crimes has more than doubled in England, while, in the same interval, the increase of the population has hardly passed 40%.
“The parallelism between the growing pauperism and growing criminality is even more striking when the comparison is applied to the delinquents under the summary jurisdiction of the justices of the peace. Up to the time of the establishment of the workhouses in 1834 the number of poor persons assisted increased progressively from year to year. Well, the number of persons arrested by the metropolitan police followed the same progression. This number was 72,824 in 1831, and 77,543 in 1832. In 1833 the new poor law with its terrible workhouses was approaching; consequently the number of arrests was no more than 69,959. In 1834 the law was promulgated, and up to 1838 was executed with great rigor; as a result the number of arrests fell to 64,269 in 1834, to 63,674 in 1835, and to 63,584 in 1836. In 1837 the severity began to relax; consequently the number of arrests increased to 64,416. In 1839 the laxity continued, and the number of arrests increased to 70,717. Laxity reached its height in 1842, and the number of arrests rose to 76,545; this was an arrest to each 25 of the population.
V.
G. Mayr.
Bavaria.
Cis-Rhenal Territory. A comparison of the curves for crimes against property and those for crimes against persons shows us that the first descends as the other ascends, and vice versa. In seeking for the causes we find that in general the motives for the latter class of crime are, among others, coarseness, passion, and dissoluteness, while that of the first kind of crime is the desire to secure objects for direct use. The more difficult it is to gain a livelihood in a lawful manner, the more this tendency will develop.
According to the author, the fluctuation in the price of grain is one of the most important factors bearing upon criminality. And indeed, in examining his nine statistical charts the connection between the high or the low cost of grain, and the great or the small number of offenses against property comes out clearly. The curve for offenses against persons, on the other hand, falls when the price of grain rises, and vice versa. The improvement of living conditions, both subjectively (through having the means to purchase the necessaries) and objectively (through a fall in prices) must consequently exercise a considerable influence upon criminality. This is seen very well in the last years of the period 1835–61, when the price of grain was low, and wages very generally increased. Hence, from 1857 on, there was an increase in the crimes against persons, and a decrease in the crimes against property.
It ought to be remarked here that however just in itself Dr. Mayr’s observation may be, we must beware of drawing the erroneous conclusion that those who feel most strongly the influence of the fall of prices and the rise in wages must necessarily, according to a law of nature, commit crimes against persons. This is true only for gross and uncultivated individuals who do not know how to occupy their leisure. But the degree of civilization of an individual depends above all upon the economic conditions under which he was placed by his birth. There are, then, economic causes for both kinds of crime.
Upper Bavaria. This district shows a higher figure for crime than any other province in Bavaria. It is especially the great increase since 1857–1858 that is most striking, and which is explained at least partially by the application of another system of examining offenses. The increase in the number of crimes against the person is the consequence of prosperous years, while the high figure for crimes against property is explained by the great influx of individuals from neighboring districts, who, from an economic standpoint, were not independent. In the period from 1837 to 1864 the population increased 49,128 by birth, and 66,299 by immigration.
Lower Bavaria. The connection between crimes against property and the price of grain is weaker in this province than in any of the others, because of its great production of cereals, which, for the most part, are destined for home consumption.
The upper Palatinate, Upper, Central, and Lower Franconia, and Swabia, all give convincing proofs of Dr. Mayr’s thesis, though in Franconia the truth is less apparent through the fact that bad years brought increased emigration, which cut down the normal increase in the number of crimes.
Where he treats of the different forms of crime, we read the following remarks, which are of interest in connection with our subject: “As we have just seen, crimes against persons increase when the price of grain goes up. We must except from this rule, however, two kinds of crime: infanticide and abortion.” The first of these crimes reached its maximum in the critical years 1854–55, and the second in 1853–1854.
As a proof of the coincidence of the fluctuations of crimes against property with those of the price of grain in the period preceding that which he studied especially, Dr. Mayr gives the following table:
Years. Number of Crimes against Property to 100,000 of Population. Price of Rye in Munich.
District of the Isar. District of the Lower Danube.
1818/19 — 138 8 fl. 15 kr.
19/20 — 148 6 31
20/21 233 157 7 28
21/22 297 200 7 58
22/23 267 195 7 57
23/24 276 — 6 2
24/25 295 166 6 59
25/26 317 157 6 18
26/27 315 144 6 55
27/28 463 241 11 11
28/29 416 234 11 6
29/30 401 216 10 48
30/31 427 264 11 12
31/32 530 302 12 35
32/33 493 313 8 21
33/34 — 318 8 42
34/35 487 318 7 47
In chapter IV (“Zahl und Bewegung der Polizeiübertretungen im Gebiete diesseits des Rheins”) Dr. Mayr gives some interesting information with regard to thefts of wood. The following table gives the figures for these crimes in this district compared with the others:
Above the Average (Cis-Rhenal Territory). Below the Average (Cis-Rhenal Territory).
The Upper Palatinate 18 % Central Franconia 1 %
Upper Franconia 80 %,, Swabia 63 %,,
Lower Franconia 178 %,, Upper Bavaria 99.2 %,,
Lower Bavaria 99.5 %,,
The great difference between these figures is explained by the fact that in Lower Franconia only a quarter of the woods are privately owned (the rest belonging to corporations, etc.). In Upper Bavaria the private forests are 92%, and in Lower Bavaria 96½% of the whole. Besides, the price of wood is very high in Lower Franconia. Once more, then, economic conditions are the cause of crime.
Upon the movement of the figures for mendicity Dr. Mayr remarks that they are strongly influenced by the cost of the primary necessities. “The parallel movement of the food-price and mendicity offers little to astonish us if we learn from the statistics of crimes that the objective difficulty or ease of getting food resulting from the fluctuations in price, exercises a direct influence upon increase and decrease of serious crimes against property. It is explicable that only a small portion of individuals who become economically dependent proceed to serious crime, while the majority fall into the minor misdemeanors involved in a living obtained through begging and vagrancy. The same force that appears in the increase and decrease of attacks upon property, must consequently appear much more intensively in the fluctuations of mendicity and vagrancy.”
England.
In speaking of the influence of economic conditions upon mendicity Dr. Mayr gives the following table:
England and Wales.
Years. Price of Wheat (Quarter). Number of Vagrants.
sh. d.
1858 44 2 22,559
1859 43 10 23,353
1860 53 3 22,666
1861 55 4 24,001
1862 55 5 ½ 29,504
1863 44 9 33,182
1864 40 2 31,932
However, in this case the increase of mendicity does not rest upon the high prices alone, but also upon the crisis which, owing to the depression of the cotton industry from 1860 on, lowered the plane of living of hundreds of thousands of workers, or drove them into the street.
England and Wales.
Number and Kind of Cases Tried by Jury.
Years. Offenses against Persons. Offenses against Property with Violence. Offenses against Property without Violence. Forgery and Counterfeiting. Violent Attacks against Property. Other Total.
1858 14 29 233 13 2 .5 4 .5 296
1859 13 22 209 11 3 5 263
1860 11 20 207 8 .5 2 .5 4 253
1861 12 25 200 8 .5 2 .5 4 252
1862 12 .5 28 203 9 .5 3 6 262
1863 14 .5 26 194 9 3 .5 7 254
1864 15 24 190 6 .5 3 .5 7 246
Average 13 25 205 9 3 5 260
Here the influence of the fall of prices is distinctly seen; offenses against property have decreased, those against persons, on the contrary, have increased.
England and Wales.
Total Offenses Tried by Jury, and Offenses not Specified.
Years. Assaults upon Persons to 100,000 of the Population. Attacks upon Property without Violence to 100,000 of the Population.
1858 439 439
1859 438 399
1860 399 392
1861 383 415
1862 403 433
1863 436 392
1864 469 365
Average 426 405
The great fall in the price of grain in 1863–1864 is once more accompanied by a diminution of the offenses against property, and an increase in those against persons.
We might conclude from this table that the remark concerning crimes against property and those against persons is not applicable, since in 1858 the number of crimes against property was very high, notwithstanding the reduced price of grain. Here is Dr. Mayr’s explanation of it:
Number of Persons against whom Action was Brought for Abandonment.
Years. To 100,000 of the Population.
1858 20
1859 18
1860 17
1861 21
1862 21
1863 19
1864 18
Average 19
The fall in the price of grain in 1863–1864 was accompanied by a diminution in the number of crimes of this kind.
Violations of the Vagrant Act to 100,000 of the Population.
Years. Prostitutes. Mendicants. Without Means of Existence. Furnished Burglar’s with Tools. Presence in a Closed Building with Criminal Intent. Presence in Public Places with Criminal Intent. Incorrigible Vagabonds. Other Offenses against the Vagrant Act. Total.
1858 51.4 50.2 18.9 0.3 14.2 18.0 2.0 13.0 168
1859 37.1 39.2 15.9 0.3 12.2 12.7 1.6 12.0 131
1860 33.6 37.9 15.2 0.2 11.5 10.1 1.2 9.4 119
1861 35.4 41.3 17.7 0.4 12.5 11.7 1.2 10.7 131
1862 41.4 55.4 20.1 0.4 14.0 14.5 2.1 12.8 161
1863 39.2 52.9 18.6 0.2 13.3 15.3 2.5 15.5 157
1864 35.8 46.0 18.0 0.2 13.3 14.8 2.2 12.7 143
Average 39.7 46.1 17.7 0.3 13.0 13.9 1.8 12.3 144
The maximum number of infractions of the Vagrant Act took place in 1858, when the harmful consequences of the rise in the price of grain, which took place immediately before, were still making themselves felt. The increase in 1861–1862 was the result of the high price of wheat, and of the crisis in the cotton industry.
France.
Years. Arrests in the Department of the Seine to 100,000 of the Population. Average Price of Grain per Hectolitre.
1855 1222 fr. 29.37
1856 1170 30.22
1857 1169 23.83
1858 1154 16.44
1859 1008 16.69
1860 1074 20.41
1861 1128 24.25
1862 1250 23.24
1863 1133 19.78
1864 1158 17.58
Here also the influence of price makes itself felt.
The following table gives the number of persons arrested in the department of the Seine, grouped according to the alleged crimes, and compared with the price of wheat. Group I contains offenses against the public order; Group II, offenses against persons; Group III, offenses against morals; group IV, offenses against property; Group V, miscellaneous. Taking 100 as the average figure for the price of grain as well as for crimes in the economically favorable years 1858–59, the proportion is as follows:
Here it is to be observed:
a. that the movement of mendicity and vagrancy is not in direct correlation with that of the price of grain.
b. that Group IV shows only a slight correlation with the price of grain, since there are included in it many crimes whose causes are not of an economic nature.
c. that during the last years of this period the increase of crimes against property was greater than the figures for the price of grain would lead one to suppose; a fact which is explained, according to Dr. Mayr, by the lack of work resulting from the war of secession.
The law that crimes against persons increase with the fall of prices is confirmed by these statistics.
According to this author the laws regulating moral phenomena are at present hidden by thick clouds.
“We may await with confidence the dissipation of these clouds, when some great principle, about which our observations of detail will group themselves, will appear to us in a flood of light. Everything seems to indicate to me that this master principle is no other than the principle of activity. In fact, the first rudiments of social science have as yet been given us only by political economy, and its sole foundation is the affirmation of human activity. On the other hand, since giving myself up without any preconceptions to this special study of criminality I have been little by little led by a close examination of the facts, to find the general cause of crimes in the absence of this principle of activity.
Let us accompany the author to the domain of facts. After having given an exposition of the movement of criminality in France in comparison with that of other countries, he finally takes up the question of etiology. For the crowd, says the author, the criminal is a kind of monster in the midst of society, a monster predestined to crime because of his innate tendencies. Looked at in this way criminality is an individual evil. Corne, on the contrary, believes it to be a social evil. For, however much society may be developed in all respects, it is nevertheless always imperfect, since the ignorance and corruption of morals are great. The author lays stress upon two facts, namely, the corruption of morals in the upper classes, and militarism. Not only does militarism draw after it the ruin of peoples, and develop man’s violent instincts, but it has still other very serious moral consequences, by forcing celibacy upon young men at the passionate age.
The author admits that there are facts which might seem to give the lie to his opinion—the influence, for example, of the price of grain upon the decrease and increase of criminality.
Years. Average Price of a Hectolitre of Wheat. Number of Persons Arraigned.
fr. c.
1850 14 32 147,757
1851 14 48 146,368
1852 16 75 159,791
1853 22 39 171,351
1854 28 82 170,940
1855 29 32 163,748
1856 30 75 162,049
1857 24 37 161,556
1858 16 75 157,815
1859 16 75 150,948
1860 20 24 144,301
1861 24 55 151,112
1862 23 24 152,332
1863 19 78 144,072
1864 17 58 146,230
Although, according to Corne, the high price of grain may be only an accidental fact, there must yet be some importance attached to it in view of the disastrous consequences which may result from it to families that have in any case a hard time to make both ends meet. But the figures given above do not prove the influence to be very great. For prices rise sometimes although the other figures fall, and vice versa. And then the sudden increase of [detected] crime from 1849 to 1853 must be attributed to a better organization of the police.
Then the author gives the following table:
Years. Price of a Hectolitre of Wheat. Number of Persons Convicted (to 1000 of Population).
fr. c.
1850 14 32 147,757
1851 14 48 146,368
1852 16 75 159,791
1853 22 39 171,351
1854 28 82 170,940
1855 29 32 163,748
1856 30 75 162,049
1857 24 37 161,556
1858 16 75 157,815
1859 16 75 150,948
1860 20 24 144,301
1861 24 55 151,112
1862 23 24 152,332
1863 19 78 144,072
1864 14 32 146,230
We see that the coincidence of the figures is here naturally greater than in the first table.
The author then depicts the environment in which the children of the proletariat ordinarily grow up—bad hygienic conditions, demoralizing surroundings, etc.—and points out the harmful effect of labor in factories upon the young. Corne also considers celibacy to be one of the causes of crime, since the individual has no one to care for him or be interested in his fate. Crime is developed much more in the great cities than in the country, for the reason, the author thinks, that men are much more isolated, much more left to themselves in the city than in rural neighborhoods.
—Here I would remark that it is for economic reasons that men are prevented from marrying, and that the great criminality of cities is best explained by the marked difference in economic situation, and by the more frequent opportunities for wrong-doing found there.—
VII.
H. Von Valentini.
The work “Das Verbrecherthum im Preussischen Staat”, published in 1869 by Prison-director von Valentini, treats especially of the results obtained by the penal system then in force in Prussia, and of the means of improving it.
Chapter Three, upon the “Dimensionen des Nothstandes” contains detailed tables for each province, the great cities, and the rich and poor countries. He obtains, then, the following result for the eight provinces:
Provinces. Pauperism Number of Indigent Persons in the Poorest Districts. To 100 of the Population. Percentage of Property to 100,000 of the Population. Ratio of the Percentage of against Property to that of Pauperism.
Posen 536,495 36.1 32.89 0.91 : 1
Prussia 792,948 27.6 24.69 0.89 : 1
Pomerania 314,383 22.6 20.57 0.91 : 1
Silesia 517,528 15.2 36.94 2.43 : 1
Total of Eastern group 2,161,354 23.6 115.09 4.91 : 1
Rhenish provinces 397,350 12.0 5.59 0.46 : 1
Brandenburg 84,011 3.4 26.27 7.72 : 1
Westphalia 45,849 2.8 9.21 3.29 : 1
Saxony 259,901 1.3 18.33 14.10 : 1
Total of Western group 553,111 5.9 59.40 25.57 : 1
There were in the following provinces:
Posen 57,519 of these estates, or 1 to 25 inhabitants.
Prussia 93,793 of,, these,, estates,,, or,, 1,, to,, 30 inhabitants.,,
Pomerania 61,752 of,, these,, estates,,, or,, 1,, to,, 22 inhabitants.,,
Silesia 230,710 of,, these,, estates,,, or,, 1,, to,, 14 inhabitants.,,
Total of the Eastern group 443,774 of,, these,, estates,,, or,, 1,, to,, 18 inhabitants.,,
Rhenish provinces 788,473 of,, these,, estates,,, or,, 1,, to,, 4 inhabitants.,,
Brandenburg 112,532 of,, these,, estates,,, or,, 1,, to,, 22 inhabitants.,,
Westphalia 197,383 of,, these,, estates,,, or,, 1,, to,, 8 inhabitants.,,
Saxony 174,373 of,, these,, estates,,, or,, 1,, to,, 11 inhabitants.,,
Total of Western group 1,272,761 of,, these,, estates,,, or,, 1,, to,, 8 inhabitants.,,
In this connection he treats of housing conditions, for which he gives the following figures.
Dwellings to 1 league:
Posen 258 Rhenish Provinces 901
Prussia 230 Brandenburg 304
Pomerania 218 Westphalia 579
Silesia 546 Saxony 529
Total 1252 Total 2313
A more detailed summary of the number of inhabitants shows us that there were:
Posen. Prussia. Pomerania. Silesia. Rhenish Prov. Brandenburg. Westphalia. Saxony.
Inhab. Inhab. Inhab. Inhab. Inhab. Inhab. Inhab. Inhab.
In each dwelling 9.8 9.8 10.1 7.9 6.9 10.0 7.2 7.5
In the cities 11.2 13.2 11.6 13.3 10.4 14.0 8.7 9.8
In the hamlets 8.8 10.6 10.0 8.1 6.1 9.6 7.0 6.8
In the villages 9.3 8.4 9.3 7.0 5.7 7.7 6.7 6.5
In these figures von Valentini sees a parallelism with those for small holdings, and draws the conclusion that this isolation of households is one of the best preventives of crimes against property.
Percentage.
Year. Offenses against Morals. Arson. Offenses against Property. Offenses against Persons. Combined Price per Bushel of Wheat, Rye, and Potatoes in Groschen.
1854 2.26 0.43 88.41 8.90 218.1
1855 2.57 0.46 88.93 8.04 252.3
1856 2.65 0.43 87.60 9.32 203.3
1857 4.14 0.53 81.52 13.81 156.3
1858 4.45 0.60 77.92 17.03 149.3
1859 4.68 0.52 78.17 16.63 150.6
Average 3.34 0.48 84.42 11.76 188.2
This table shows then: first, that crimes against property diminish as prices fall; second, that under these same conditions crimes against morals and against persons increase.
—We must be on our guard, however, against drawing false conclusions from this second fact. The relationship in question is observed only during a certain period and in certain countries, and is not to be regarded as a law of nature, i.e., it must not be understood that an improvement in economic conditions invariably causes an increase in sexual and violent crimes. If this were the case, the well-to-do classes, who are always in a position to provide for all their needs, would furnish most of the criminals of this description. The facts show just the contrary to occur everywhere. (See Part Two, where I treat this subject fully.)—
In the chapter, “Die social ethische Lebensbethätigung in der bürgerlichen Rechtsphäre,” the author treats our subject more fully. Reasoning from different data taken from other authors, he points out the connection between economic conditions on the one hand and vagabondage and mendicity on the other. Having shown a considerable increase in these offenses in the revolutionary period of 1848, he attributes this increase to the lack of social discipline, for the price of provisions was then low. We pass all this part of von Oettingen’s book in silence, his data being taken for the most part from other authors. We would merely point out his error in ranking the year 1848 among those economically favorable because of the fall in the price of food. As a matter of fact there was a terrible economic crisis in Europe at the time.
We take the following data from the section entitled “Getreidepreise und Kriminalität.”
To 100 complaints there were (in Prussia):
Years. Crimes against Price of Rye per Bushel.
Property. Persons.
% % Sgr. Pf.
1862 44.3 15.8 63 .10
1863 41.6 17.0 54 .3
1864 41.6 18.4 45 .6
1865 38.5 17.7 49 .11
1866 44.4 14.5 58 .5
1867 50.2 13.1 79 .0
1868 52.3 13.8 78 .8
1869 45.7 14.3 64 .7
We find here this rule, that a rise in the price of food is accompanied by an increase in the crimes against property and a decrease in crimes against persons, and vice versa. This table also shows that, if a very pronounced rise in prices has caused a great increase in criminality, the later fall in prices does not make itself felt in the number of crimes until some time after its commencement. (See 1867–1868.)
This phenomenon is very distinctly shown by the following table:
Years. Cases Tried. Total Price of a Bushel of Wheat, of Rye, and of Potatoes in Groschen.
1854 644,483 221.6
1855 686,207 241.4
1856 766,628 228.4
1857 705,291 161.1
It was only in 1857, then, that the fall in prices, beginning in 1856, commenced to produce its effect.
In conclusion we call attention to the following tables:
Saxony.
Years. Crimes Against Price of Wheat, of Rye, and of Potatoes per Bushel.
Property. Persons.
Gr.
1860 37.25 35.04 170
1861 40.28 33.10 181
1862 38.78 34.65 173
1863 36.56 35.09 147
Bavaria.
Years. Crimes Against Price of Wheat, of Rye, and of Potatoes per Bushel.
Property. Persons.
Fl. Kr.
1862/63 38.38 33.16 14,48
1863/64 36.16 37.72 12,16
1864/65 36.55 39.79 11,53
1865/66 33.42 41.18 10,57
Here is another proof of the rule, then, that crimes against property decrease and those against persons increase as prices fall.
IX.
H. Stursberg.
As regards the causes of this increase, Stursberg, though not rejecting entirely the opinion of Quetelet that society prepares the crime and that the criminal is only the instrument that executes it, is nevertheless of the opinion that it is very necessary to take into account the personal factor, i.e. the presence or absence of religious and moral sentiments.
There are those, says the author, who seek the cause in the consequences of the war against France. Although believing also that the war has had unfavorable effects upon criminality, it is impossible, in his opinion that this war should be the cause of the increase of criminality, since crime decreased after the wars of 1864 and 1866. He considers that one of the causes is the great mildness of the penalties imposed by the new penal code of the empire. But according to him, this is not important, for since 1871 there has been rather a diminution than an increase of recidivism. Nor can bad economic conditions be the cause, says Stursberg; for criminality had already begun to increase before the bad years, and it is not theft that has increased the most. Nevertheless, Stursberg recognizes that prolonged poverty weakens the moral sentiments, which shows that criminality and poverty are closely connected.
But there are, in his opinion, more serious causes. There follows a description of the impetus taken by industry in Germany during the early seventies, a description not easily surpassed in pointlessness, and in the naïve ignorance that it evinces. Without comprehending the significance of the really important events that are happening about him, the author fulminates against certain consequences of modern capitalism.
—This appears to him as the consequence of a suddenly awakened desire for riches. But why should this desire arise at this time? The author does not tell us. But notwithstanding this he has unquestionably discovered here one of the principal causes, since the prodigious increase of industry, shortly followed by the inevitable crisis, has infallibly caused an increase in criminality. Since Stursberg treats this question rather as a moralist than as a man of science, we have no interest in spending longer time upon it.—
In the first few pages of his brochure Stursberg speaks of the disastrous consequences of alcoholism, after the enactment of the law of 1869, which increased the number of spirit shops. Armed with quotations without number he combats in turn the cafés-chantants, immoral literature, etc., etc.; after which he introduces all at once the matter of professional liberty. He speaks of the “influence, impossible to estimate, which honest and pious masters exercised for centuries upon the journeymen and apprentices, who were like members of the family.” “The freedom of the trades came in and loosed the bonds of piety and discipline which had retained the journeyman and apprentices in the home of their master.”
—As far as we can see, the ideas of the author are rather those of a writer of the Middle Ages, than of a contemporary of modern capitalism. It cannot be denied that there is truth at the bottom of this reasoning. For it is incontestable that in the time of the guilds the position of the journeymen was in general more favorable than that of the proletariat today. But it does not follow that the religion of the master was the cause of this. And a demonstration in which professional liberty is represented as being in fact a legislative error, and not the logical and inevitable consequence of the birth of modern capitalism, is so unscientific that it has no place in an investigation into the causes of the increase of criminality.—
X.
L. Fuld.
Before entering upon his special investigation, the author of “Der Einfluss der Lebensmittelpreise auf die Bewegung der strafbaren Handlungen” makes the following observation: Everywhere it is noted that assaults upon morals with acts of violence increase when the price of provisions falls. Adhering to the opinion of von Oettingen that “as the consequence of an increase of prosperity, the tendency to crime shows itself more by crimes against morals than by those against property”, Fuld also mentions the opinion of Valentini, that “in this case the people become audacious and commit these crimes more easily.”
Here are other salient facts; that the number of young criminals increases, and that the city produces more criminals than the country, although the sexual morality especially is far from ideal in the country. Finally in speaking of the influence of profession, Fuld mentions that the increase in the number of criminals which accompanies a rise in prices is greater for the first offenders than for recidivists. The following table which he gives to prove this point, however, plainly fails to do so:
England.
Years. Good Character Hitherto. Character Unknown. Price of Wheat.
Sh. d.
1858 153,576 138,388 43 11
1859 153,369 150,084 43 8
1860 137,574 144,485 52 9
1864 167,038 165,808 40 2
The author explains that the crimes against property are one of the consequences of the struggle for existence, a fact which accounts in part for the high figures for criminality in the great cities, where competition is most intense. The author treats of theft, and begins by saying that the connection between the price of provisions and theft is very close.
France.
Years. Thefts. Price of Cereals.
fr.
1856 18,222 16.75
1857 17,218 16.75,,
1858 15,537 16.75,,
1859 14,755 16.75,,
1860 15,707 20.24
During the following years the prices fell. Nevertheless the number of thefts increased. According to Fuld we can draw the conclusion that the influence of price is only relative!—This table proves little. For, while in 1856 criminality attained its highest point, prices were lower than in 1860; and, while the figures for theft diminished greatly, prices remained constant.—
England.
Years. Thefts. Price of Cereals.
With Violence. Without Violence.
Sh. d.
1857 6471 43,397 42 10
1858 5723 45,618 43 11
1859 4433 41,370 43 8
1860 4065 41,151 52 9
1861 5062 40,242 55 4
1862 5746 40,191 55 5
1863 5433 39,801 44 9
1864 5022 39,481 40 2
1865 5160 40,383 41 10
1866 5088 39,731 43 10
1867 6355 46,502 49 10
Here there is some agreement between the number of thefts and prices. But it is not as great as Fuld would make out. For example, notwithstanding the sudden rise on prices in 1860, criminality diminished, while the year following there was a still further fall in the thefts without violence.
Prussia.
Years. Thefts of Wood. Price of Rye.
Sgr. Pf.
1862 387,000 63 .10
1863 354,276 54 .3
1864 366,667 45 .6
1865 426,336 49 .11
1866 425,551 58 .5
1867 412,165 79 .0
1868 419,158 78 .8
1869 406,662 64 .7
1870 389,746 62 .3
1871 439,288 66 .0
1872 401,280 82 .0
1873 337,112 93 .0
1874 356,859 108 .0
We can indeed find here some agreement between the two columns, but that is all that can be said.
Then the author says that differences in price are not as great as formerly, on account of the development of international commerce. He gives a table of comparative prices from 1870 to 1879 which shows that five staples show no consistent movement in price. But during the same period theft was continually on the increase. The number of male delinquents from 18 to 50 alone varies with prices; the figures for delinquents between 50 and 60 follow the course of prices but slightly. Other economic crimes show little conformity.
The final conclusion of Fuld upon crimes against property is: “The influence of the price of provisions upon these offenses is quite important.” Although not giving my opinion upon the correctness of this judgment at this time, I may say that the statistics furnished by Fuld give almost no proof of it.
The following part treats of crimes against life. It is evident that we are not concerned with crimes of passion. The only ones that enter into consideration are those that have an economic object. But since criminal statistics do not make this distinction, the results of the author’s investigation can be but small. He is indeed convinced that the influence of the price of provisions is very perceptible, but he does not prove it. The same may be said with regard to sexual crimes.
“The wants that man must satisfy are numerous, but there is none which makes itself felt so much as hunger. If he cannot satisfy his wants in a lawful fashion, necessity drives him to other means.”
To prove what he says Dr. Weisz produces the following table:
France.
Years. Accusations of Crime. Price of Wheat.
1845 5054 19.75
1846 5077 24.05
1847 5857 29.01
1848 4632 16.65
1849 4910 15.37
1850 5320 14.32
1851 5287 14.48
1852 5340 17.23
1853 5440 22.39
1854 5525 28.82
1855 4798 29.32
1856 4535 30.75
1857 4399 24.37
1858 4302 16.75
1859 3918 16.74
1860 3621 20.24
1861 3842 24.55
1862 3906 23.24
1863 3614 19.78
1864 3447 17.58
With but seven exceptions criminality here follows prices. When the figures for crimes against property are substituted for those for general criminality in the table, the agreement becomes greater:
1847 4537 29.01
1848 3020 16.65
1849 2895 15.37
1850 3174 14.32
1851 3126 14.48
1852 3327 17.23
1853 3519 22.39
1854 3761 28.82
1855 3133 29.32
1856 2766 30.75
1857 2689 24.37
1858 2315 16.75
1859 2019 16.74
1861 2146 24.55
1862 2144 23.24
1863 1941 19.78
1864 1744 17.58
Belgium.
Years. Price of Wheat. General Criminality. Offenses against Property.
1841 20.02 444 332
1842 22.17 468 361
1843 19.41 434 346
1844 17.75 455 336
1845 20.06 387 275
1846 24.53 616 498
1847 25.20 579 496
1848 17.37 529 427
1849 17.15 451 338
1850 16.15 270 168
1851 16.71 247 132
1852 20.16 290 140
1853 25.13 264 191
1854 31.48 336 238
1855 32.92 299 212
1856 30.73 332 268
1857 22.96 309 197
1858 23.55 278 167
1859 24.00 314 187
1860 31.15 254 161
It is to be noted here that in the years 1850–1860 the penal law was changed. The correlation is not constant but appears in many cases. The years of the crisis, 1846–1847, are especially interesting.
Years. Infanticide.
1845 5
1846 17
1852 7
1853 13
1854 12
1855 14
England.
Years. Price of Wheat. Number of Criminal Offenders.
1816 78 .6 9,091
1817 96 .11 13,932
1846 54 .8 20,072
1847 69 .9 22,451
1852 40 .9 24,443
1853 53 .3 27,187
1854 72 .5 27,760
1855 74 .8 31,309
1856 69 .2 29,591
1857 56 .4 26,542
1858 44 .2 24,303
—The value of Dr. Weisz’s information would be greater if he had given us the relation of the figures for criminality to those for population.—
The first chapter that interests us is Chapter V (“Die Umgestaltung des Volkslebens, ihre Einwirkung auf die Kriminalität,” etc.) Sec. 3 (“die Sorge für die nothwendigsten Lebensbedürfnisse und die Lebensmittelpreise”).
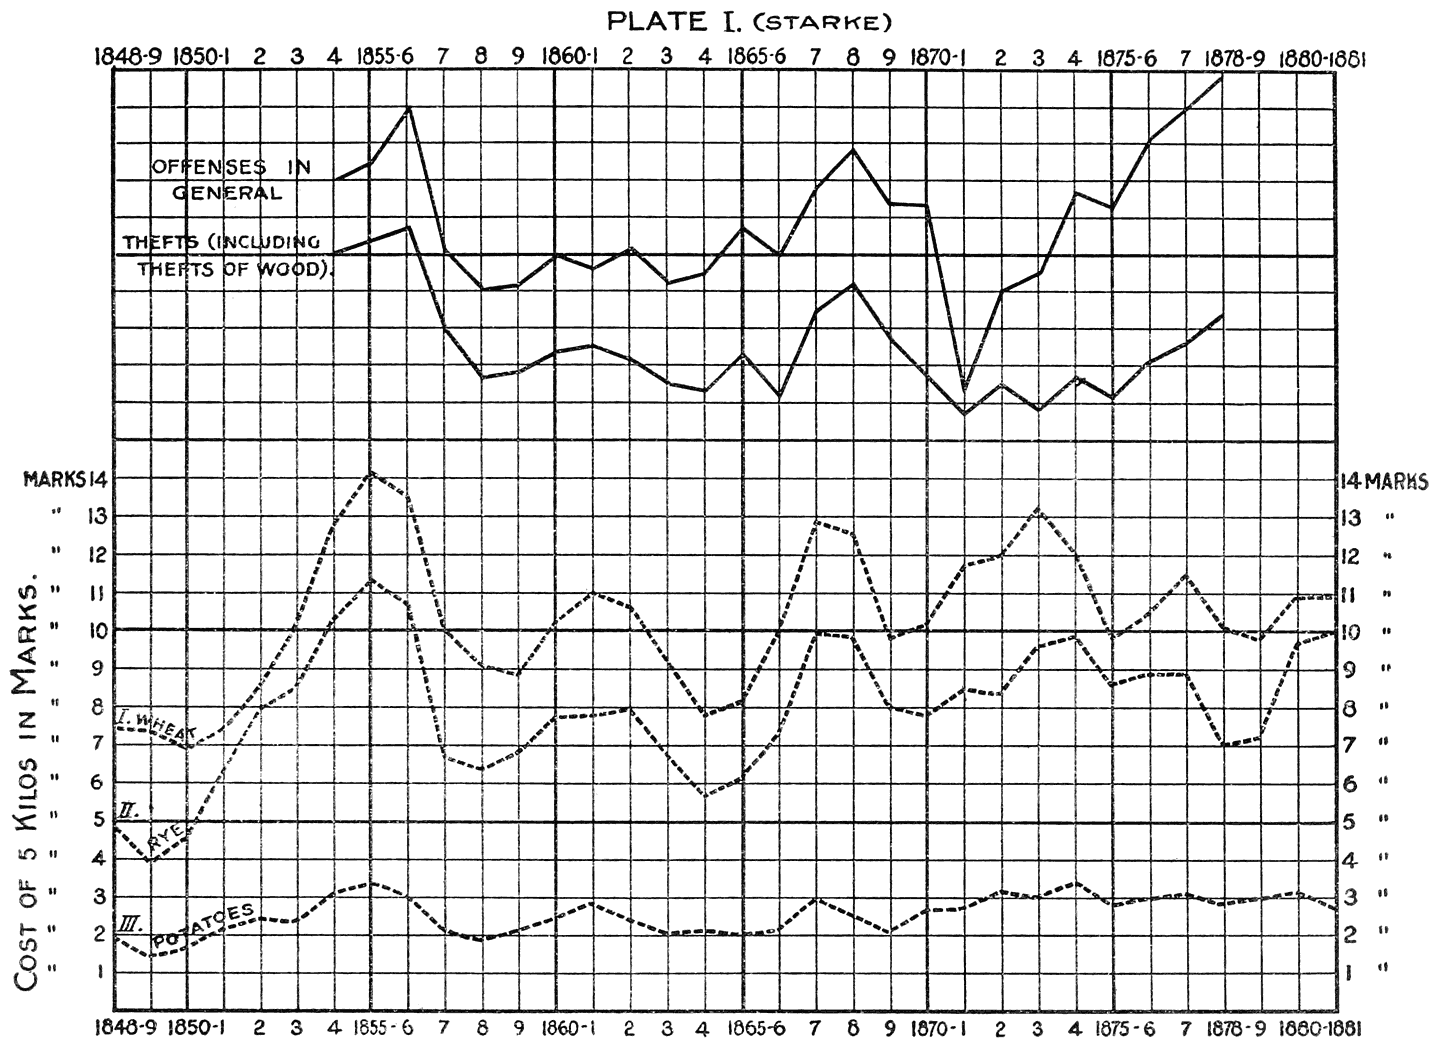
PLATE I. (STARKE)
Just as the influence of the price of food makes itself felt in the number of marriages and births, it is also visible in the figures for criminality. So, when the temperature of the winter is very low (e.g. 1855, ’56, ’65, and ’71), since men have greater wants than ordinary, criminality rises. Thefts of wood increase during these years, for example. But it is in only one part of the year that the cold makes itself felt, while the high price of food lasts the whole year. Hence the latter has much more influence on criminality.
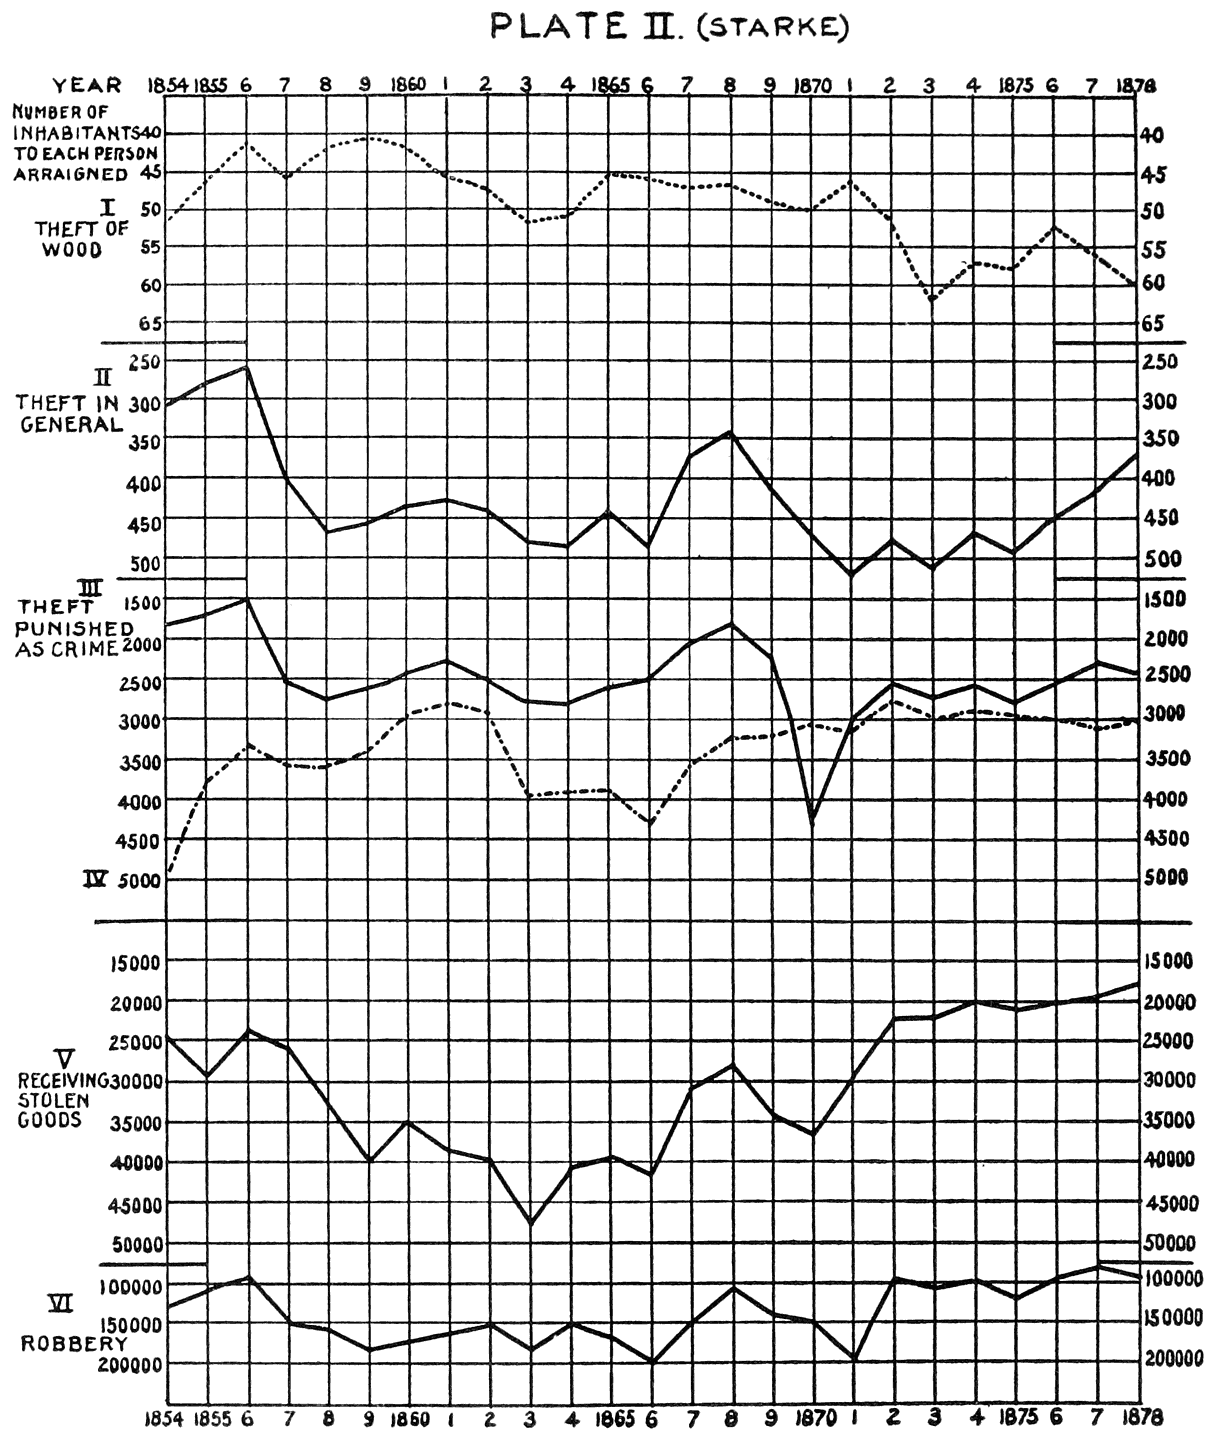
PLATE II. (STARKE)
In the first of the plates which the author gives (see Plates I–VI), the effect of the rise in prices is distinctly seen in the period 1849–1855. The fall that follows is also accompanied by a diminution in the number of crimes. When, at the close of 1858, the price of rye and potatoes begins to rise again, criminality also increases, though not so much. We do not see this agreement during the years 1861–1865. While prices rise in 1866, criminality declines as a consequence of the war with Austria, and of economic events.
The years 1870–1871, during which prices rose, show a fall in the figures for crime, a second exception to the rule therefore, since 1866. At the close of 1875 criminality increased greatly, although prices rose but little, and when, in 1877, prices begin to come down, the curve for criminality goes on rising. As for the years 1870–1871, the explanation is to be found in the war, which strengthened the feeling of solidarity (as in a less degree in 1866). Further, the development of manufacturing had already begun by the end of the war, and the war itself withdrew from ordinary life many persons who, without it, might have committed crime. The author mentions also the great diminution of crime in France during these years.
We note, however, that the French statisticians (Lafargue, for example) consider these years as of little importance in the study of criminality, since the police and the courts were then much less active than at ordinary times. The same causes may be supposed to have been active in Prussia also, though in a less degree than in France.
At the close of the middle of this century manufacturing was but slightly developed in Prussia. But after the war its development assumed gigantic proportions. Wealth increased, but was not evenly distributed, as the following table from the income tax returns shows:
Persons. Percentage.
I. Having an income of 1000 thalers 139,556 1.2
II. Having,, an,, income,, of,, 400–1000 thalers,, 643,628 5.6
III. Having,, an,, income,, of,, 140–400 thalers,, 4,207,163 36.4
Not liable to the income tax
IV. (Average income, 120 Th.) 6,582,066 56.8
Total 11,572,413 100
Total number of those having an income of 400 thalers or under, 93.2%.
Education (Men and Boys over 10).
Classes. Persons. Percentage.
I. Higher education 93,000 1.023
II. Intermediate education 193,000 2.122
III. Elementary education 7,885,423 86.703
IV. Illiterate 923,274 10.152
Total 9,094,757 100.00
There were 96% of the population, then, with no education or only an elementary one.
Little by little manufacturing so forged ahead of agriculture that the necessary food was no longer produced in the country. From this time dates the importation of large quantities of grain.
The year 1873 saw the beginning of the terrible reaction that made itself felt in all strata of the population. The number of marriages diminished as well as the number of births, and criminality increased. (See Plate I.)
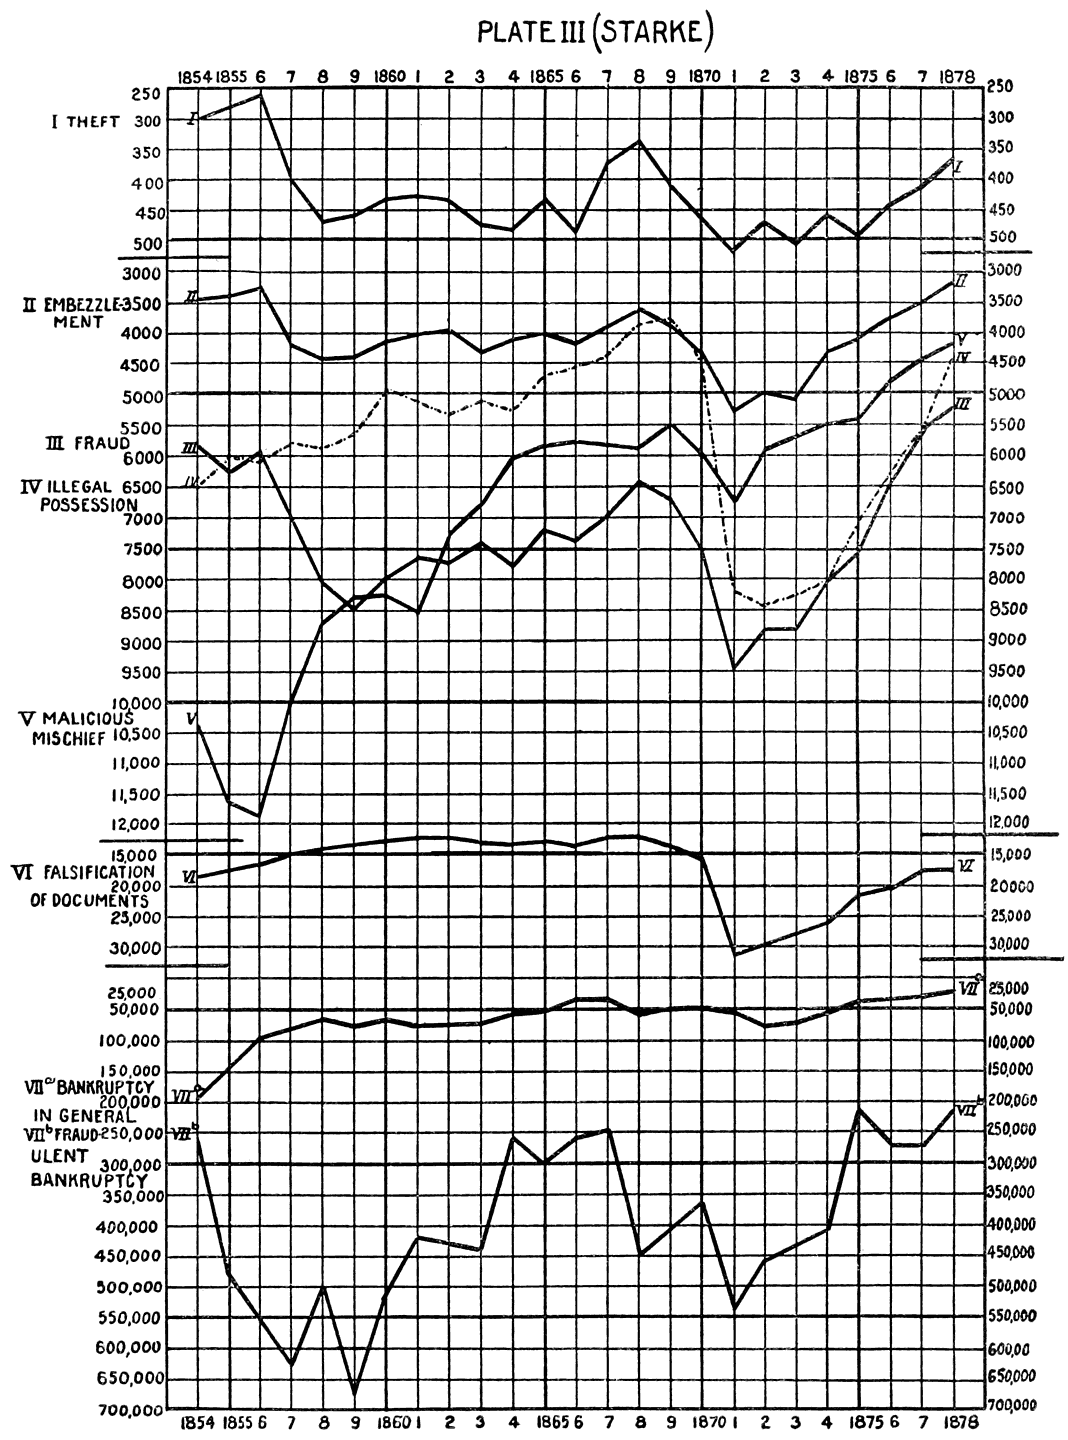
PLATE III. (STARKE)
—Without doubt the participation of all classes in the political life will lead to crimes, especially when in the strife of classes the propertied class makes use of violent means. The assertion that the socialistic movement causes many crimes has only a semblance of truth. It is rather because of the manner in which the socialists are treated, than because of their doctrine that they are driven to acts of violence. For the socialists wish to attain their end by pacific and legal, political and economic means, and it is only when they are opposed by force that they are incited to the use of violent means.—
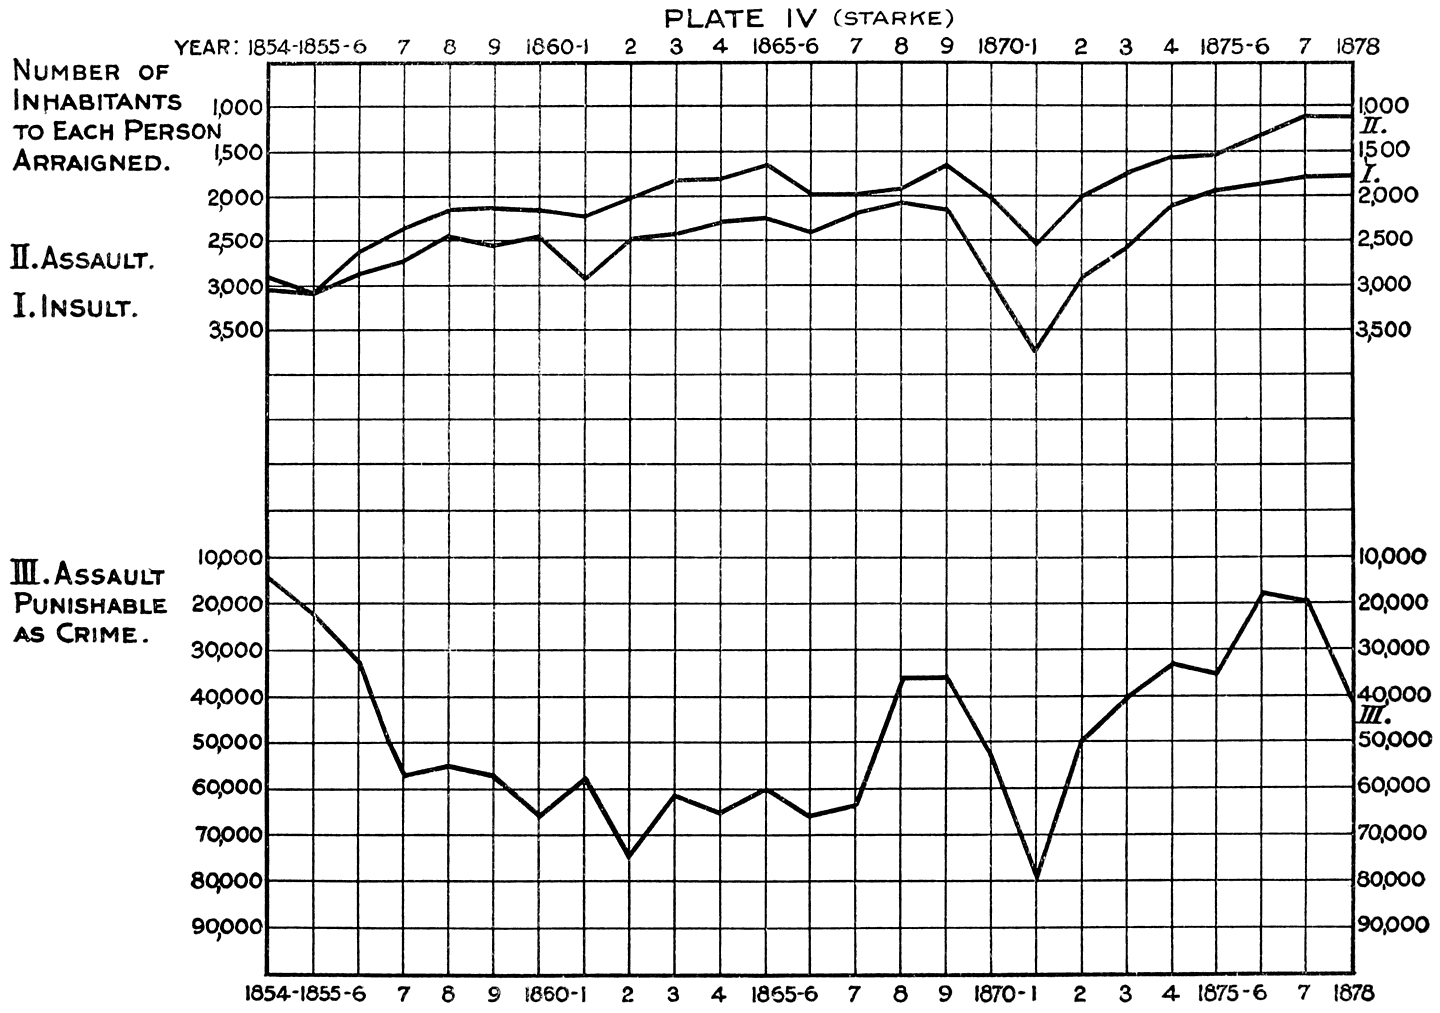
PLATE IV. (STARKE)
Starke finally draws the following conclusion as to the causes in the movement in criminality: “Hardly ever in the short space of a generation have so many mighty factors of different kinds influenced the life of our people, as in the years from 1848 to 1878; a complete metamorphosis of the courts and the police; so extraordinary an increase in the numbers and density of the population that the soil could no longer produce enough to feed such numbers; connected with this a great development of manufacturing with repeated crises, brought on by the high price of the necessaries of life, and by epidemics; the development of intercourse and commerce world-wide in extent; bloody wars, which, through the system of universal military service, disturb the whole population of every class; a politico-economic crisis so severe that there has been none like it hitherto; and in addition to and at the same time with all these factors, the entrance of the people into the exercise of political rights; and finally, dependent upon these, a deep-seated socialistic agitation.
Offenses and contraventions against property.
Examining now Plates II and III, the influence of the years of high prices (1856 and 1867), of the years of war (1866 and 1870–1871), and of the years of crisis shows itself very plainly. It is to be noted that the curve of crimes of “malicious mischief” takes a course totally different from that of crimes against property committed from other motives. Plate III shows the great influence of economic events upon fraudulent bankruptcies (1857 and 1873 having been years of crisis).
Offenses against persons.
We see that the curves of these crimes shown upon Plates IV and V have a course quite different from that of the curves of the crimes against property. It is only in 1870 that both fall together. Starke deduces the rule, confirmed by many statisticians, that an improvement in economic conditions is accompanied by an increase in assaults, etc., and vice versa. The facts confirm this rule during the first part of the period that Starke has studied, but not later. (Compare Plates I and IV.)
In studying the curve of infanticide we note that it reaches the highest point in the bad years, 1857, 1863, 1866, 1867 (Eastern Prussia), and 1868. In 1857 the first commercial crisis took place, and in 1864 and 1866 the cholera raged and war was declared; a number of fathers of illegitimate children died, leaving the mothers unable to support the children.
A comparison between the curve of crimes of arson, with those of the crimes against property in Plate III, committed with the same end, shows a great resemblance; the increase in this crime also shows itself in bad years.
The part of this author’s work dealing with crimes and misdemeanors against property contains some observations which are of importance for our subject.
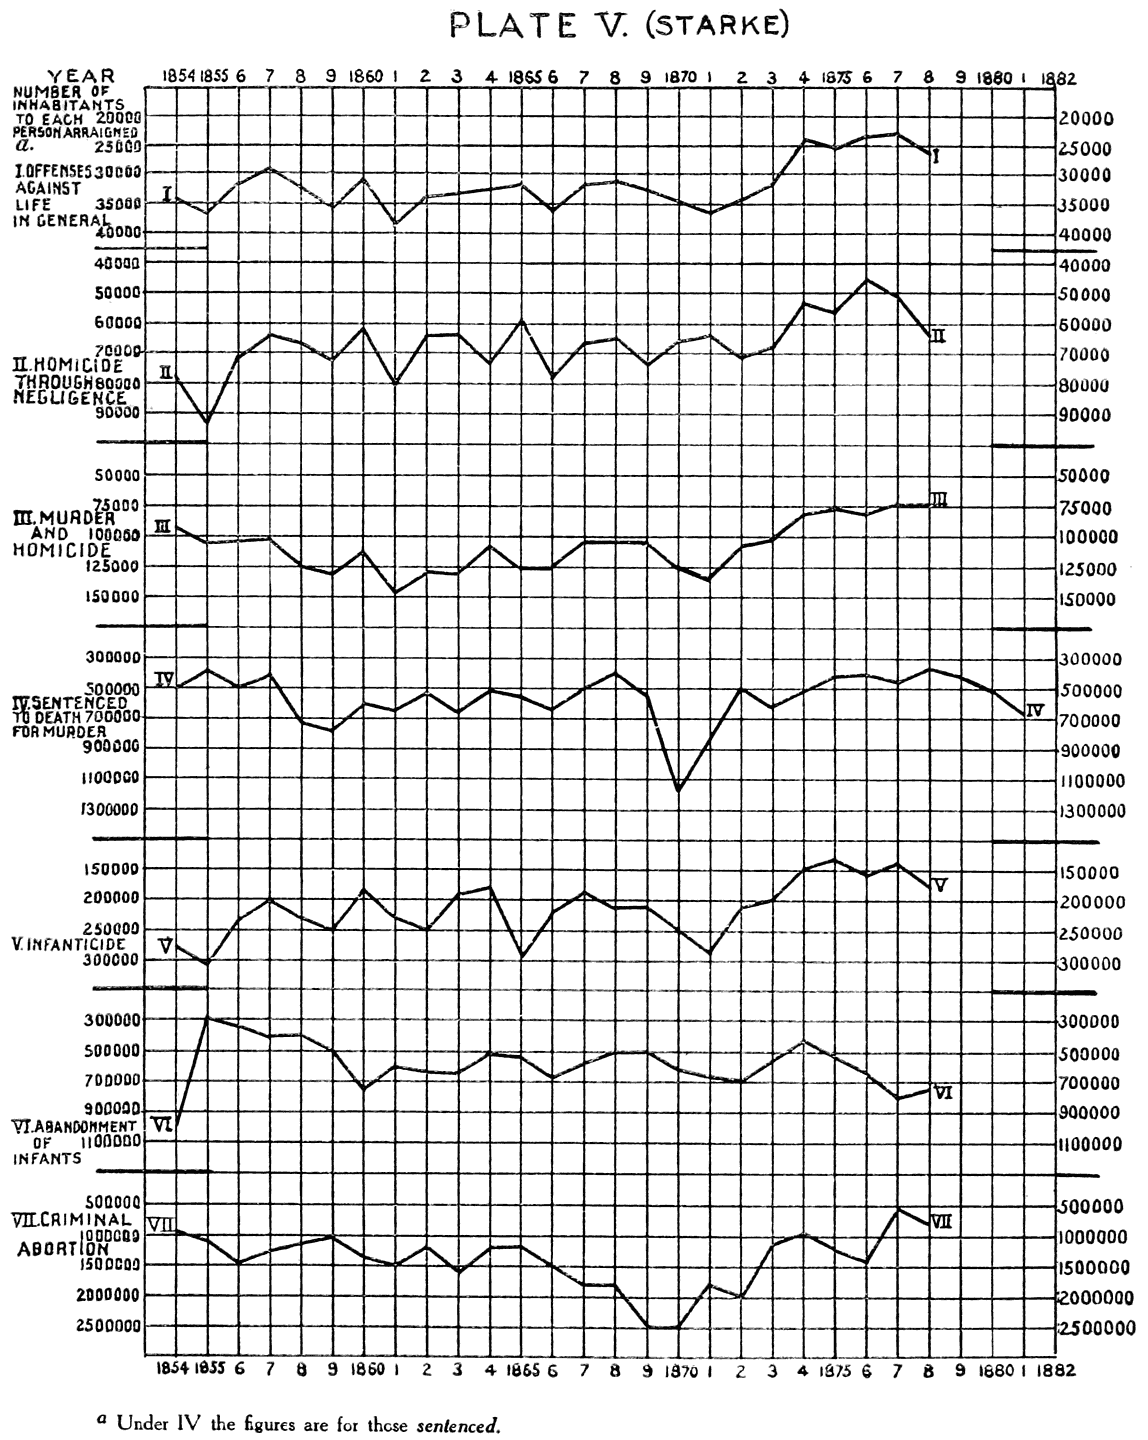
PLATE V. (STARKE)
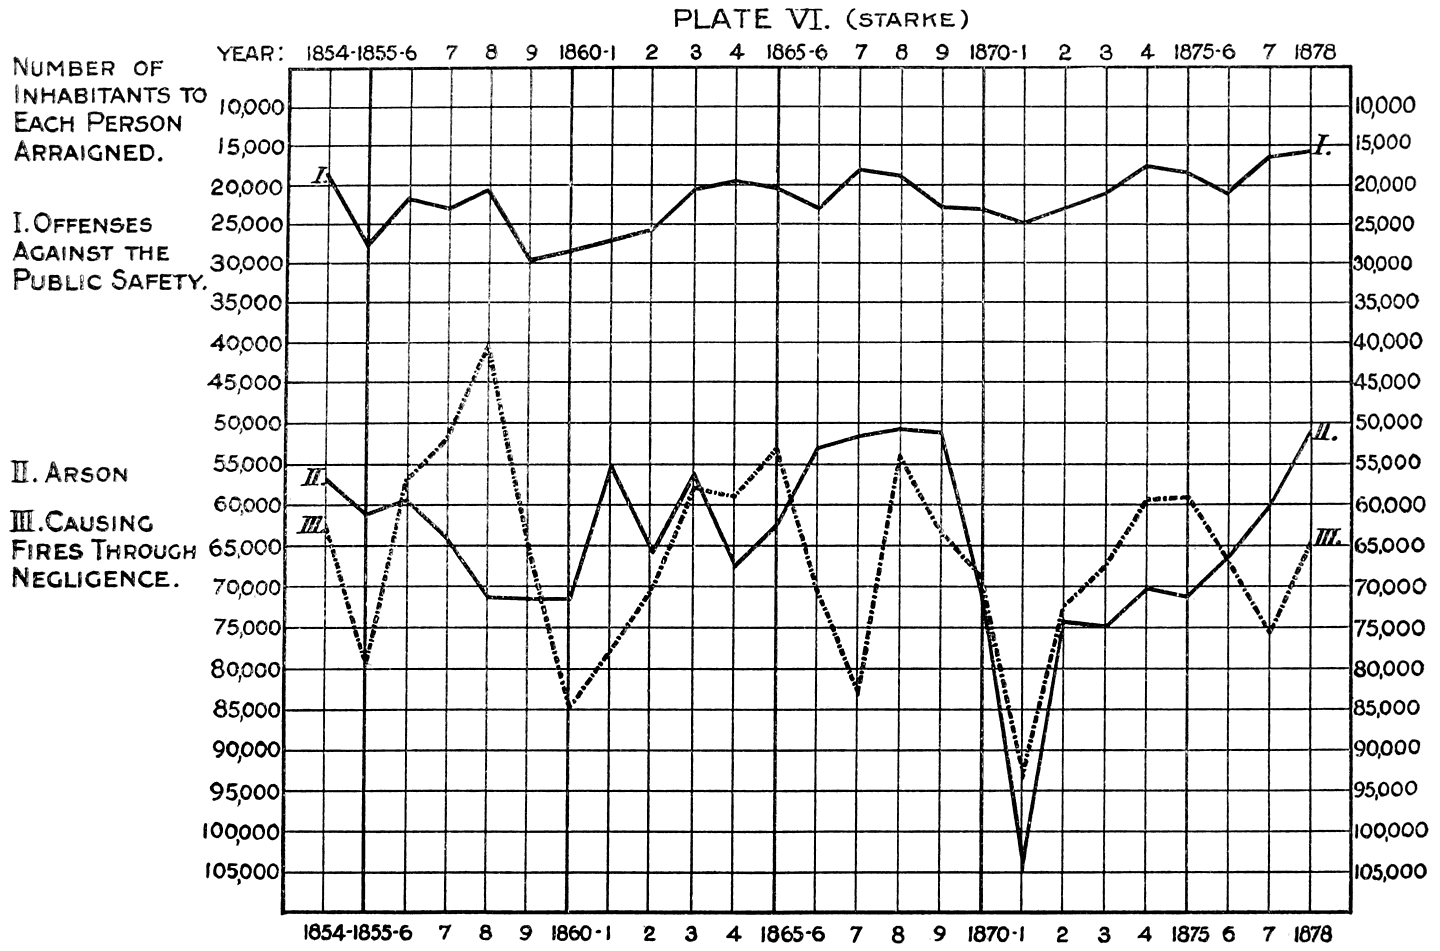
PLATE VI. (STARKE)
—We have given this quotation simply to furnish a typical example of the incorrect way in which many authors represent the socialistic opinion with regard to the genesis of crime. What nonsense, to assert that according to the theory of socialism all crimes against property find their causes in hunger and misery! See the second part of this work, where the reader will find that socialists hold an entirely different opinion, and that they have facts to prove the truth of their theories.—
With regard to the relation between the movement of the price of certain important cereals and a great part of the crime against property, the author gives the following table:
Years. Average Price Per 200 Kilogr. in Marks. Arrests for Theft to 10,000 Persons.
Wheat. Grain. Rye.
1882 22.57 23.63 18.81 26.0
1883 19.04 19.29 16.30 25.2
1884 18.44 18.75 17.17 22.7
1885 17.92 18.11 16.17 21.5
1886 17.68 17.94 14.69 20.7
1887 18.88 18.95 15.26 20.5
1888 20.23 20.64 16.19 20.3
1889 20.03 20.52 16.50 21.4
1890 21.43 21.71 17.97 21.2
1891 22.48 22.92 19.26 19.3
There is at first a certain correlation between the figures in the different columns, but there is none in the later years. It is very probable that the diminution in crimes against property is due, during these years, to a combination of favorable economic circumstances at that time.
XIV.
A. Meyer.
The author first calls attention to the years 1853–1861. We see that the curves of the price of cereals and of offenses against property are then quite closely parallel. However, the curve of the price of cereals was lowest in 1858, and that of offenses in 1859. It is a well-known fact that economic phenomena make their influence upon criminality felt only after some time. Further, it is only by the following year that a part of the offenses are counted in the criminal statistics. Crimes against persons increase when prices fall, and vice versa. The less the price of food is influenced by bad industrial conditions, the more its influence upon criminality will strike the eye.
The section following is entitled: “Schuldbetreibungs- und Konkurs-statistik als Ausdruck der wirtschaftlichen Lage der Bevölkerung und Kriminalität.” When we examine Plate II for the period 1832–1852, we see that the curves of bankruptcy and of offenses against property are parallel. From Plate III (1852–1892) we note that offenses against property are influenced by failures as well as by the price of grain. At times the two forces act in the same direction and reënforce one another, and at times their direction is opposite, and they more or less neutralize each other. It must be remarked that in 1867 an epidemic of cholera raged in the canton, and that the relief fund which was then given out kept the figure for criminality below what the economic situation would have produced.
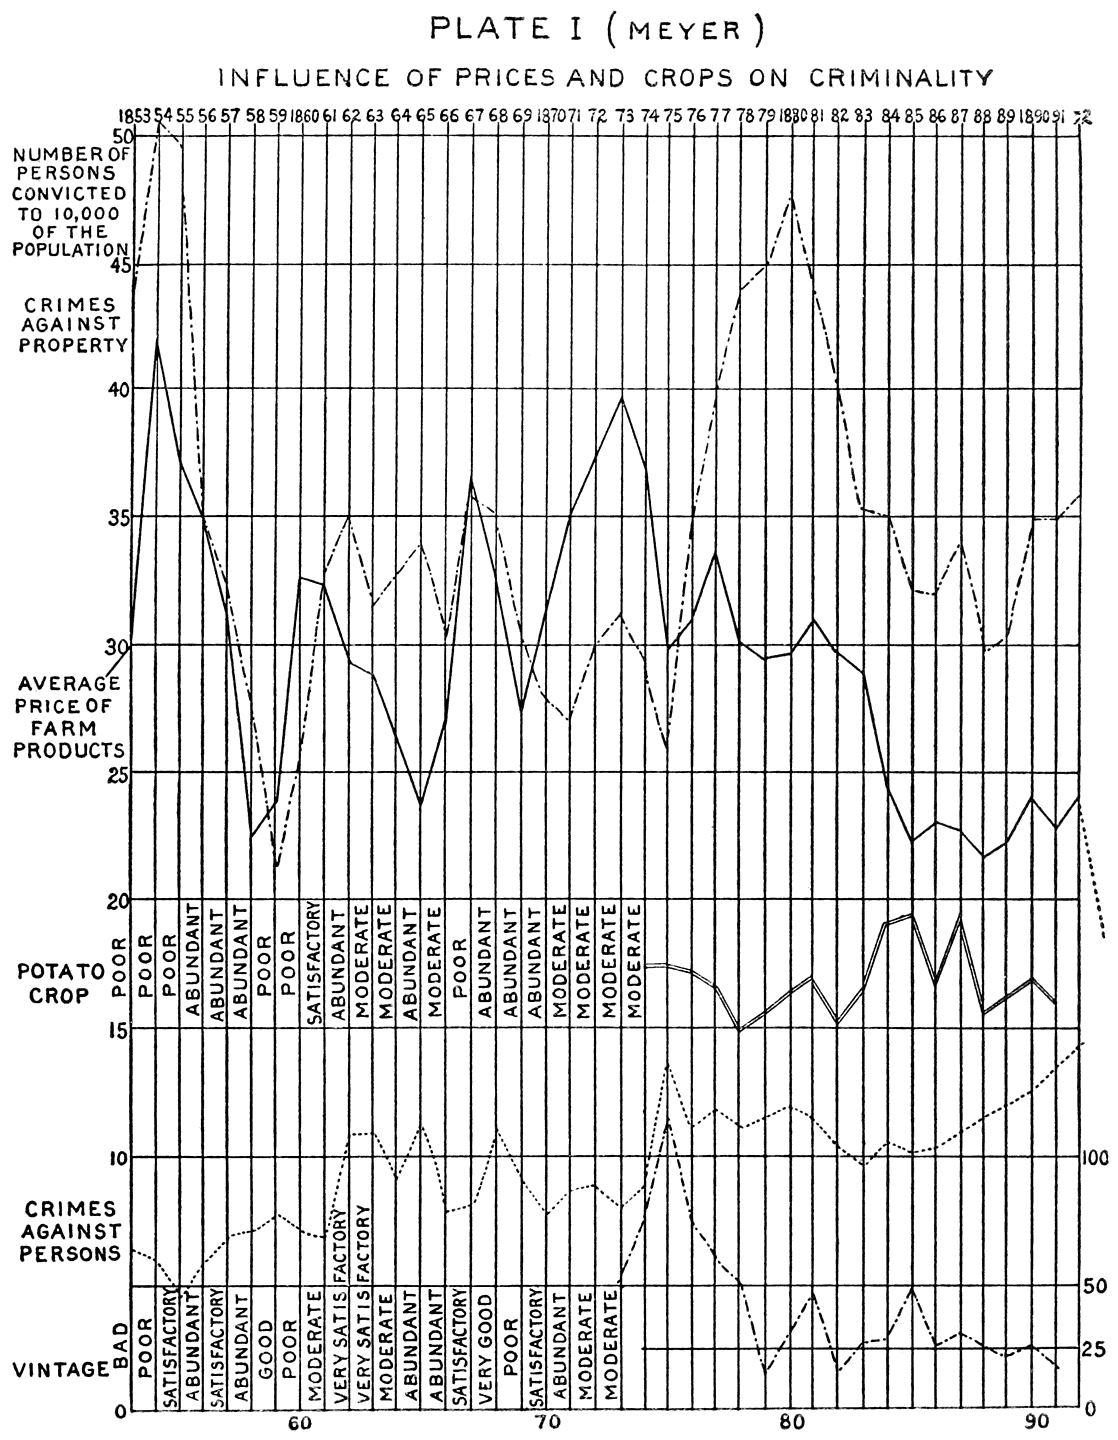
PLATE I (MEYER)
INFLUENCE OF PRICES AND CROPS ON CRIMINALITY
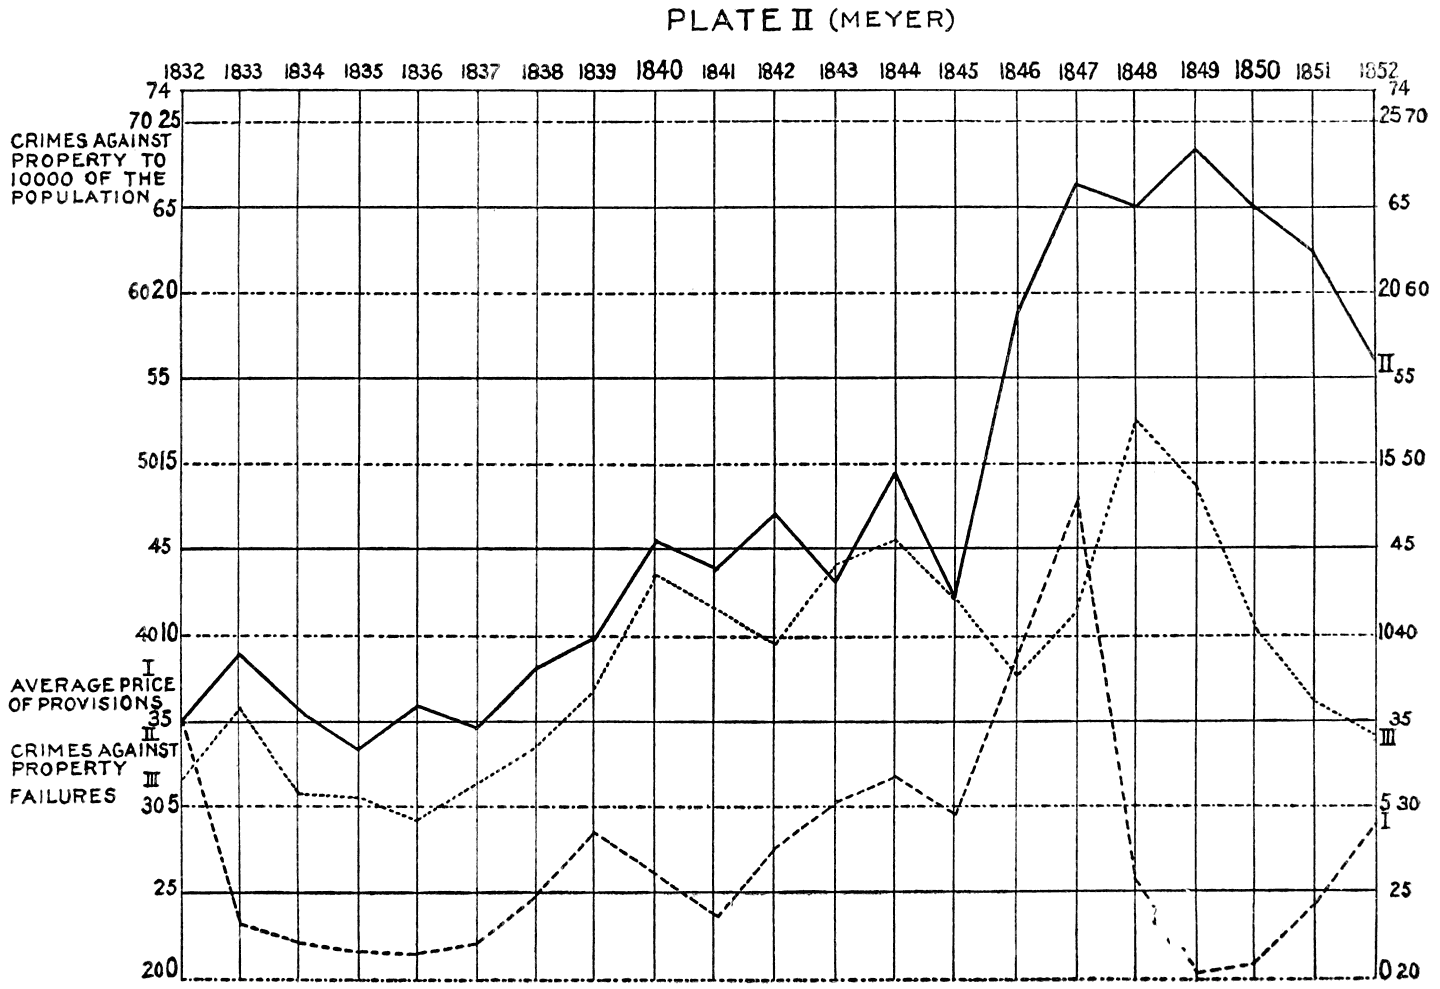
PLATE II (MEYER)
Plate IV gives a comparison of crimes against persons with economic conditions, and shows that these crimes increase when economic conditions improve, and that vintages more or less abundant are not without importance.
On page 44, the author commences his examination of the criminality in the different districts of the canton of Zürich, investigating its distribution, both as to where the crimes are committed, and where the criminals come from.
According to the first distribution the districts of Zürich, of Dielsdorf, and of Horgen have the highest figures; those of Hinweill, of Meilen, and of Pfäffikon the lowest. According to the second distribution it is again the districts of Dielsdorf and of Horgen that have the highest figures, while Hinweill, Meilen, and Pfäffikon take the last place here also. Zürich and Winterthür, which in the first distribution held the first place, in the second have the eighth and tenth. We see from this that, however great the number of crimes the last two districts produce, the authors of the crimes are outsiders.
Dr. Meyer then compares the districts of Hinweill and Pfäffikon, which have the lowest figures, with the districts of Horgen and Dielsdorf, which have the highest. He concludes that the two former districts are the poorest, and the two latter the most well-to-do, a conclusion which he bases upon different facts, among others upon the appropriations which the public charities of the different districts receive from the state. And according to him it follows that in this case the connection between criminality and economic conditions is not direct.
—The expression “abundance” as describing the state in which the proletariat live, is a strange one. A man who is not indigent and has a few sous does not on that account live in abundance. The author adds a quotation from Garofalo to point out how the proletariat spend a great part of their “abundance” in the wine-shops. The reader is, however, referred to Part II of this work, where I have pointed out the social and economic causes of alcoholism.—
Dr. Meyer concludes his work by saying that he does not believe that an improvement of economic conditions will inevitably lead to an increase of crimes against persons, but that the causes of them are rather to be found in frivolity, grossness, and dissipation consequent upon an improvement of conditions.
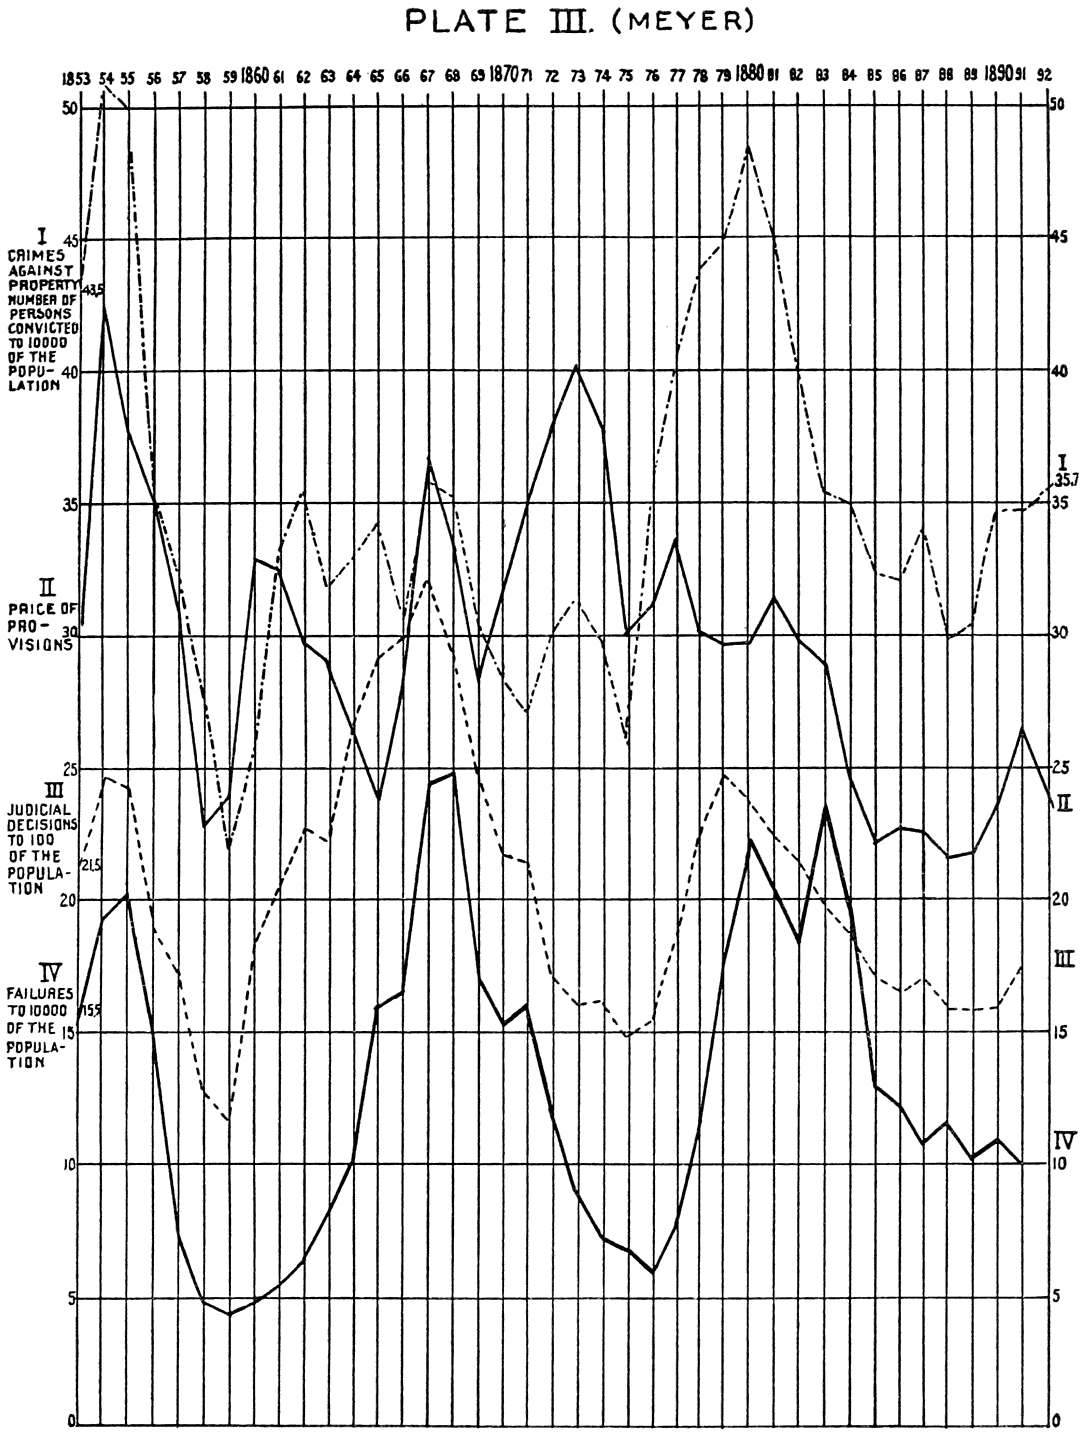
PLATE III. (MEYER)
But—youth does not possess wisdom! It is only by advancing in age that rash, rough youth becomes wise and gentle. Now, in the same way society will lose, one by one, the faults of its youth!
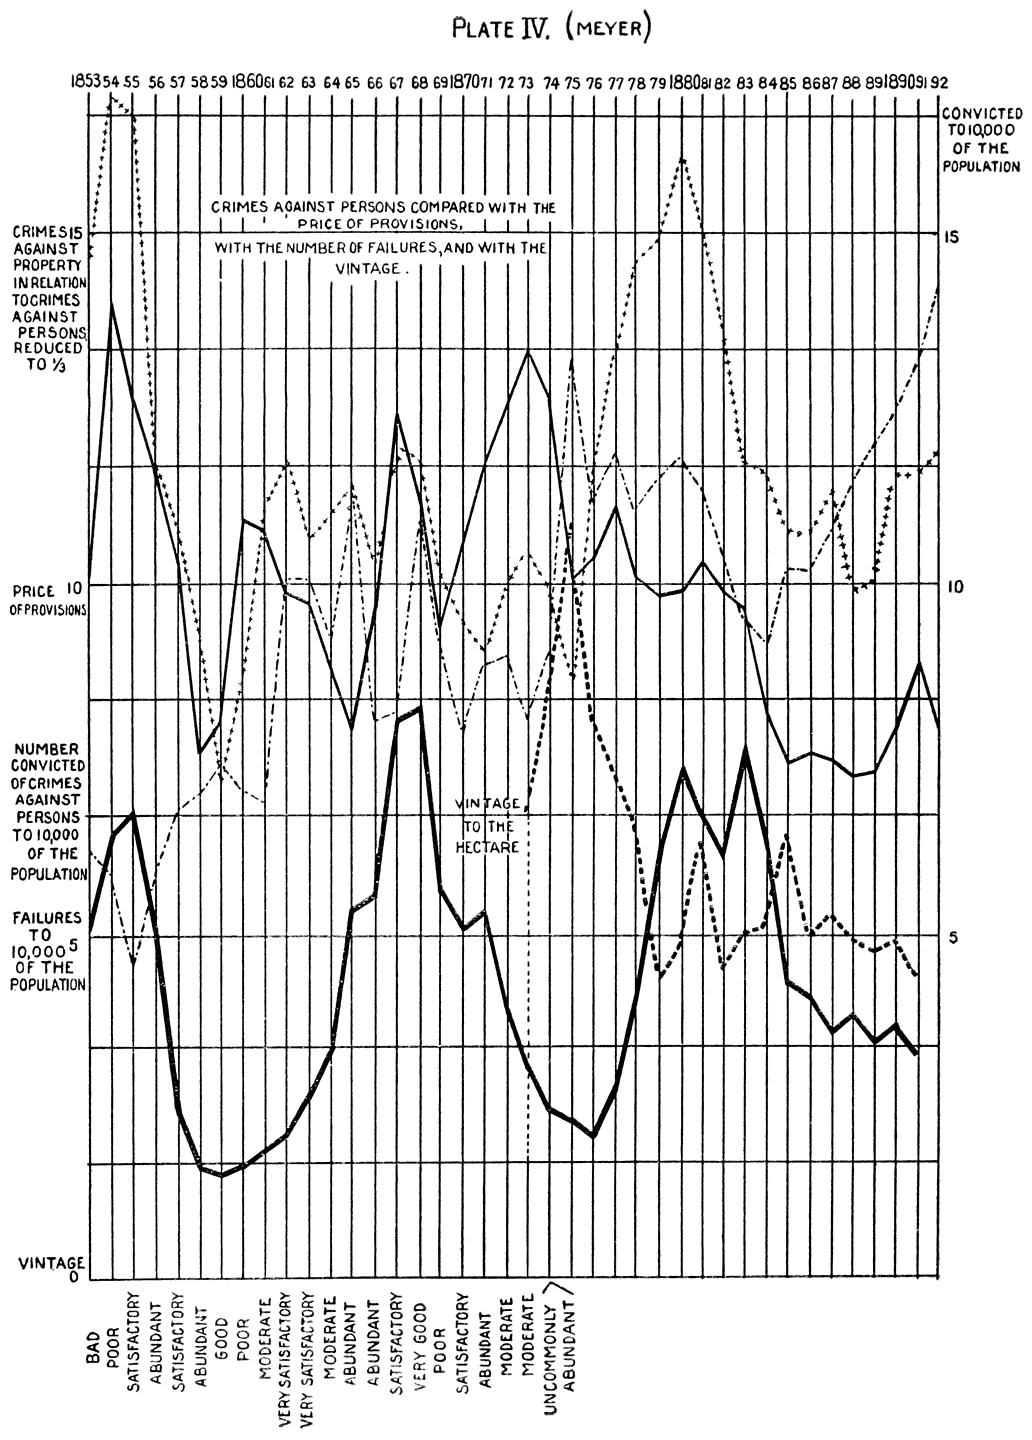
Plate IV. (MEYER)
CRIMES AGAINST PERSONS COMPARED WITH THE PRICE OF PROVISIONS, WITH THE NUMBER OF FAILURES, AND WITH THE VINTAGE.
XV.
M. Tugan-Baranowsky.
Dr. Tugan-Baranowsky has examined the influence that commercial crises have exercised, first, upon the agricultural counties, Cambridge, Essex, Norfolk, Oxford, Lincoln, Suffolk and Wilts (Diagrams 1 and 4); second, upon the industrial counties of Lancaster and Chester (Diagrams 2 and 5); third, upon all England (Diagrams 3 and 6).
Let us study the first three diagrams. The first shows that the commercial crisis of 1825 had a very slight effect upon criminality. It was the high price of grain in 1829 that made crime increase. The same effect was produced by the famous law of 1834 (by which not only was the aid given to poor working people very much limited, but which prescribed the placing in work-houses of those who were without means of support) and by the crisis of 1836. In 1844–1845, years of good harvests, criminality declined, after which the bad crops of 1847 brought about a contrary effect.
We note from Diagrams 2 and 3 that the effect of commercial crises was much greater in the manufacturing than in the agricultural counties (more plainly seen in 2 than in 3). The crisis of 1825 made the curve of criminality rise considerably; the favorable years 1833–1836 made it descend from 1834 on; while the crisis of 1836 caused a considerable increase in the number of crimes in 1837. The bad years 1840–1843 caused a formidable increase in the criminal population, which must also be attributed, at least in part, to the Chartist movement. The favorable period that followed had the contrary effect. It is interesting to compare the curves (in Diagram 3) of exports and crime, which cross continually.
Let us consider now the last three diagrams. Dr. Tugan-Baranowsky attributes the descent of the curve of criminality in Diagram 4 to the improved condition of the agricultural population. Further, the number of crimes was greatly diminished by the alteration in the criminal procedure in 1879, and it goes without saying that this influence must also be taken into account in studying the last two diagrams. By Diagrams 5 and 6 we see that the influence of criminality is much less marked. Thus, for example, the diminution of criminality was not prevented by the crisis at the beginning of the period 1890–1896.
The final conclusion of Dr. Tugan-Baranowsky is this: “The first three diagrams give a picture of the life of the English people in the second quarter of this century [the nineteenth]. We see abrupt periodical changes of important phenomena in the life of the people, which are plainly connected with the changes in the industrial situation. Especially sudden are the variations in the life of the industrial population. Each crisis has a devastating effect upon the ranks of the working-classes, the workhouses are swamped with the unemployed, the prisons fill up as well, mortality mounts enormously, the mass of people out of work readily take up with any political agitation, and the years of crisis are likewise years of revolutionary movements.
“At the same time the manufacturing and commerce of the country increase rapidly. The enormous growth of exportation in England, the curve of which mounts continually, is in sharp contrast with the deterioration of the living-conditions of the working-class.
“The last three diagrams show us an entirely different picture. English exports no longer increase. In place of a steady rise of the curve with a sharp depression in the critical years, there are regular, wave-like variations in the same plane. The industrial development of the country proceeds at a slackening pace.
“And at the same time in the life of the people there are signs to be noticed of increasing well-being. Mortality, criminality, and pauperism fall quickly. Crises no longer have their former influence upon the condition of the people. Even in manufacturing districts business stagnation no longer has its former disastrous effect upon the working-class; crime and the death-rate no longer increase, and even the increase in the number of paupers is hardly noticeable. Organized labor supports even the unemployed. Wages are only a little lower in years of industrial depression than they are in a time of prosperity!”
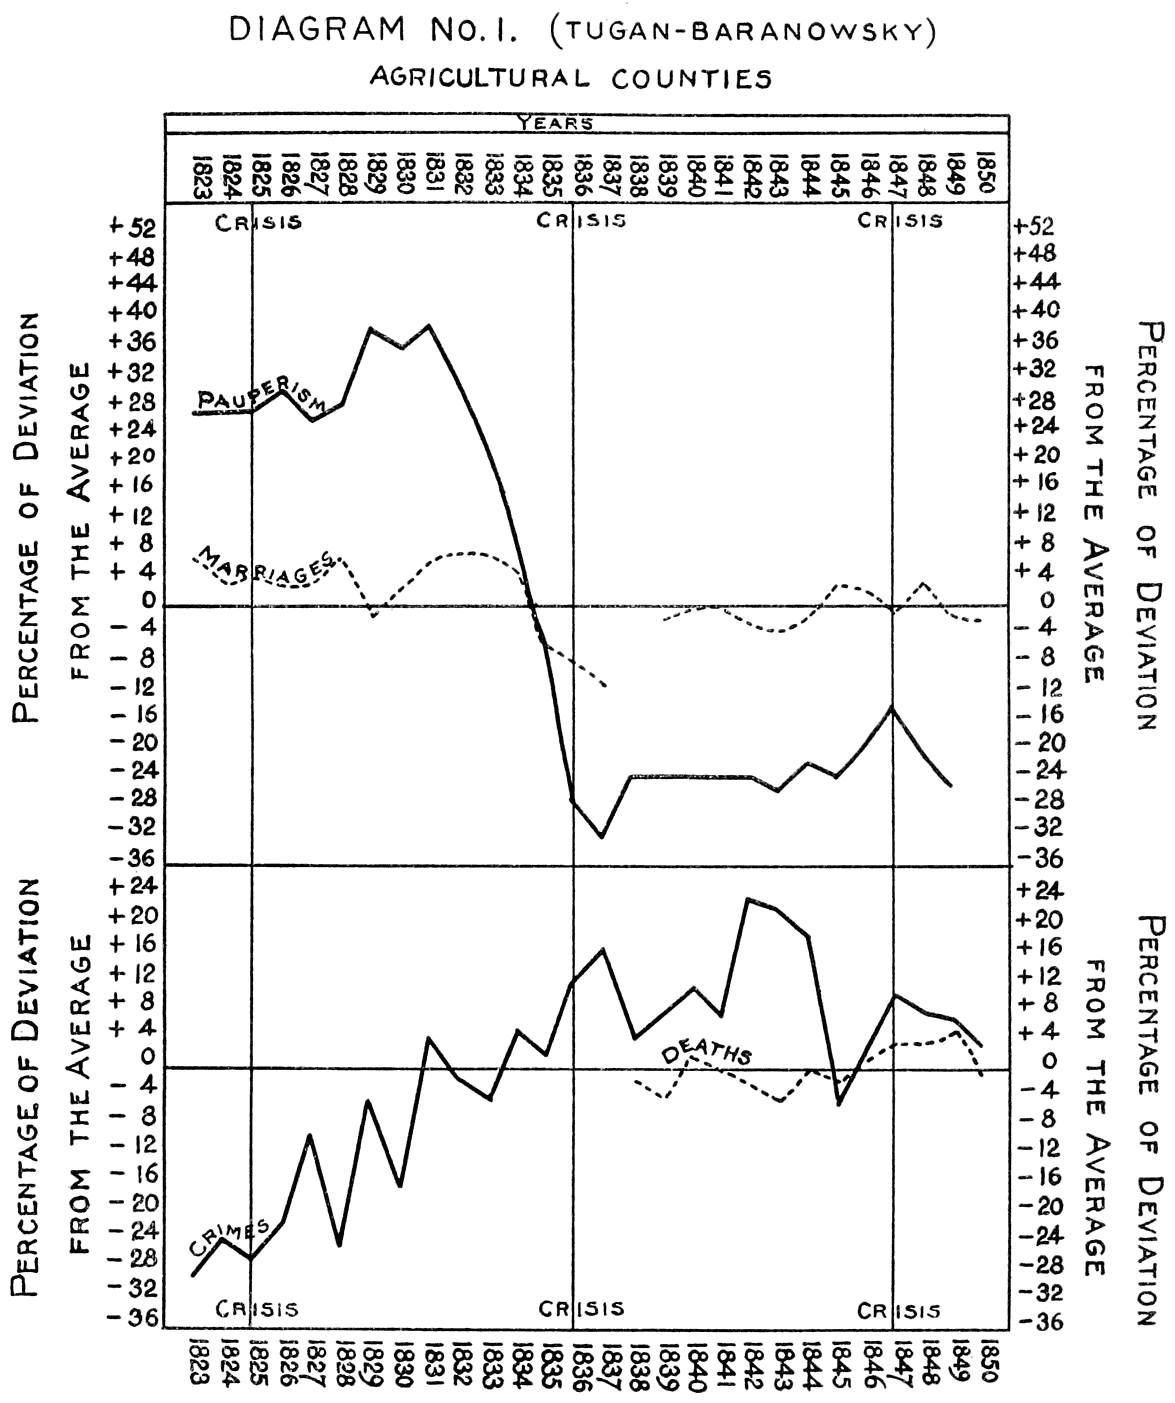
DIAGRAM No. 1. (TUGAN-BARANOWSKY)
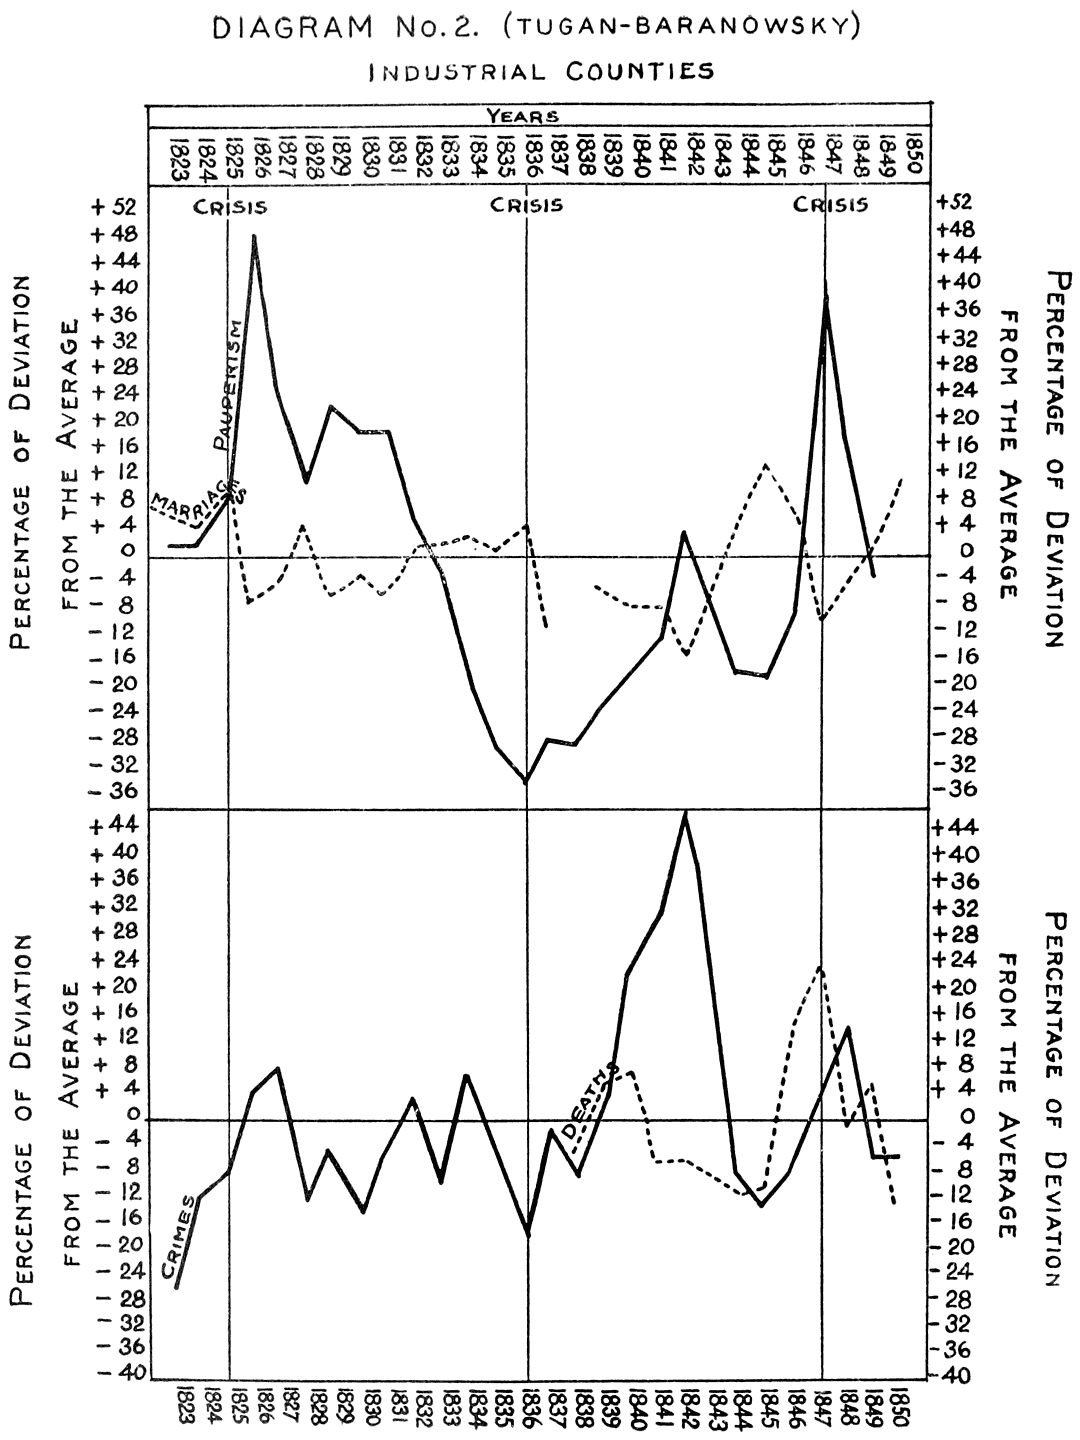
DIAGRAM No. 2. (TUGAN-BARANOWSKY)
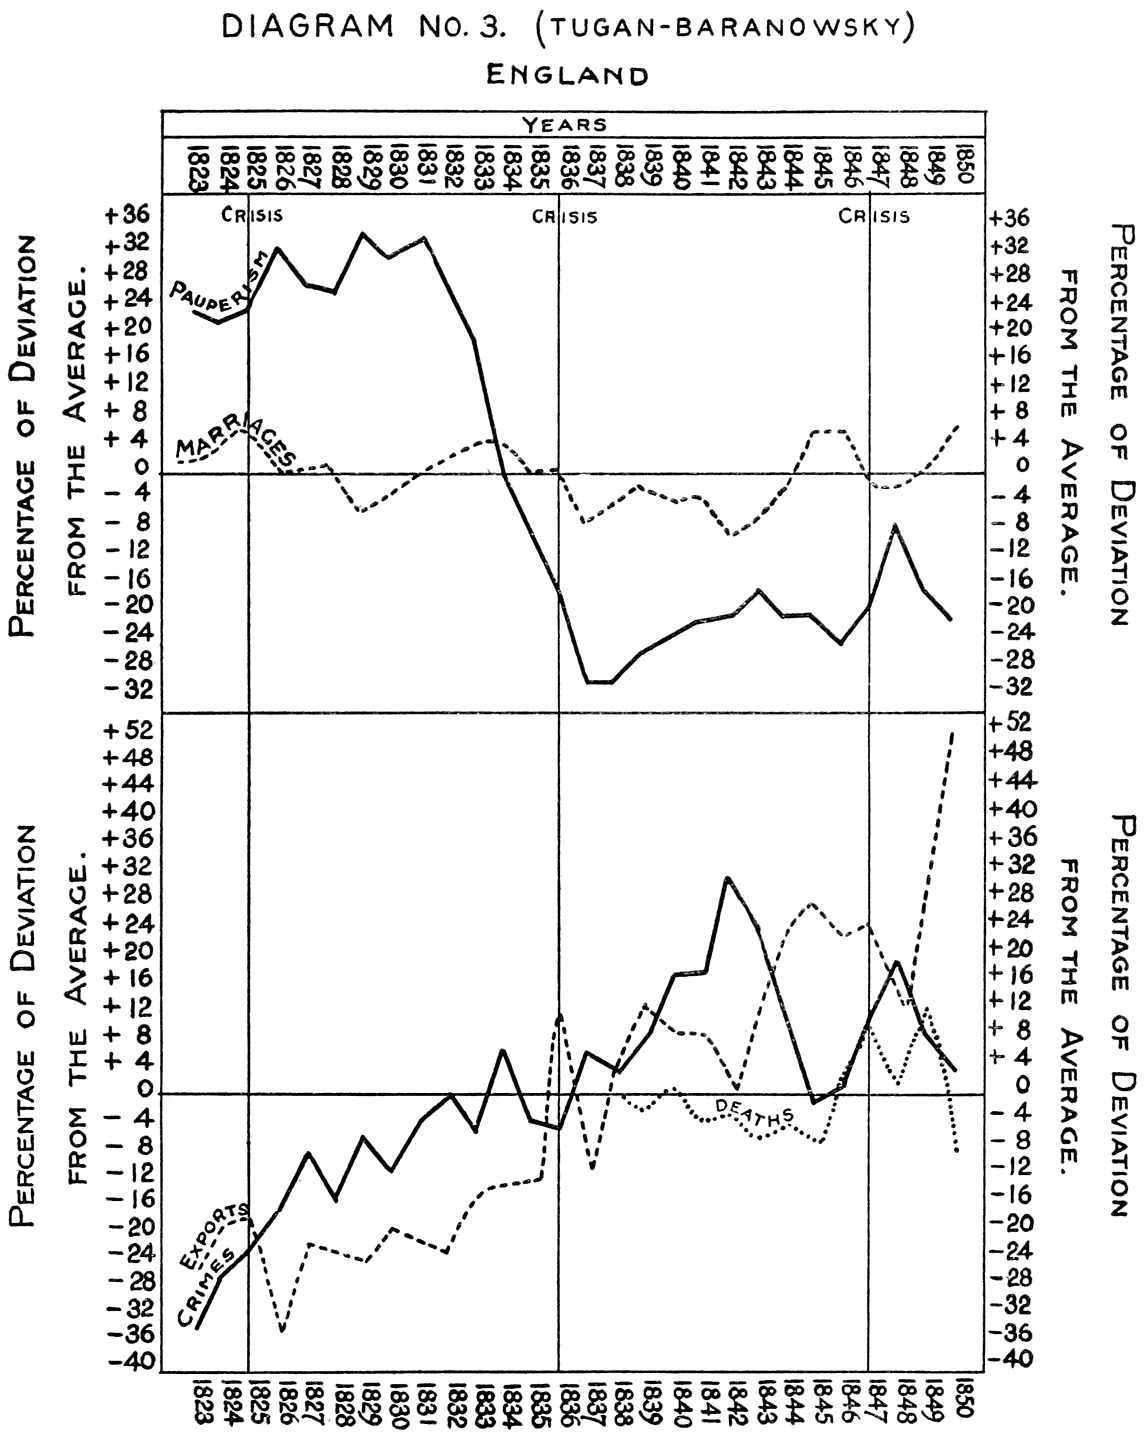
DIAGRAM No. 3. (TUGAN-BARANOWSKY)
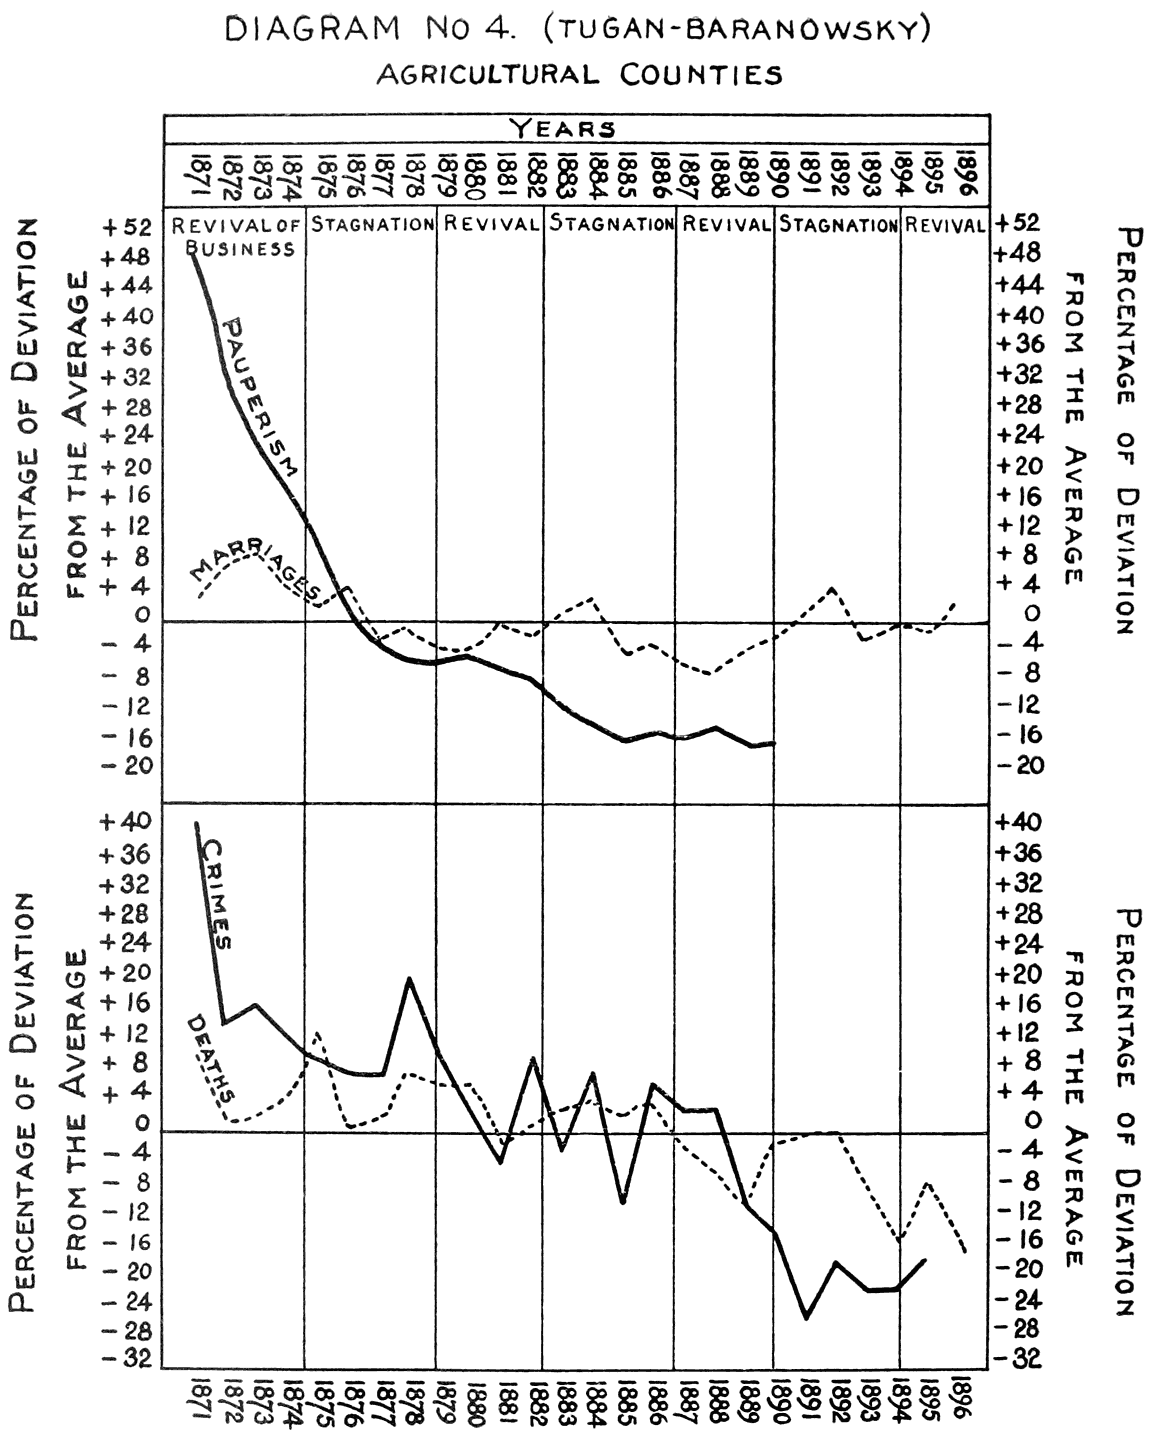
DIAGRAM No. 4. (TUGAN-BARANOWSKY)
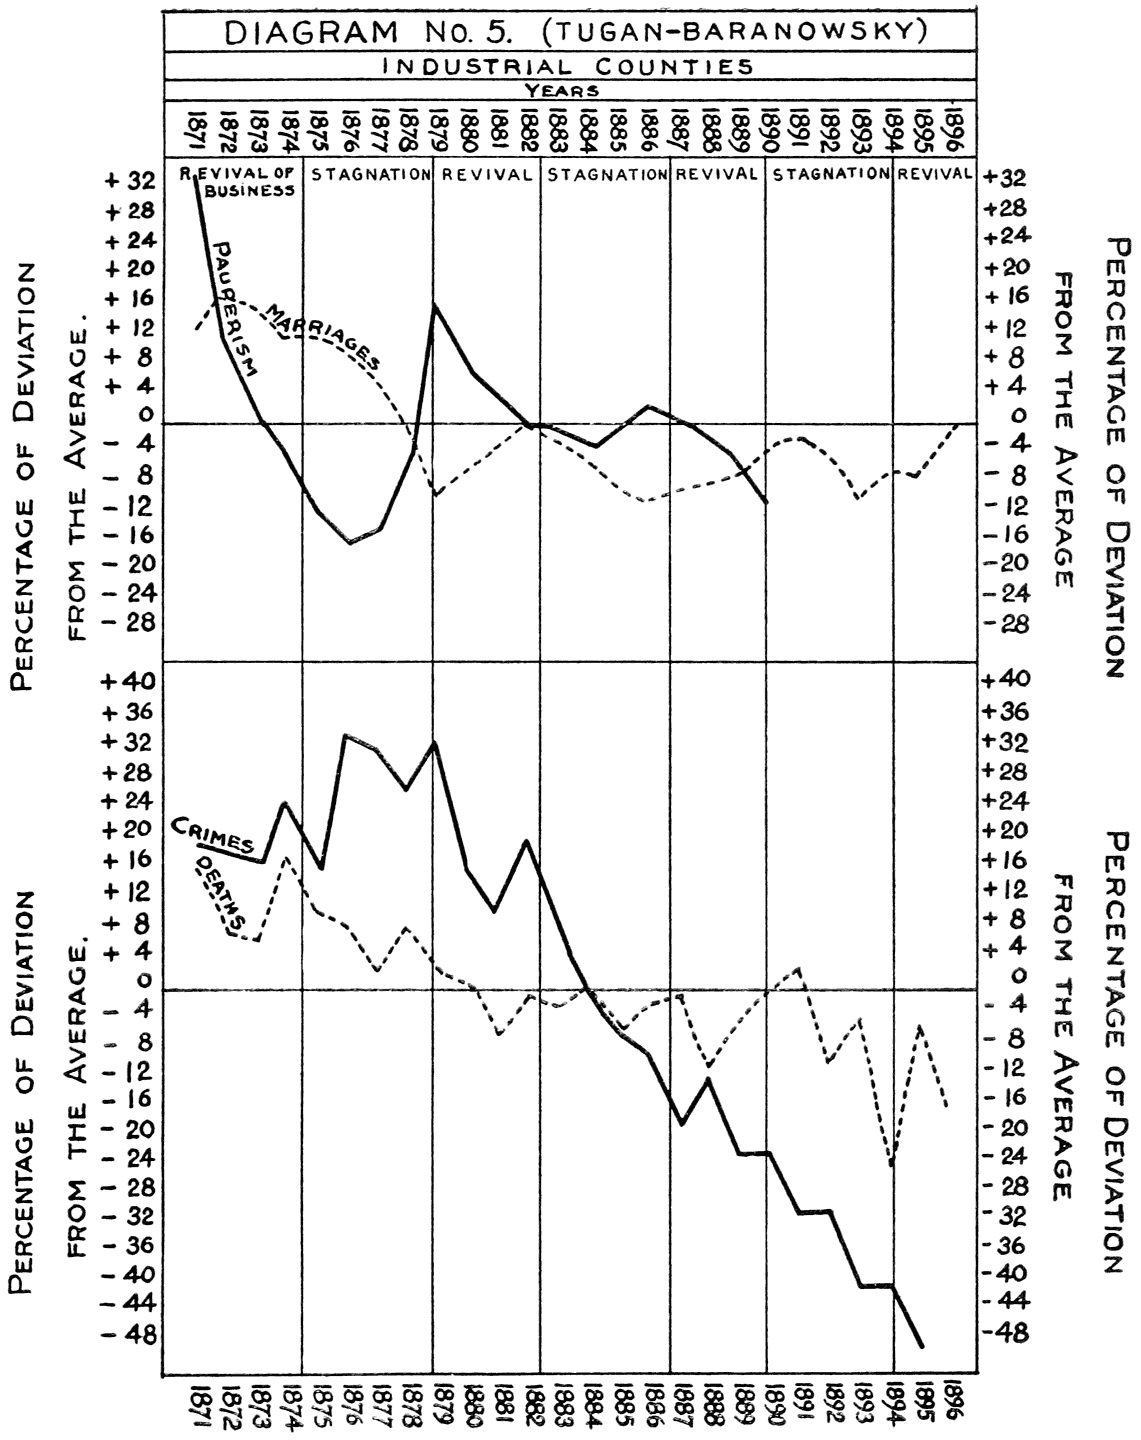
DIAGRAM No. 5. (TUGAN-BARANOWSKY)
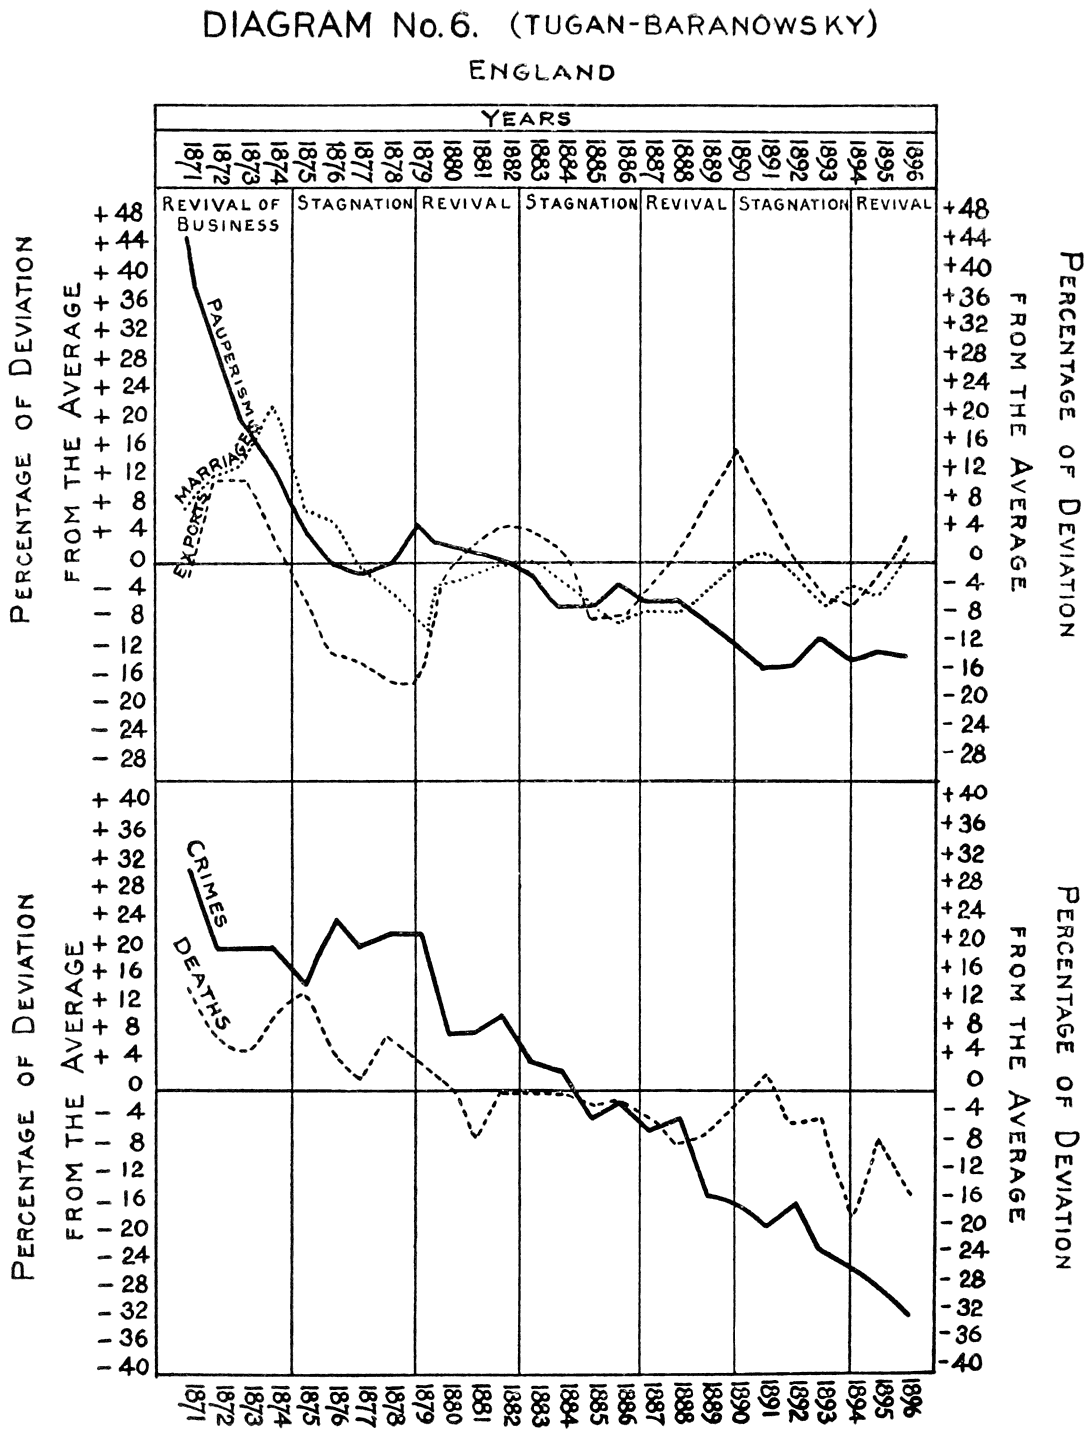
DIAGRAM No. 6. (TUGAN-BARANOWSKY)
At the end of his study the author gives the following table, which contains some data upon the relation between the price of grain and abundance of the crops, on the one hand, and criminality on the other. The figures in the second column have to do with the different kinds of theft. The law of May 18th, 1882, having considerably modified the penal code, the figures for the years 1882 and 1883 cannot be compared with those of preceding years. This is why they have been suppressed.
Years. New Cases to 100,000 of the Population. Price of a “Pud” of Rye in Kopecks. Ratio of Cereal Crop to Average of 25 Years (= 100).
1874 76 75 105
1875 77 73 90
1876 78 76 95
1877 86 80 103
1878 95 76 106
1879 90 86 93
1880 104 99 87
1881 103 129 105
average 1874–81 89 87 —
1884 45 90 108
1885 46 77 90
1886 44 74 100
1887 45 67 114
1888 43 65 108
1889 43 70 83
1890 46 68 97
1891 52 129 73
1892 52 89 87
1893 50 61 104
1894 50 50 121
average 1884–94 47 76 —
According to the author it may be doubted whether the years of poor harvests could cause an increase in the number of thefts in Russia. For the agricultural population is benefited by the high price of grain. However, it is proved by the figures given above that these years have an unfavorable effect upon criminality, which can be understood if we take into account the fact that most of the Russian peasants only raise grain for their own consumption, and that bad crops accordingly affect them seriously.
XVII.
H. Müller.
The period examined (1854–1895) is divided into two parts, because the criminal statistics of the empire, which are to be had from 1882 on, give the number of crimes and criminals, while the Prussian statistics give the number of new cases brought before the examining magistrate.
The figures for these years are as follows:
Prussia, 1854–1878. New Cases to 100,000 of the Population.
Years. Against Property. Against Persons. Against the State, Public Order, and Religion.
1854 416 78 —
1855 436 78 41
1856 472 81 47
1857 324 95 55
1858 288 103 54
1859 295 103 51
1860 310 102 56
1861 314 93 52
1862 313 105 54
1863 288 111 53
1864 290 115 56
1865 325 121 58
1866 314 109 55
1867 360 112 51
1868 392 117 52
1869 338 126 53
1870 296 99 46
1871 254 75 41
1872 281 94 56
1873 266 106 64
1874 295 125 81
1875 284 135 84
1876 315 142 89
1877 341 160 87
1878 370 164 103
Prussia, 1882–1895. Persons Convicted to 100,000 Inhabitants over 12 Years.
Years. Against Property. Against Persons. Against the State, Public Order, and Religion.
1882 545 328 180
1883 520 343 174
1884 527 382 188
1885 492 385 185
1886 488 402 196
1887 475 421 203
1888 466 404 200
1889 503 423 197
1890 496 449 199
1891 520 443 190
1892 575 458 199
1882–91 510 404 194
1894 528 527 219
Let us study in the first place crimes and misdemeanors against property:
I. Offenses, against Property.
Prussia, 1854–1878. New Cases to 100,000 of the Population.
Years. Theft. Embezzlement. Robbery and Blackmail. Receiving Stolen Goods, Etc. Perjury, Etc. Forgery. Malicious Mischief.
1854 334 28 1.0 40 17 5.4 10
1855 354 29 1.1 34 16 5.7 8
1856 386 31 1.1 43 17 6.0 8
1857 246 23 1.0 38 15 7.0 10
1858 213 22 0.8 30 12 7.3 11
1859 219 22 0.8 25 12 7.5 12
1860 229 24 0.8 30 13 7.7 12
1861 232 24 0.8 26 13 8.1 12
1862 229 24 0.9 25 13 8.2 14
1863 206 23 0.8 21 14 7.5 15
1864 206 24 1.0 25 13 7.4 17
1865 227 24 0.8 25 14 7.6 17
1866 222 23 0.8 24 14 7.2 17
1867 265 25 0.9 32 15 8.1 17
1868 293 27 1.2 36 16 8.0 17
1869 241 25 1.0 30 15 7.1 18
1870 211 22 0.9 27 14 6.4 17
1871 190 18 0.8 33 10 3.2 14
1872 209 20 1.4 46 11 3.4 17
1873 196 19 1.4 46 11 3.5 18
1874 216 22 1.7 50 13 3.7 19
1875 209 23 1.7 49 13 4.2 19
1876 223 25 1.9 50 16 4.9 21
1877 238 28 2.4 51 18 5.5 22
1878 257 30 2.4 55 20 5.6 24
Prussia, 1882–1896. Persons Convicted to 100,000 Inhabitants over 12 Years.
Years. Theft. Embezzlement. Robbery and Blackmail. Receiving Stolen Goods, Etc. Perjury, Etc. Forgery. Malicious Mischief.
1882 337 44 1.5 30 29 8.0 38
1883 323 42 1.4 27 29 7.7 37
1884 322 44 1.7 27 31 8.4 41
1885 289 44 1.4 25 30 8.0 41
1886 282 43 1.5 24 32 8.3 41
1887 267 42 1.4 24 35 8.6 43
1888 262 43 1.2 23 36 8.6 38
1889 289 46 1.4 25 41 10.0 40
1890 278 46 1.5 25 41 10.0 42
1891 292 47 1.6 25 44 10.9 41
1892 329 52 1.6 30 48 11.7 42
1893 298 45 1.5 26 36 9.0 41
1894 276 51 1.4 25 51 12.9 47
1895 271 53 — 24 52 13.2 —
1896 259 50 — 22 50 12.8 —
The following table gives the prices of certain important foods (per 50 Kilogr.):
Years. Wheat. Rye. Potatoes.
1848 7.49 4.82 1.84
1849 7.29 3.87 1.45
1850 6.91 4.55 1.55
1851 7.47 6.26 2.08
1852 8.59 7.72 2.48
1853 10.25 8.50 2.47
1854 12.90 10.40 3.17
1855 14.21 11.45 3.37
1856 13.51 10.64 3.13
1857 10.18 6.87 2.18
1858 9.08 6.38 1.91
1859 8.93 6.79 1.98
1860 10.48 7.65 2.41
1861 11.04 7.71 2.79
1862 10.68 7.79 2.47
1863 9.18 6.78 2.04
1864 7.95 5.69 2.10
1865 8.13 6.24 2.03
1866 9.80 7.30 2.05
1867 12.89 9.87 2.95
1868 12.48 9.84 2.62
1869 9.70 8.08 2.16
1870 10.14 7.78 2.58
1871 11.70 8.60 3.05
1872 12.10 8.40 2.95
1873 13.20 9.60 3.00
1874 12.00 9.90 3.35
1875 9.80 8.60 2.75
1876 10.50 8.70 2.82
1877 11.50 8.85 3.18
1878 10.10 7.15 2.82
1879 9.80 7.20 3.08
1880 10.95 9.65 3.25
1881 11.00 10.10 2.85
A comparison of these figures with those of crime will show that the crimes against property increase in the years of high prices up to 1855. In 1857 prices fell and crime decreased.
In the figures for foreign countries we see this relation much less clearly. Dr. Weisz has indeed succeeded in establishing a similar relation in France, but in Belgium it is much slighter. In England it is not possible to show that there is any parallelism between the curves of criminality and of the price of grain. In the years 1831–1840 and 1841–1850 the curve of crime even goes down, while provisions were then very dear. There must therefore be some other cause, and this is probably that England had a great industrial development long before any other country.
After an extremely rapid development up to 1847, manufacturing had to pass through a formidable crisis. While the average annual number of persons convicted in England and Wales was 20,455, and this figure fell to 18,100 and 17,400 in the prosperous years, 1845–1846, it rose during the years of crisis, 1847–1848, to 21,500 and 22,900, falling again to 21,000 in 1849, when business had resumed its normal course.
In the years following, industry received an enormous impetus, in consequence of the discovery of gold in California, the repeal of the Corn Laws, and many other causes. In 1857 came the panic, which affected all industrial countries, especially England. In 1856–1860 there was an annual average of 13,565 convictions; in 1857 it was 15,307, an increase of 12%. That the consequences of this crisis are not to be observed in the figures for crime in Prussia, is to be attributed to the fact that in that country manufacturing was little developed.
After the very dear years 1852–1856 the price of grain remained fairly constant in Prussia. It was only in 1860–1862 that it rose a little and caused an increase in the cases of fraud and theft. 1867–1868 were years which were marked by an extraordinarily high price for grain, which had some influence upon crime, without equalling that of such years as 1852–1856.
Crime decreased in the years of war, 1866 and 1870–1871, due as Dr. Müller thinks, to two facts; first, that a great part of the population capable of committing crimes were then out of the country; and second, that the feeling of solidarity is stronger in time of war.
Notwithstanding the rise in the price of grain in 1871–1874, crime decreased greatly after the war of 1870. A modification of the penal law could not be the cause of it; its origin was deeper. Since 1871 Germany has seen its industries develop prodigiously. The period of prosperity was of short duration, for in the summer of 1873 came the crisis, which lasted till 1878. Now it is during these years that the crimes against property were much increased.
In 1889 there was another great disturbance in the economic field, which was prolonged till 1892. During these years there was a new increase of crime; in Austria, for example, the average number of convictions was 29,483 in 1890–1894, as against 28,834 for the five years preceding. In England we see the same phenomenon, and in Prussia as well.
Dr. Müller calls attention to the marked fall in the price of grain in 1892, and sees in it a proof that prices have no longer any great influence. Since 1892 there has been a new period of prosperity, and at the same time a constant diminution of crimes against property.
Dr. Müller reminds us that preceding moralistic statisticians have brought out the fact that crimes against persons increase when the price of grain falls, and vice versa, as is distinctly seen in the tables for the years 1854–1860. But there is a change during the ten years following. In 1867–1868 the price of grain was high, but crimes against persons and the public order rose also. Crimes against persons decreased in the years of war, 1866 and 1870, just as crimes against property did. Since 1871 crimes against persons have in general diminished, principally because of favorable economic conditions. (The diminution of crimes against morals is chiefly due to a modification of the law, which prescribed that a case could not be prosecuted except upon complaint. The increase after 1876 was caused by a revocation of this requirement.) The crimes in question increased anew considerably after the crisis of 1874. Here is an important exception, then, to the rule that the earlier statisticians laid down, namely that crimes against persons decrease when economic conditions grow worse.
II. Crimes against Persons.
a. 1854–1878. New Cases to 100,000 Inhabitants.
Years. Offenses against Morals. Insult. Murder and Homicide. Assault in General. Bodily Injuries Punished as Crime. Offenses against Personal Liberty.
1854 8.7 32 1.1 34 6.7 0.9
1855 10.2 32 0.9 32 4.5 0.7
1856 10.8 34 0.9 37 3.0 0.8
1857 12.6 36 0.9 42 1.8 1.0
1858 12.5 40 0.8 46 1.8 1.1
1859 13.1 39 0.8 47 1.8 1.0
1860 12.4 40 0.9 46 1.5 0.8
1861 11.6 33 0.7 44 1.7 1.0
1862 12.9 39 0.8 49 1.4 1.4
1863 14.2 40 0.7 53 1.6 1.2
1864 14.0 43 0.9 54 1.6 1.4
1865 14.9 44 0.8 58 1.7 1.3
1866 13.4 40 0.8 50 1.5 1.3
1867 14.0 44 0.9 50 1.6 1.0
1868 14.8 47 0.9 52 2.8 1.0
1869 14.9 45 1.0 58 2.8 1.3
1870 12.3 39 0.8 49 1.9 1.1
1871 5.3 26 0.7 39 1.2 1.2
1872 6.2 34 0.8 50 2.0 1.8
1873 6.7 38 0.9 56 2.4 2.8
1874 7.8 47 1.1 64 3.0 3.3
1875 8.2 50 1.2 65 2.9 3.6
1876 9.3 51 1.2 73 5.5 4.1
1877 11.1 54 1.3 86 5.0 4.7
1878 12.3 54 1.4 89 2.5 5.5
b. 1882–1895. Persons Convicted to 100,000 Inhabitants over 12 Years.
Years. Offenses against Morals. Insult. Murder and Homicide. Assault in General. Bodily Injuries Punished as Crime. Offenses against Personal Liberty.
1882 7.8 117 1.0 60 111 10
1883 7.6 119 1.0 63 121 11
1884 7.6 127 0.8 68 142 15
1885 7.6 119 0.9 65 151 17
1886 8.9 124 0.8 68 153 19
1887 8.8 133 0.8 68 163 19
1888 9.1 130 0.6 64 156 18
1889 8.4 131 0.6 68 166 21
1890 8.8 138 0.6 74 175 23
1891 8.5 133 0.6 74 173 24
1892 9.0 137 0.9 76 177 26
1882–91 8.3 129 0.8 68 153 18
1894 10.5 156 0.7 87 208 29
1895 10.9 161 0.7 — 220 —
1896 11.1 158 0.6 — 220 —
Here also economic conditions are causes of crime, and show themselves principally in resistance to officials, etc. The tables show also an increase in the cases of perjury, bodily injuries, and other crimes that are the consequences of grossness. The increase is due, according to Dr. Müller, to bad economic conditions. For as a consequence of these the number of civil cases rose from 60,000 (the average for 1871–1873) to 120,000 and 135,000 (1876–1877) and it is by these cases that perjury becomes possible. It is necessary to attribute to the same causes the great increase in the number of cases of crimes against personal liberty (also, since 1876, to the abolition of the requirement of a complaint for prosecution).
III. Crimes against the Public Order.
a. 1854–1878. New Cases.
Years. Rebellion. Offenses against Public Order. Perjury. Counterfeiting. Leze-majesty.
1854 18.6 — 3.0 0.83 0.63
1855 18.2 16.7 2.6 0.64 0.71
1856 18.0 23.2 2.7 0.71 0.40
1857 19.5 29.8 2.9 0.49 0.34
1858 19.7 28.7 2.7 0.50 0.53
1859 18.6 26.9 2.9 0.48 0.68
1860 19.7 30.2 3.0 0.39 0.51
1861 17.2 29.6 3.0 0.42 0.38
1862 19.9 29.0 3.0 0.50 0.47
1863 20.8 26.9 3.2 0.38 1.16
1864 23.1 26.6 3.2 0.40 1.00
1865 23.8 28.1 3.4 0.28 0.64
1866 23.4 24.2 3.1 0.39 1.94
1867 23.1 21.0 3.0 0.49 0.91
1868 22.5 22.8 3.4 0.57 0.54
1869 23.5 23.6 3.6 0.48 0.38
1870 19.0 21.7 3.1 0.36 0.66
1871 19.4 17.9 2.4 0.45 0.96
1872 23.6 26.4 3.2 0.38 0.67
1873 24.7 31.8 3.2 0.41 0.73
1874 28.6 43.7 3.7 0.45 1.23
1875 32.2 41.3 3.8 0.87 1.26
1876 32.7 47.0 4.2 1.21 0.86
1877 33.8 43.4 4.8 1.45 0.93
1878 33.7 49.6 5.5 2.24 9.93
b. 1882–1896. Persons Convicted.
Years. Violence to Officials. Violation of Domicile. Perjury. Embezzlement in Military Service.
1882 40 56 3.1 49
1883 39 52 2.7 54
1884 42 60 3.0 55
1885 40 57 3.0 57
1886 42 61 2.5 61
1887 43 58 8.8 66
1888 39 53 8.5 72
1889 39 58 8.6 61
1890 40 59 8.7 61
1891 40 57 8.5 56
1892 41 59 8.5 58
1882–91 41 58 8.8 60
1894 47 62 8.3 51
1895 47 65 — —
1896 47 63 — —
XVIII.
Criticism.
The authors treated of in this chapter, and many others whom I have had to put under other headings as belonging to some special school, all have this point in common, that they try to find the causes of crime by means of statistics. The first question that arises is this: do criminal statistics give a real and complete picture of criminality? The answer is categorically, No. To give only a few reasons, there are a great many crimes, naturally insignificant, which remain unknown even to the person injured; there are others of which justice never takes cognizance, because the injured party has filed no complaint, either because he has pardoned the offender, or fears the trouble of a criminal trial, etc.
The enemies of statistics have drawn from the preceding fact the conclusion that criminal statistics are useless for the study of the etiology of crime. This is an absolutely false conclusion, as false as it would be to claim that doctors cannot find the cause of a disease, because besides the thousands of cases known to them, there are at least as many that remain unknown. The only question that arises is the following: is the number known sufficient? is there a sufficiently large body of facts in hand for inductive studies? As far as criminality is concerned the answer can be perfectly positive. The number of offenses that do not appear in the criminal statistics is certainly large; they are, however, chiefly insignificant misdemeanors, such as insults, trifling assaults, petty thefts, etc. These would have little value in determining the etiology of crime, even if the statistics included them all. Serious crimes, on the other hand, in the majority of cases, without any doubt appear in the statistics. The great reason why criminal statistics suffice for etiological investigations is that the ratio of known crime to unknown remains relatively constant. The proofs of this are to be found in the criminal and judicial statistics themselves. The ratio between cases dismissed and those prosecuted, between convictions and acquittals, etc., etc., remains practically the same from one year to another. Further, every statistician of any experience is convinced that the law of averages rules more absolutely than any despot.
The statistical method certainly contains many sources of error. It goes without saying that this is not a reason for not using it at all, but simply for being careful. We must guard against conclusions too hastily drawn. If statistics show less criminality among the Jews—as is generally the case—it is not safe to say, therefore, that the innate morality of the Jew is greater than that of other men. If crime increases during a certain period together with irreligion, we have no right to conclude that there is a causal connection between the two. The connection between the movement of the price of grain and that of crimes against property has been proved many times, as we have seen; if this parallelism of the two curves no longer occurs, we cannot say on that account that economic conditions no longer play a part in the etiology of these crimes; we have seen that in manufacturing countries the industrial situation in general dominates the course of economic criminality. Similar examples could easily be multiplied.
The statistical method is one of the most effective for discovering the etiology of crime, and my readers will see that I use it much of the time. Nevertheless, it must not be forgotten that this method, however important, is only one among several. It is chiefly valuable in finding the direct causes of crime; as to indirect causes it gives us much less information. I would call attention to the following example: several authors have proved that there is an inverse connection between economic conditions and crimes against persons, i.e. that these crimes increase in times of prosperity (this does not apply to recent times, however). The conclusion has often been drawn from these facts that an improvement in the lot of the working-class would lead, as a law of nature, to an increase in crimes of violence. This is a typical example of the insufficiency of the statistical method alone. When we seek for the cause of this phenomenon in another way, in the structure of society, we discover that it is to be found in the low moral and intellectual condition of the working-classes. There can be no law of nature at the root of the matter, else the well-to-do classes would be the violent criminals “par excellence.” It goes without saying that just the contrary is the case.
To sum up, I conclude that statistics furnish a powerful means of discovering the causes of crime, provided they are used critically and carefully. The statistical method is not the only one; to be a good criminologist, it is necessary to be a statistician, but it is necessary to be a sociologist also.
[Note to the American Edition: Upon the relation between sociology and statistics see also Žižek, “Soziologie und Statistik.”
In recent years there has been a violent controversy over the statistical method. It was opened by Hoegel in his “Die Grenzen der Kriminalstatistik” and “Kriminalstatistik und Kriminalaetiologie”; then came Wassermann with his “Begriff und Grenzen der Kriminalstatistik”, and “Georg v. Mayr als Kriminalstatistiker und Kriminalsoziologe und die moderne Methodenlehre”, which goes farther and denies almost all value to the statistical method. On the other side, we find v. Mayr in his “Statistik und Gesellschaftslehre”, II, p. 441, “Forschungsgebiet und Forschungsziel der Kriminalstatistik”, “Kriminalstatistik und Kriminalaetiologie”, and Wadler in his “Erkenntnistheorie und Kriminalstatistik.”]