Part 2 — NOTES ON OBSERVATIONAL MATERIAL
Reading edition
NOTES TO TABLE XIX
Atom Note Max. Blends Remarks
H 1 .. No measures available across the whole range of these lines. They are blended with He+ in the types. For a discussion of the maximum of these lines, see p. 166
2 ..
3 ..
4 ..
He 1,2,3, 4 5,6,7,8 .. Maximum well determined. Unblended
4 He+ See Note 12
9,10,11,12 Probably blended. See H. C. 263, 1924
C 1 .. Unblended
Mg 1 ? .. Effectively unblended. Material very meager
2 .. Unblended
3 none ; ; Cr probably predominates
4 -, ; Fe predominates at lower temperature; Mg probably responsible for maximum
Al 1 none ..
2 none ..
Si 1 -2; -1; ; -2; -1 Si predominates, and is responsible for maximum
2
34,5 ..
6 ..
7 N++
8
Ca 1 ; ; Ca probably responsible for rise at
2 Ca, ; ; Mn, ; ; Ca probably predominates. Enhanced line suspected near
3 ; ; Calcium predominates. Enhanced line suspected near
4 none ; In band
5 none ; ; -2; ; -2 Maximum undetermined. In band
6 ; -2; ; -1; Ti, Fe 4 Fe probably responsible for maximum
7 ? ; ; ; ; Ti; Chromium (ultimate) line probably obliterates the Ca line. Maximum at due to Ca?
8 ;
9 none Unblended
10 ? Hydrogen predominates before
11 ? Unblended
Sc 1 Y? ; Sc predominates, at least at maximum
2 ; -2 Sc predominates
Ti 1 ; V, Blended with Ti+. See Note 10
2 (none) ; ; ; -2; -2 Ca causes rise at . Ti obliterated
3 Ti+ causes rise at . Rise at unexplained
4 ; ; Ti,
5 () ; ; Cr 5; ; ; Ca and Cr cause rise at . Ti obliterated
6 (none) ; Cr (ultimate) line predominates
7 none ; ; ; Possibly an enhanced line accounts for maximum near ?
8 (?) ; Mg accounts for maximum at
9 (?) Unblended
10 (?) Ti, -5 Probably unblended
11 ; Maximum at due to Fe
12 ? ; V, Blended with Ti. See Note 1
13 ? ; ; Fe predominates. Maximum uncertain
14 ; Rise at due to Fe. In band
15 ; Rowland gives no Ti. Other lines account for later maximum. In band
16 ? ; ; Maximum undetermined. In band
17 Unblended
18 (?) ; ; Cr accounts for strength in
V 1 ; V, Ti and Ti+ lines blended. V probably obliterated
2 none Unblended
3 none Ti, ; V probably effective at low temperatures, as these are the ultimate lines
4 none N;
Cr 1 Unblended
2 none Nd? ; Unblended
3 none ; ; ; Cr probably predominates
4 none ; Cr ? Cr predominates
5 none Unblended
Mn 1 none Unblended
2 none ; Fe predominates?
3 none ; ; Zr, -1
4 none ; Mn ? Mn predominates
5 none Mn-Fe ?
6 none Fe-Mn ?
7 Fe, ; ; Mn predominates?
8 Fe-Mn 6
9 ; Co, ; ; V, Ca ?
Fe 1 Mn-Fe Effectively unblended
2 () , No. 2 the weaker line, Mn+ affects the line at and before , producing maximum at . See No. 27
3 none Fe-Mn, 3 ? Effectively unblended
4 none Sc, Fe? 3; ; V, Y+ accounts for maximum at
5 - Sr+ Due entirely to Sr+
6 ? ; ; -3 Maximum at due to Fe+
7 Unblended
8 Unblended
9 () ; ; Ti+ () causes maximum at ; possibly Cr () causes rise at
10 () ; ; Ti predominates?
11 ; ; Ti, Fe probably predominates
12 none ; Ca produces rise in late classes?
13 Unblended. Rise at unexplained
14 Fe ? Unblended. Rise at unexplained, unless due to second Fe line
15 ; Rise at unexplained. See No. 25
16 ;
17 ; -3 Maximum at due to unknown line?
18 ;
19 ;
20 ; ; Fe predominates
21 ; ? 3; ; -1, 1, 1
22 ; Ti, ; Rise at due to Ca?
23 ; No. 23 the weaker line
24 ; ; No. 24 the strongest line
25 See No. 15. Rise at unexplained
26 ? ;
27 ; The stronger line. Responsible also for the maximum of line 2
28 ; ; ; ; Rise at due to V
29 none ; ; Cr and Mn predominate. Cr (ultimate) line responsible for rise at
30 ; Maximum at due to Fe+
31 ; Ca produces rise at
32 ; ; Rise at unexplained
33 Sr+ Due entirely to Sr+
34 - ; Fe? 3; V-Fe?;
35 ? ; Fe, -3; ; ; -, 1; Fe-Cr 3 Too heavily blended
36 Co ?; ; Maximum at unexplained. Rise at due to Ti (ultimate line)
37 Cr, La, Mn, Ni, ; Ti, Fe2; Al?; Fe2 See Rowland, p. 37. An Fe+ line responsible
11 ; ;
39 none ; Fe, ; Nd? Rise at unexplained
40 () ; Rise at probably due to Ag
41 ; ; -3; -3 Maximum certainly due to Fe+. Neutral Fe causes rise in cool classes
42 ; -3; -1; -1N Maximum due to ionized iron
43 ; Maximum due to Fe+; later rise perhaps due to Mn
Zn 1 Unblended
2 Unblended
Sr 1 none ; Fe probably predominates, except perhaps at the lowest temperatures
2 ; Sr ?; Fe ? Fe probably strong, but Sr responsible for part of maximum at
3 Fe, ; ; ; La, Nd? ; ; Maximum uncertain owing to heavy blending
Y 1 ; -1; Sc, Y+ gives the maximum
2 ? ; -3 Maximum ill determined, but probably due to Y+
3 ? -1 Remark in Rowland:--in zircon but not in Zr
Ba 1 none Unblended
CONSISTENCY OF RESULTS
The preceding tabulation summarizes the present state of the observational material bearing on the positions of the maxima of absorption lines. The comparison with theory is an important and difficult problem. The theoretical formulae contain as variables the temperature and the pressure; and the fractional concentration, , is very sensitive to changes in both these variables. It would therefore be possible to satisfy almost any observations by varying the two quantities jointly; but this procedure would furnish no useful test of the theory. The test made in the present chapter will involve the calculation of the temperature scale, with the partial electron pressure, , assumed constant.
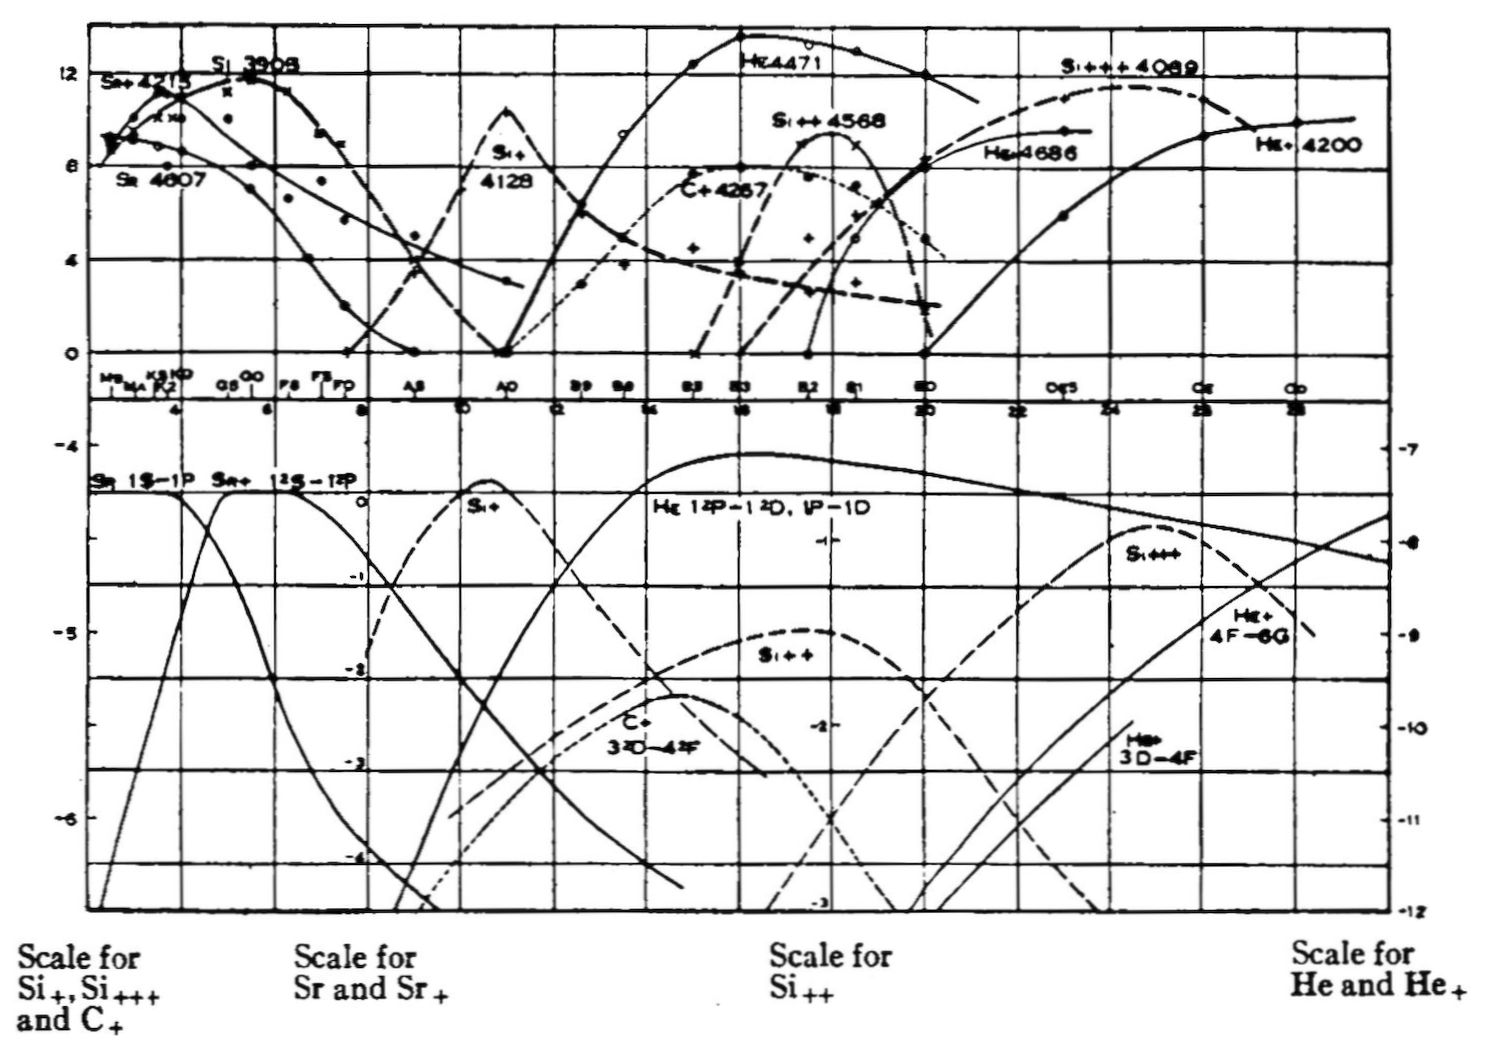
Figure 8
Reproduced from H.C. 256, 1924. Comparison between observation and ionization theory for the hotter stars. The observations are contained in the upper part of the diagram, and the theoretical curves (based on a partial electron pressure are given in the lower part of the figure. For the upper half, ordinates are the observed intensities contained in Table XIX; abscissae are spectral classes from the Draper Catalogue. In the lower part of the figure, ordinates are logarithms of computed fractional concentrations; abscissae are temperatures in thousands of degrees. The abscissae of the upper and lower diagrams have been adjusted so that the observed and computed maxima coincide, thus forming a preliminary temperature scale.
It is certain that this condition is not satisfied in practice, and a more rigorous treatment, which allows for the differences in partial electron pressure, is contained in the chapter that follows. But with the object of examining the consistency of the derived temperature scale, the present test is made under the assumption that the partial electron pressure is constant and equal to about .
The resulting scale of temperatures for the reversing layers of the corresponding classes is contained in the table that follows. Successive columns contain the element that is utilized, the spectral class at which its lines attain maximum, and the corresponding temperature derived from the equations of Chapter VII.
Element Maximum Temperature Element Maximum Temperature
He+ 35000° Ti 3500°
Si+++ 25000 Mn 5000
Si++ 18000 Fe 5000
He 10000 V 3500
C+ 16000 Cr 3500
Si+ 11000 Sr+ 6000
H 10000 Ba+ None 5500
*Zn 8000 Ca 4500
*Ca+ 6000
* Estimates by Menzel, H. C. 258, 1924.