Chapter II · THE HABITAT (continued 2)
Reading edition
For places with a latitude differing by several degrees from that of Lincoln, it is necessary to construct a new table of altitude curves from the celestial globe. It is quite possible to make a close approximation of this from the table given, since the maximum and minimum meridional altitude, and hence the corresponding light intensity, can be obtained as indicated above. For Minnehaha, which is on the 105th meridian, and for other places on standard meridians, i. e., 60°, 75°, 90°, and 120° W., the table of apparent noon indicates the number of minutes to be added to 12 noon, standard time, when the sun is slow, and to be subtracted when the sun is fast. The time at a place east or west of a standard meridian is respectively faster or slower than the latter. The exact difference in minutes is obtained from the difference in longitude by the equation, 15° = 1 hour. Thus, Lincoln, 96° 42′ W. is 6° 42′ west of the standard meridian of 90°; it is consequently 26 minutes 49 seconds slower, and this time must always be added to the apparent noon as determined from the chart. At a place east of a standard meridian, the time difference is, of course, subtracted.
57
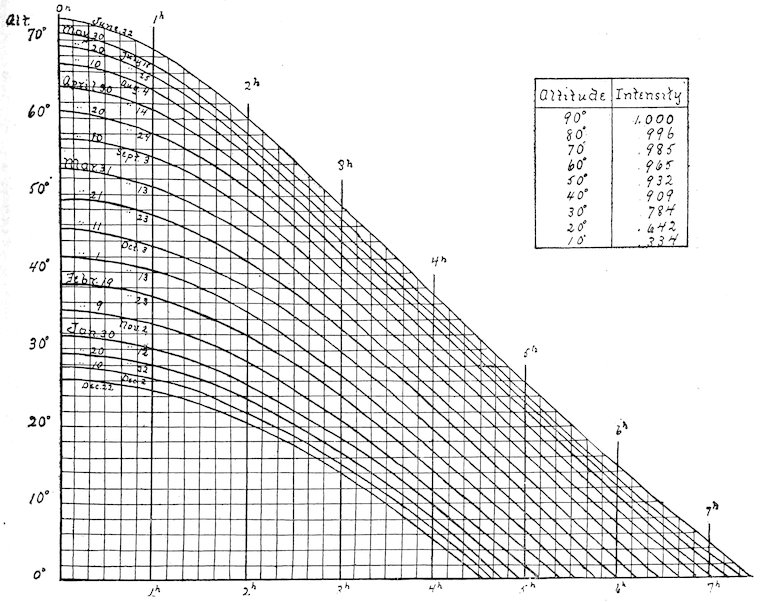
Fig. 13. Chart for the determination of the sun’s altitude, and the corresponding light intensity.
The actual differences in the light intensity from hour to hour and day to day, which are caused by variations in the sun’s altitude, are not as great as might be expected. For example, the maximum intensity at Lincoln, June 22, is .98; the minimum meridional intensity December 22 is .73. The extremes on June 22 are .98 and .33 (the latter at 6:00 A.M. and 6:00 P.M. approximately); between 8:00 A.M. and 4:00 P.M. the range in intensity is from .90 to .98 merely. On December 22, the greatest intensity is .52, the least .20 (the latter at 8:00 A.M. and 4:00 P.M. approximately). If the growing season be taken as beginning with the 1st of March and closing the 1st of October, the greatest variation in light intensity at Lincoln within a period of 10 hours with the meridian at its center (cloudy days excepted) is from .33 to .98. In a period of 8 hours, the extremes are .65 to .98, i. e., the greatest variation, .3, is far within the efficient difference, which has been put at .9. For the growing period, then, readings made between 8:00 A.M. and 4:00 P.M. on normal sunshiny days may be compared directly, without taking into account the compensation for the sun’s altitude. Until the efficient difference has been determined for a large number of species, however, it seems wise to err on the safe side and to compensate for great differences in time of day or year. In all doubtful cases, the intensity obtained by the astronomical 58method should also be checked by photometric readings. A slight error probably enters in, due to reflection from the surface of the paper, and to temperature, but this is negligible.
86. Table for determining apparent noon
DATE TIME EQUATION LINCOLN NOON
Sun slow: + 26m. 49s.
January 1 3m. 47s. 12:31 P.M.
„ 6 6 7 :33
„ 11 8 12 :35
„ 16 10 3 :37
„ 21 11 35 :38
„ 26 12 48 :40
„ 31 13 41 :40
February 10 14 27 :41
„ 20 13 56 :41
March 2 12 18 :39
„ 7 11 10 :38
„ 12 9 53 :37
„ 17 8 29 :36
„ 22 6 59 :34
„ 27 5 27 :32
April 1 3 55 :31
„ 6 2 27 :29
„ 11 1 3 :28
Sun fast: −
„ 16 0 13 :27
„ 21 1 20 :25
„ 26 2 16 :24
May 1 3 0 :24
„ 16 3 48 :23
„ 31 2 33 :24
June 5 1 45 :25
„ 10 0 49 :26
Sun slow: +
„ 15 0 13 :27
„ 20 1 18 :28
„ 25 2 22 :29
„ 30 3 22 :30
Sun slow: + 26m. 49s.
July 5 4m. 19s. 12:31 P.M.
„ 10 5 7 :32
„ 20 6 6 :33
August 4 5 53 :33
„ 14 4 30 :31
„ 19 3 28 :30
„ 24 2 13 :29
„ 29 0 48 :28
Sun fast: −
September 3 0 45 :26
„ 8 2 25 :24
„ 13 4 9 :23
„ 18 5 55 :21
„ 23 7 41 :19
„ 28 9 23 :17
October 3 10 59 :16
„ 8 12 26 :14
„ 13 13 43 :13
„ 18 14 48 :12
„ 23 15 37 :11
November 2 16 20 :10
„ 12 15 45 :11
„ 17 14 54 :12
„ 22 13 44 :13
„ 27 12 14 :15
December 2 10 25 :16
„ 7 8 21 :18
„ 12 6 5 :21
„ 17 3 41 :23
„ 22 1 12 :26
Sun slow: +
„ 27 1 17 :28
5987. Place. The effect of latitude upon the sun’s altitude, and the consequent light intensity have been discussed in the pages which precede. Latitude has also a profound influence upon the duration of daylight, but the importance of the latter apart from intensity is not altogether clear. The variation of intensity due to altitude has been greatly overestimated; it is practically certain, for example, that the dwarf habit of alpine plants is not to be ascribed to intense illumination, since the latter increases but slightly with the altitude. It has been demonstrated astronomically that about 20 per cent of a vertical ray of sunlight is absorbed by the atmosphere by the time it reaches sea level. At the summit of Pike’s Peak, which is 14,000 feet (4,267 meters) high, the barometric pressure is 17 inches, and the absorption is approximately 11 per cent. In other words, the light at sea level is 80 per cent of that which enters the earth’s atmosphere; on the summit of Pike’s Peak it is 89 per cent. As the effect of the sun’s altitude is the same in both places, the table of curves on page 57 will apply to both. Taking into account the difference in absorption, the maximum intensity at sea level and at 14,000 feet on the fortieth parallel is .98 and 1.09 respectively. The minimum intensities between 8:00 A.M. and 4:00 P.M. of the growing period are .64 and .71 respectively. The correctness of these figures has been demonstrated by photometer readings, which have given almost exactly the same results. Such slight variations are quite insufficient to produce an appreciable adjustment, particularly in structure. They are far within the efficient difference, and Reinke[5] has found, moreover, that photosynthetic activity in Elodea is not increased beyond the normal in sunlight sixty times concentrated. In consequence, it is entirely unnecessary to take account of different altitudes in obtaining light values.
The slope of a habitat exerts a considerable effect upon the intensity of the incident light. If the angle between the slope and the sun’s ray be 90°, a square meter of surface will receive the maximum intensity, 1. At an angle of 10°, the same area receives but .17 of the light. This relation between angle and intensity is shown in the table which follows. The influence of the light, however, is felt by the leaf, not by the slope. Since there is no connection between the position of the leaf and the slope of the habitat, the latter may be ignored. In consequence, it is unnecessary to make allowances for the direction of a slope, viz., whether north, east, south, or west, in so far as light values are concerned. The angle which a leaf makes with its stem determines the angle of incidence, and hence the amount of light received by the leaf surface. This is relatively unimportant for two reasons. This angle changes hourly and daily with the altitude of the 60sun, and the intensity constantly swings from one extreme to the other. Moreover, the extremes 1.00 and 0.17, even if constant, are hardly sufficient to produce a measurable result. When the angle of the leaf approaches 90°, there is the well-known differentiation of leaf surfaces and of chlorenchym, but this has no relation to the angle of incidence.
Table of Intensity at Various Angles
ANGLE INTENSITY
90 1.00
80 .98
70 .94
60 .87
50 .77
40 .64
30 .50
20 .34
10 .17
In the sunlight, it makes no difference at what height a light reading is taken. In forest and thicket as well as in some herbaceous formations, the intensity of the light, if there is any difference, is greatest just beneath the foliage of the facies. In forests especially, the light is increasingly diffuse toward the ground, particularly where layers intervene. In woodland formations, moreover, the exact spot in which a reading is made must be carefully chosen, unless the foliage is so dense that the shade is uniform. A very satisfactory plan is to take readings in two or more spots where the shade appears to be typical, and to make a check reading in a “sunfleck,” a spot where sunlight shows through. In forests and thickets, the sunflecks are fleeting, and the light value is practically that of the shade. In passing into open woodland and thicket, the sunflecks increase in size and permanence, until finally they exceed the shade areas in amount and become typical of the formation.
Reflected and Absorbed Light
88. The fate of incident light. The light present in a habitat and incident upon a leaf is not all available for photosynthesis. Part is reflected or screened out by the epidermis, and a certain amount passes through the chlorenchym, except in very thick leaves. The light absorbed is by far the greatest in the majority of species. Many plants with dense coatings of hairs reflect or withhold more light than they absorb, and the amount of light reflected by a thick cuticule is likewise great. As light is imponderable, the actual amount absorbed or reflected by the leaf can not be determined. It is possible, however, to express this in terms of the total amount 61received, by means of readings with solio paper, and the knowledge thus obtained is of great importance in interpreting the modifications of certain types of leaves. For example, a leaf with a densely hairy epidermis may receive light of the full intensity, 1; the amount reflected or screened out by the hairs may be 95 per cent of this, the amount absorbed 5 per cent, and that transmitted, nil. In the majority of cases, however, the absorbed light is considerably more than the amount reflected or transmitted.
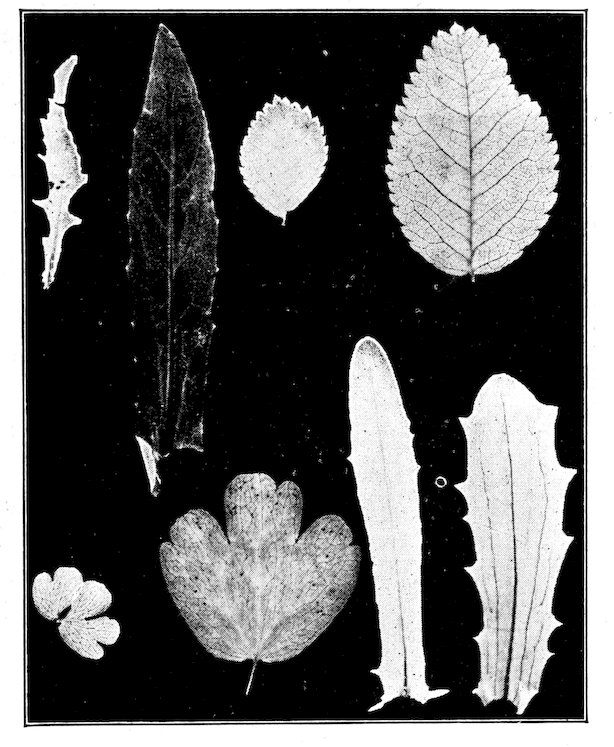
Fig. 14. Leaf print: exposed 10 m., 11 A.M. August 20. The leaves are from sun and shade forms of Bursa bursa-pastoris, Rosa sayii, Thalictrum sparsiflorum, and Machaeranthera aspera. In each the shade leaf prints more deeply.
89. Methods of determination. If results are to be of value, reflected and transmitted light must be determined in the habitat of the plant simultaneously with the total light which a leaf receives. An approximation of the light reflected from a leaf surface is secured by placing the photometer so that the light reflected is thrown upon the solio strip. A much more satisfactory method, however, is to determine it in connection with the amount of light transmitted through the epidermis. This is done by stripping a piece of epidermis from the upper surface of the leaf and placing it over the slit in the photometer for an exposure. An exposure in the full light of the habitat is made simultaneously with another photometer, or immediately afterward upon the same strip. When the epidermis is not too dense, both exposures are permitted to reach the same tint, and the relation between them is precisely that of their lengths of exposure. Ordinarily the two exposures are made absolutely simultaneous by placing the epidermis over half of the opening, leaving the other half to record the full light value, and the results, or epidermis prints, are referred to a multiple 62standard. The difference between the two values thus obtained represents the amount of reflected light together with that screened by the epidermis. The amount of light transmitted through the leaf may be measured in the same way by using the leaf itself in place of the epidermis alone. The time of exposure is necessarily long, however, and it has been found practicable to obtain leaf prints by exposing the leaf in a printing frame, upon solio paper, at the same time that the epidermis print is made. In a few species both the upper and lower epidermis can be removed and the amount of light absorbed determined directly by exposing the strip covered with the chlorenchym. Generally, however, this must be computed by subtracting the sum of the per cents of reflected and transmitted light from 100 per cent, which represents the total light.
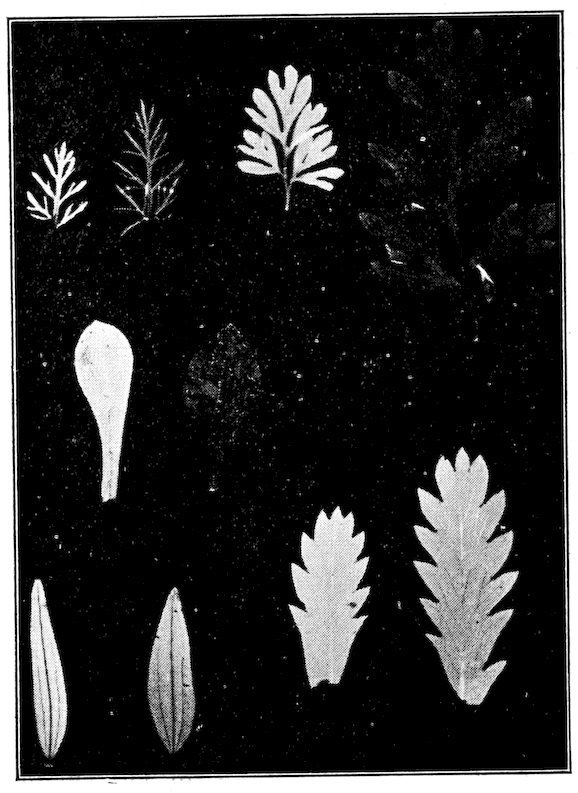
Fig. 15. Leaf print: exposure as before. Sun and shade leaves of Achillea lanulosa, Capnoides aureum, Antennaria umbrinella, Galium boreale, and Potentilla propinqua.
90. Leaf and epidermis prints. In diphotic leaves the screening effect of the lower epidermis may be ignored. Isophotic sun leaves, i. e., those nearly upright in position or found above light-colored, reflecting soils, are usually strongly illuminated on both sides, and the absorbed light can be obtained only by measuring the screening effect of both epiderms. Shade leaves and submerged leaves often contain chloroplasts in the epidermis, and the above method can not be applied to them. In fact, in habitats where the light is quite diffuse, practically all incident light is absorbed. The rare exceptions are those shade leaves with a distinct bloom. In addition to their use in obtaining the amount of light absorbed, both leaf and epidermis prints are extremely interesting for the direct comparison of light relations in the leaves of species belonging to different habitats. The relative screening value of the upper and lower epidermis, or of the corresponding epiderms of two ecads or two species, is readily ascertained by exposing the two side by side in sunshine, over the slit in the photometer. For leaf prints fresh leaves are desirable, though nearly the same results can be obtained from 63leaves dried under pressure. The leaves are grouped as desired on the glass of a printing frame, and covered with a sheet of solio. They are then exposed to full sunlight, preferably at meridian, and the prints evaluated by means of the multiple standard. This method is especially useful in the comparison of ecads of one species. These differences due to transmitted light are very graphic, and can easily be preserved by “toning” the print in the usual way.
Expression of Results
91. Light records. The actual photographic records obtained by photometer and selagraph can at most be kept but a few months, unless they are toned or fixed. “Toning” modifies the color of the exposure materially, and changes its intensity so that it can not be compared with readings not fixed. It would involve a great deal of inconvenience to make all comparisons by means of toned strips and standard, even if it were not for the fact that it is practically impossible to obtain exactly the same shade in lots toned at different times. The field record, if carefully and neatly made, may well take the place of a permanent one. The form is the following:
Day Hour Formation Station Altitude Exposure Group Height No. Length of exposure Standard Light value Base value Reflected light Transm’d light Absorbed light
14/9/04 12:00 M. Spruce Milky Way 2600 m. N.E. 20° Opulaster 1 foot 2:10 160 s. 3 s .019
„ 12:05 P.M. Spruce Moss Glen 2500 m. Level Streptopus „ 2:12 240 s. 3 s. .012
„ 12:15 P.M. Brook b’nk Grotto 2500 m. E. 3° Filix Surface 2:13 360 s. 3 s. .008
92. Light sums, means, and curves. Owing to the fact that the selagraph has not yet been used in the field, no endeavor has been made to determine the light value for every hour of the day in different habitats. Consequently there has been no attempt to compute light sums and means. Photometer readings have sufficed to interpret the effect of light in the structure of the formation, and of the individual, but they have not been sufficiently frequent for use in ascertaining sums and means. The latter are much less valuable than the extremes, especially when the relative duration of these is indicated. Means, however, are readily obtained from the continuous records. Light sums are probably impracticable, as the factor is not one that can be expressed in absolute terms. The various kinds and combinations of light curves are essentially the same as for humidity. The level curve through a series of habitats is the most illuminating, but the day curve of hour variations is of considerable value. The curve of 64daily duration, based upon full sunlight, is also of especial importance for plants, and stations which receive both sun and shade during the day.
TEMPERATURE
93. In consequence of its indirect action, temperature does not have a striking effect upon the form and structure of the plant, as is the case with water and light. Notwithstanding, it is a factor of fundamental importance. This is especially evident in the character and distribution of vegetation. It is also seen in the germination and growth of plants, in the length of season, and in the important influence of temperature upon humidity, and hence upon water-content. Because of its intimate relation with the comfort of mankind, the determination of temperature values has received more attention than that of any other factor, and excellent simple and recording instruments are numerous. For plants, it is also necessary to employ instruments for measuring soil temperatures. The latter unquestionably have much less meaning for the plant than the temperatures of the air, but they have a direct influence upon the imbibition of water, and upon germination.
Thermometers
94. Air thermometers. The accurate measurement of temperature requires standard thermometers. Reasonably accurate instruments may be standardized by determining their error, but they are extremely unsatisfactory in practice, since they result in a serious waste of time. Accurate thermometers which read to the degree are entirely serviceable as a rule, but instruments which read to a fraction of a degree are often very much to be desired. The writer has found the “cylindrical bulb thermometer, Centigrade scale” of H. J. Green, to be an exceedingly satisfactory instrument. The best numbers for general use are 247 and 251, which read from –15° to 50° C. and are graduated in .2°. They are respectively 9 and 12 inches long, and cost $2.75 and $3.50. These instruments are delicate and require careful handling, but even in class work this has proved to be an advantage rather than otherwise. In making readings of air temperatures with such thermometers, constant precautions must be taken to expose the bulb directly to the wind and to keep it away from the hand and person.
95. Soil thermometers. The thermometer described above has been used extensively for soil temperatures. The determination of the latter is conveniently combined with the taking of soil samples, by using the hole for a temperature reading. When carefully covered, these holes can be used from day to day throughout the season without appreciable error, even in 65gravel soils. Repeated tests of this have been made by simultaneous readings in permanent and newly made holes, and the results have always been the same. It has even been found that the error is usually less than 1 degree when the hole is left uncovered, if it is more than 9 inches deep. A slight source of error lies in the fact that the thermometer must be raised to make the reading. With a little practice, however, the top of the column of mercury may be raised to the surface and read before the change of temperature can react upon it. This is especially important in very moist or wet soils where the bulb becomes coated with a film of moisture. This evaporates when the bulb is brought into the air, and after a moment or two the mercury slowly falls.

Fig. 16. Soil thermometer
Regular soil thermometers are indispensable when readings are desired at depths greater than 12–18 inches. They possess several disadvantages which restrict their use almost wholly to permanent stations. It is scarcely possible to carry them on field trips, and the time required to place them in the soil renders them practically useless for single readings. Moreover, the instruments are expensive, ranging in price from $7 for the two-foot thermometer, to $19 for the eight-foot one. When it is recognized that deep-seated temperatures are extremely constant and that the slight fluctuations affect, as a rule, only the relatively stable shrubs and trees, it is evident that such temperatures are of restricted importance. Still, in any habitat, they must be ascertained before they can well be ignored, though it is unwise to spend much time and energy in their determination. Soil thermometers of the form illustrated may be obtained from H. J. Green, Brooklyn.
96. Maximum-minimum thermometers. These are used for determining the range of temperature within a given period, usually a day. Since they are much cheaper than thermographs, they can replace these in part, although they merely indicate the maximum and minimum temperatures for the day, and do not register the time when each occurs. The maximum is a mercurial thermometer with a constriction in the tube just above the bulb; this allows the mercury to pass out as it expands, but prevents it from running back, thus registering the maximum temperature. The minimum thermometer contains alcohol. The column carries a tiny dumbbell-shaped marker which moves down with it, but will not rise as 66the liquid expands. This is due to the fact that the fluid expands too slowly to carry the marker upward, while the surface tension causes it to be drawn downward as the fluid contracts. The minimum temperature is indicated by the upper end of the marker. In setting up the thermometers, they are attached by special thumbscrews to a support which holds them in an oblique position. The minimum is placed in a special holder above the maximum which rests on a pin that is used also for screwing the pivot-screw into position. The support is screwed tightly to the cross-piece of a post, or in forest formations it is fastened directly to a board nailed upon a tree trunk. A shelter has not been used in ecological work, although it is the rule in meteorological observations. The minimum thermometer is set for registering by raising the free end, so that the marker runs to the end of the column. The mercury of the maximum is driven back into the bulb by whirling it rapidly on the pivot-screw after the pin has been taken out. This must be done with care in order that the bulb may not be broken. As soon as the instrument comes to rest, it is raised and the pin replaced, great care being taken to lift it no higher than is necessary. When the night maximum is sought, the thermometer should be whirled several times in order to drive the column sufficiently low. Usually, in such cases, a record is made of this point to make sure that the maximum read is the actual one. If the pivot-screw is kept well oiled, less force will be required to drive the mercury back. In practice, the thermometers have been observed at 6:00 A.M. and 6:00 P.M. each day, thus permitting the reading of the maximum-minimum for both day and night. Pairs of maximum-minimum thermometers are to be obtained from H. J. Green, 1191 Bedford Ave., Brooklyn, or Julien P. Friez, Baltimore, Maryland, at a cost of $8.25.
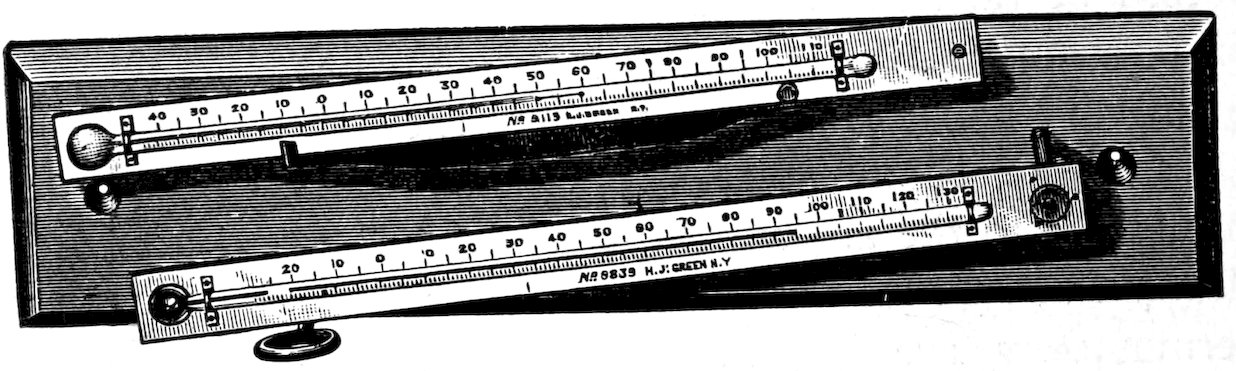
Fig. 17. Maximum-minimum thermometer.
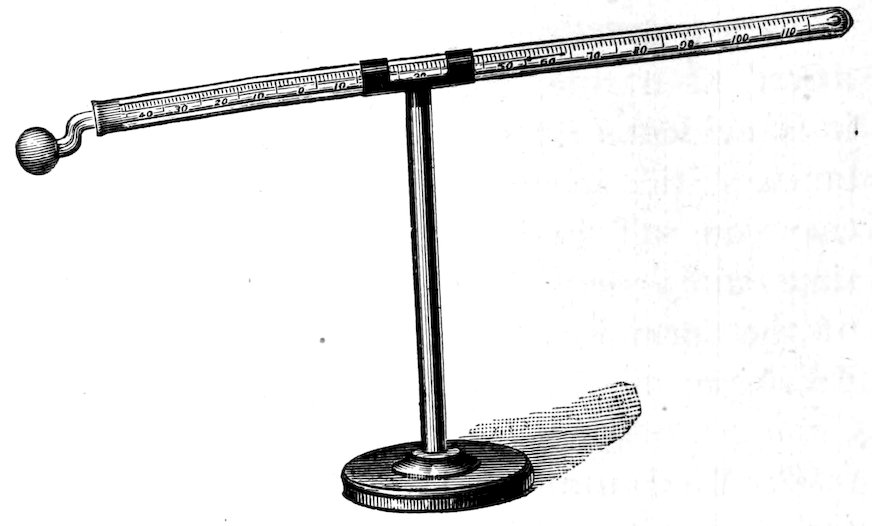
Fig. 18. Terrestrial radiation thermometer.
67
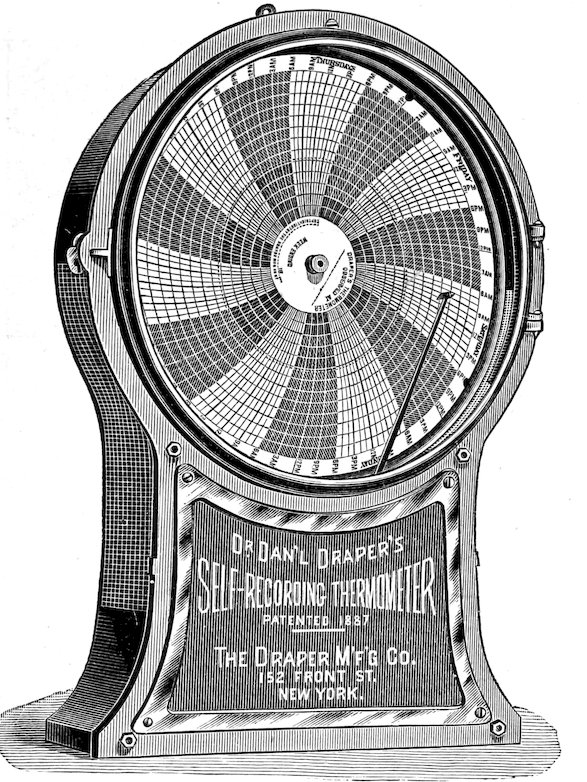
Fig. 19. Draper thermograph.
97. Radiation thermometers. These are used to determine the radiation in the air, and from the soil, i. e., for solar and terrestrial radiation. The latter alone has been employed in the study of habitats, chiefly for the purpose of ascertaining the difference in the cooling of different soils at night. The terrestrial radiation thermometer is merely a special form of minimum thermometer, so arranged in a support that the bulb can be placed directly above the soil or plant to be studied. It is otherwise operated exactly like the minimum thermometer, and the reading gives the minimum temperature which the air above the plant or soil reaches, not the amount of radiation. As a consequence, these instruments are valuable only where read in connection with a pair of maximum-minimum thermometers in the air, or when read in a series of instruments placed above different soils or plants.
98. Thermographs. Two types of standard instruments are in general use for obtaining continuous records of air temperatures. These are the Draper thermograph, made by the Draper Manufacturing Company, 152 Front St., New York city ($25 and $30), and the Richard thermograph sold by Julien P. Friez, Baltimore ($50). After careful trial had demonstrated that they were equally accurate, the matter of cost was considered decisive, and the Draper thermograph has been used exclusively in the writer’s own work. This instrument closely resembles the psychrograph manufactured by the same company. It is made in two sizes, of which the larger one is the more satisfactory on account of the greater distance between the lines of the recording disk. The thermometric part consists of two bimetallic strips, the contraction and expansion of which 68are communicated to a hand carrying a pen. The latter traces a line on the record sheet which is attached to a metal disk made to revolve by an eight-day clock. In practice the thermograph is set up in the shelter which contains the psychrograph, and in exactly the same manner. The clock is wound, the record put in place, and the pen inked in the same way also. The proper position of the pen is determined by making a careful thermometer reading under the shelter, and then regulating the pen hand by means of the screws at the base of it. A similar test reading is also made each week, when the clock is rewound. A record sheet may be left in position for three weeks, the pen being filled each week with a different ink. The fixed order of using the inks is red, blue, and green as already indicated.
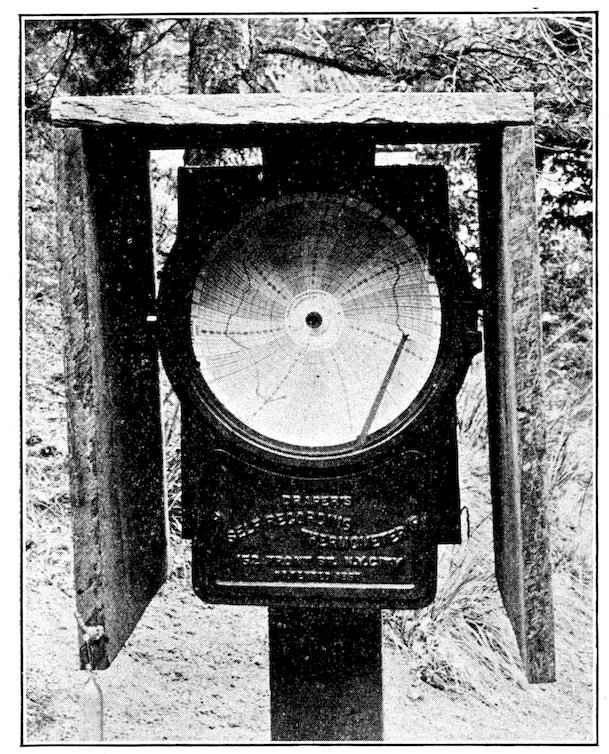
Fig. 20. Shelter for thermograph.
Owing to the fact that they are practically stationary, soil thermographs are of slight value, except at base stations. Here, the facts that they are expensive, that the soil temperatures are of relatively little importance, and that they can be determined as easily, or nearly so, by simple thermometers, make the use of such instruments altogether unnecessary, if not, indeed, undesirable. In a perfectly equipped research station, they undoubtedly have their use, but at ordinary stations, and in the case of private investigators, their value is in no wise commensurate with their cost.
69
Readings
99. Time. The hourly and daily fluctuations of the temperature of the air render frequent readings desirable. It is this variation, indeed, which makes single readings, or even series of them, inconclusive, and renders the use of a recording instrument almost imperative in the base station at least. Undoubtedly, a set of simultaneous readings at different heights in one station, or at the same height in different stations, especially if made at the maximum, have much value for comparison, but their full significance is seen only when they are referred to a continuous base record. Such series, moreover, furnish good results for purposes of instruction. In research work, however, it has been found imperative to have thermographs in habitats of widely different character. With these as bases, it is possible to eke them out with considerable satisfaction by means of maximum-minimum thermometers in less different habitats, or in different parts of the same habitat. Naturally these are less satisfactory, and are used only when expense sets a limit to the number of thermographs. In a careful analysis of a single habitat, more can be gained by one base thermograph supplemented by three pairs of maximum-minimum thermometers in dissimilar areas of the habitat than by two thermographs, and the cost is the same.
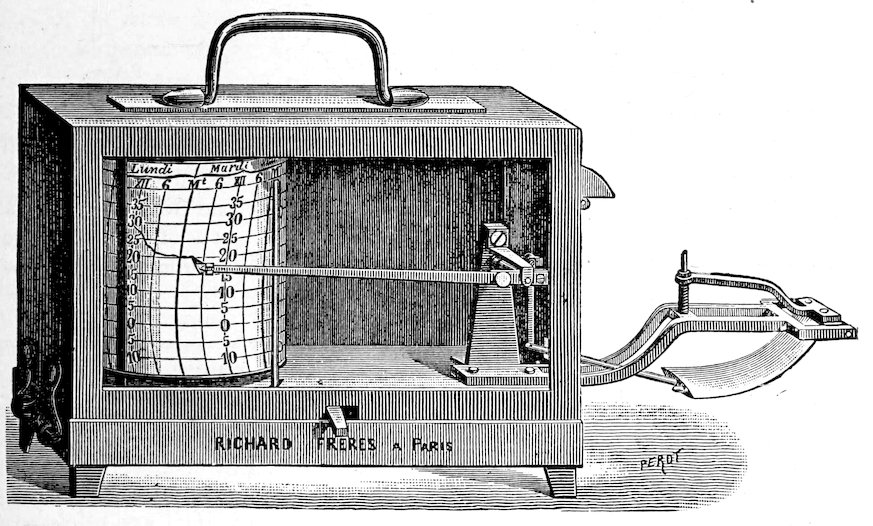
Fig. 21. Richard thermograph.
70100. Place and height. For general air temperatures, thermograph and thermometer readings are made at a height of 3 feet (1 meter). Soil temperatures are regularly taken at the surface and at a depth of 1 foot. When a complete series of simultaneous readings is made in one station, the levels are 6 feet and 3 feet in the air, the surface of the soil, and 5, 10, and 15 inches in the soil. When sun and shade occur side by side in the same formation, as is true of many thickets and forests, surface readings are regularly made in both. Similarly, valuable results are obtained by making simultaneous readings on the bare soil, on dead cover, and upon a leaf, while the influence of cover is readily ascertained by readings upon it and beneath it. A full series of station readings made at the same time upon north, east, south, and west slopes is of great importance in studying the effects of exposure.
Expression of Results
101. Temperature records. Neither field nor permanent form is required for thermographic records, other than the record sheet itself, which contains all the necessary information in a fairly convenient form. Although the temperature of a particular hour and day can not be read at a mere glance, it can be obtained so easily that it is a waste of time to make a tabular copy of each record sheet. For thermometer readings, either single or in series, the following form is used:
Day Hour Formation Station Altitude Exposure Community POSITION OF READING Thermograph Sky Wind
3 feet Surf. 12 in.
17/8/04 6:30 A.M. Spruce Jack Brook 2550 m. N.E. 5° Mertensiare 9° 9° 9.8° 10° Clear 0
„ „ Half gravel Hiawatha 2550 m. N.E. 7° Asterare 11.2° 11.2° 14.8° 10° Clear 0
„ 6:30 P.M. Spruce Jack Brook 2550 m. N.E. 5° Mertensiare 11.4° 11.4° 9.8° 11° Cloudy 0
„ „ Half gravel Hiawatha 2550 m. N.E. 7° Asterare 12° 13.8° 16.4° 11° Cloudy 0
102. Temperature sums and means. The amount of heat, i. e., the number of calories received within a given time by a definite area of plant surface, can be determined by means of a calorimeter. From this the temperature sum of a particular period may be obtained by simple addition. In the present condition of our knowledge, it is impossible to establish any exact connection between such results and the functional or growth effect that can be traced directly to heat. As a consequence, temperature sums do not at present contribute anything of value to an understanding of the relation between cause and effect. The mean daily temperature is readily 71obtained by averaging twenty-four hour-temperatures recorded by the thermograph. The method employed by Meyen[6], of deriving the mean directly from the maximum and minimum for the day, is not accurate; from a large number of computations, the error is always more than two degrees. On the other hand, the mean obtained by averaging the maximum and minimum for the day and night has been found to deviate less than 1 degree from the mean proper. This fact greatly increases the value of maximum-minimum instruments if they are read daily at 6:00 A.M. and 6:00 P.M.
103. Temperature curves. The kinds and combinations of temperature curves are almost without number. The simple curves of most interest are those for a series of stations or habitats, based upon the level of three feet, or the surface, or the daily mean. The curves for each station representing the different heights and depths and the season curve of the daily means for a habitat are also of much importance. One of the most illuminating combinations is that which groups together the various level curves for a series of habitats. Other valuable combinations are obtained by grouping the curves of daily means of different habitats for the season, or the various station curves.
104. Plant temperatures. The direct effects of temperature as seen in nutrition and growth can be ascertained only by determining the temperature of plant tissues. The temperatures of the air and of the soil surface have an important effect upon humidity, and water-content, and through them upon the plant, but heat can influence assimilation, for example, only in so far as it is absorbed by the assimilating tissue. The temperatures of the leaf, as the most active nutritive organ of the plant, are especially important. While it is a well-known fact that internal temperatures follow those of the air and soil closely, though with varying rapidity of response, this holds less for leaves than for stems and roots. Owing to the very obvious difficulties, practically nothing has yet been done in this important field. A few preliminary results have been obtained at Minnehaha, which serve to show the need for such readings. Gravel slide rosettes in an air temperature of 24° C. and a surface temperature of 40° C. gave the following surface readings: Parmelia, 40°, Eriogonum, 38.6°, Arctostaphylus, 35°, Thlaspi, 31.8°, and Senecio, 31°. The leaf of Eriogonum flavum, which is smooth above and densely hairy below, indicated a temperature of 31.8° when rolled closely about the thermometer bulb with the smooth surface out, and 28° when the hairy surface was outside. The surface readings 72of the same leaf were .5°–1° higher when made upon the upper smooth surface. This immediately suggests that the lower surface may be modified to protect the leaf from the great heat of the gravel, which often reaches 50° C. (122° F.).
PRECIPITATION
105. General relations. As the factor which exerts the most important control upon water-content and humidity, rainfall must be carefully considered by the ecologist. It is such an obvious factor, and is usually spoken of in such general terms that the need of following it accurately is not evident at once. When it is recognized that the fluctuations of water-content are directly traceable to it, it becomes clear that its determination is as important as that of any indirect factor. This does not mean, however, that the amount of yearly rainfall is to be taken from the records of the nearest weather station, and the factor dismissed. Like other instruments, the rain gauge must be kept at the base station of the area under study, and when this is extensive or diverse, additional instruments should be put into commission. While the different parts of the same general climatic region may receive practically the same amount of precipitation during the year, it is not necessarily true that the rainfall of any particular storm is equally distributed, especially in the mountains. Nothing less than an exact knowledge of the amount of rain that falls in the different areas will make it possible to tell how much of the water-content found at any particular time in these represents merely the chance differences of precipitation.
The forms of precipitation are rain, dew, hail, snow, and frost. Of these, hail is too infrequent to be taken into account, while frost usually occurs only at the extremes of the growing season, and in its effect is rather to be reckoned with temperature. Snow rarely falls except during the period of rest, and, while it plays an important part as cover, it is merely one of several factors that determine the water-content of the soil at the beginning of spring. The influence of dew is not clearly understood. It is almost always too slight in amount and too fleeting to affect the water-content of the soil. It seems probable that it may serve by its own evaporation to decrease in some degree the water loss from the soil, and from bedewed plants. If, however, the dew is largely formed by the water of the soil and of the plant, as is thought by some, then it is negligible as a reinforcement of water-content. From the above, it is evident that rainfall alone exerts a profound effect upon the habitat, and it is with its measurement that the ecologist is chiefly concerned.
73
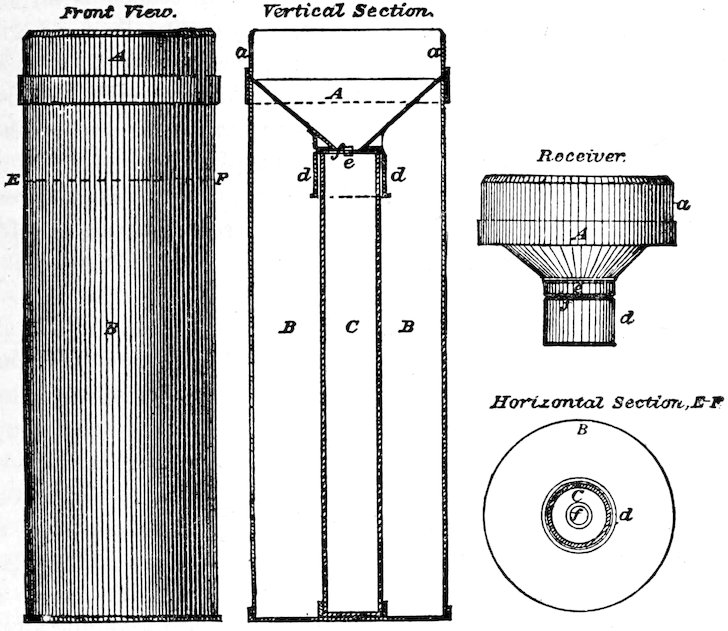
Fig. 22. Rain gauge showing construction.
106. The rain gauge, as the illustration shows, is a cylindrical vessel with a funnel-shaped receiver at the top, which is 8 inches in diameter. The receiver fits closely upon a narrower brass vessel or measuring tube in which the rain collects. The ratio of surface between receiver and tube is 10 to 1. For readings covering a general area, the rain-gauge is placed in the open, away from buildings or other obstructions, and is sunken in the ground sufficiently to keep it upright. In localities where winds are strong, it is usually braced at the sides also or supported by a wooden frame. In measuring the amount of rain in the measuring tube, the depth is divided by ten in order to ascertain the actual rainfall. The depth is measured by inserting the measuring-rod through the hole in the funnel until it touches the bottom. It is left for a second or so, quickly withdrawn, and the limit of the wetted portion noted. In the case of standard rods, the actual rainfall is read directly in hundredths, so that the division by ten is unnecessary. After each reading, the measuring tube is carefully drained, replaced, and the receiver put in position. No regular time for making readings is necessary. During a rainy period, it is customary to make a measurement each day, but it has been found more satisfactory for ecological purposes to measure each shower, and to record its duration. These two facts furnish 74a ready clue to the relative amount of run-off in each fall of rain. The measurement of snowfall is often made merely by determining its depth. For comparison with rainfall, the rain gauge with receiver and tube withdrawn is used. The snow which falls is melted, poured into the measuring tube, and measured in the ordinary way. The U. S. Weather Bureau standard rain gauge, with measuring stick, may be obtained of H. J. Green, or of J. P. Friez for $5.25.
107. Precipitation records. From the periodic character of precipitation, rainfall sums, means, and curves have little importance in the careful study of the habitat. The rainfall curve for the growing season is an aid in explaining the curve of water-content, and the mean rainfall of a region gives some idea of its vegetation, though even here the matter of its distribution is of primary importance. The rain and snow charts published by the U. S. Weather Bureau furnish data of some importance for the general study of vegetation, but it is evident that they can play little part in a system which is founded upon the habitat. Precipitation records, for reasons of brevity and convenience, are united with wind records, and the form will be found under the discussion of this factor.
WIND
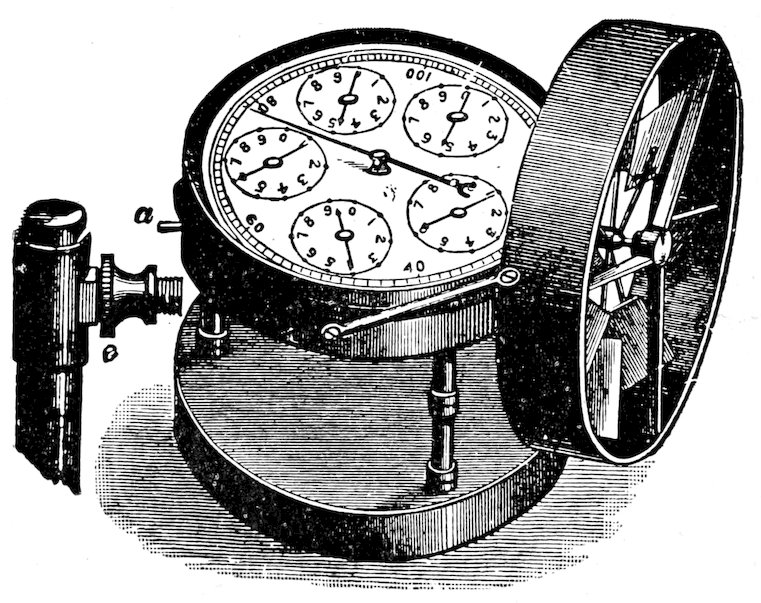
Fig. 23. Simple anemometer.
108. Value of readings. On account of its direct effect upon humidity, and its consequent influence upon water-content, the part which wind plays in a habitat can not be ignored in a thorough investigation. It is an important element in exposure, and accordingly has a marked mechanical effect upon the vegetation of exposed habitats, alpine slopes, seacoasts, plains, etc. Owing to its inconstancy and its extreme variation in velocity, single wind readings are absolutely without value. When read in series, anemometers give some information upon the comparative air movement in different habitats, 75but the chance of error is great, except when the breeze is steady. Anemographs alone give real satisfaction. Accurate results, however, are not obtainable without a series of two or more in different habitats, and it is still an open question whether the results obtained justify the expense. For a completely equipped base station, anemometer, anemograph, and wind vane are desirable instruments, but the study of the habitat has by no means reached the stage of precision in which their general use is necessary.
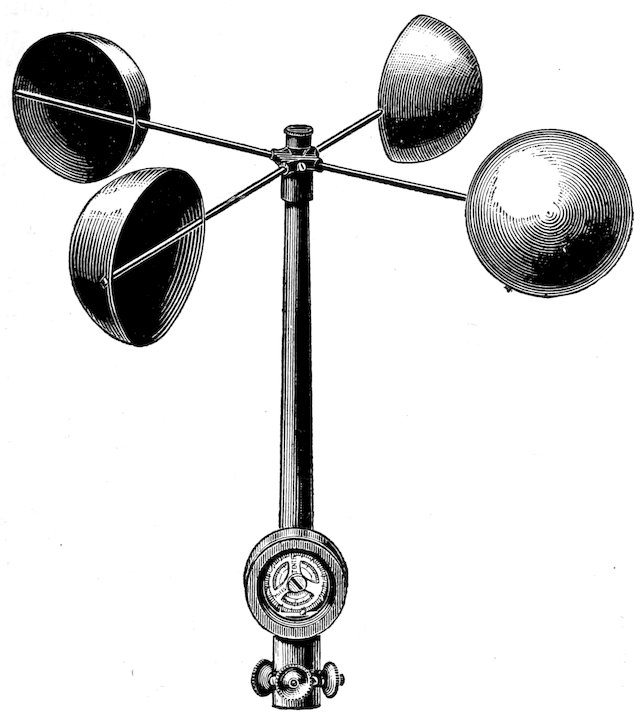
Fig. 24. Standard anemometer.
109. The anemometer in its simplest form is adapted only to readings made under direct observation, as a sudden change in the direction of the wind reverses the movement of the indicator needle. This simple wind gauge, shown in figure 23, has been used for instructional purposes, and to a slight extent, also, in ascertaining the effect of cover. In constant winds, successive single readings are found to have value, but, ordinarily, the observations must be simultaneous. Careful tests of this simple instrument show that it is essentially accurate. It may be obtained from the C.H. Stoelting Company, 31 W. Randolph St., Chicago, for $25. The standard anemometer (Fig. 24) is practically a recording instrument up to 1,000 miles, but as the dials run on without any indication of the total number of revolutions, it must be visited and read each day. This renders its use difficult for habitats which are some distance apart. When exact determinations of wind values become necessary, the most successful method is to establish a series of three standard anemometers. One of these should be placed upon the most exposed part of a typically open habitat, the second in the most protected part of the same habitat, while the third is located in the midst of a representative forest formation. If the two habitats are close together, the daily visits 76can be made without serious inconvenience. The reading of the registering dials requires detailed explanation, and for this the reader is referred to the printed directions which accompany the instrument. In setting up the anemometer it must be borne in mind that the ecologist desires the wind velocity for a particular habitat. In consequence, the precautions which the meteorologist takes to place the instrument at a certain height and well away from surrounding obstructions do not hold here. Standard anemometers are furnished by H. J. Green, and J. P. Friez for $25 each.
The anemograph is an anemometer electrically connected with an automatic register. It is the only instrument adapted to continuous weekly records in different habitats, but the price, $75 ($25 for the anemometer and $50 for the register) is practically prohibitive, at least until a complete series of ecographs for other factors has been obtained.
110. Records. The following form is used as a combined record for precipitation and wind:
Day Time Formation Station Altitude Exposure Community RAINFALL Base WIND Base
Inches Duration Velocity Heig’t Direction
29/8/04 6:30 P.M. Half gravel Hiawatha 2550 m. N.E. 17° Asterare 1 8 hours 5 3 ft. N. W.
31/8/04 5:45 P.M. „ „ „ „ „ Trace 10 min. 12 „ „
2/9/04 4:00 P.M. „ „ „ „ „ .2 2 hours 7 „ W.
3/9/04 10:00 P.M. „ „ „ „ „ Trace 18 „ „
SOIL
111. Soil as a factor. In determining the value of the soil as a factor in a particular habitat, it must be clearly recognized that its importance lies solely in the control which it exerts upon water-content and nutrient-content. The former is directly connected with the texture or fineness of the soil, the latter with its chemical nature. Accordingly, the structure of the soil and its chemical composition are the fundamental points of attack. These are not at all of equal value, however. Water is both a food, and a solvent for the nutrient salts of the soil. Furthermore, the per cent of soluble salts, as determined in mechanical analyses, is practically the same for all ordinary soils. Indeed, the variations for the same soil types are as great as for entirely different types. For these reasons, soluble salt-content may be ignored except where it is readily seen to be excessive, as in alkaline soils; and determinations of chemical composition are necessary only in those soils which contain salts or acids to an injurious degree, e. g., 77alkaline soils, peat bogs, humus swamps, etc. The structure of the soil, on the other hand, in the usual absence of excessive amounts of solutes, absolutely controls the fate of the water that enters the ground, in addition to its influence upon the run-off. It determines the amount of gravitation water lost by percolation, as well as the water that can be raised by capillarity. The resultant of these, the total soil water or holard, is hence an effect of structure, while the size and compactness of the particles are conclusive factors in controlling the chresard. It must be recognized, however, that these are all factors which enable us to interpret the amount of holard or chresard found in a particular soil. They have no direct important effect upon the plant, but influence it only in so far as they affect the water present.
112. The value of soil surveys. The full appreciation of the preeminent value of water-content, particularly of the chresard, greatly simplifies the ecological study of soils. The ecologist is primarily concerned with soil water only in its relation to the plant, and while a fair knowledge of soil structure is essential to a proper understanding of this, he has little concern with the detailed study of the problems of soil physics. For the sake of a proper balance of values, he must avoid the tendency noted elsewhere of ignoring the claims of the plant, and of studying the soil simply as the seat of certain physical phenomena. Accordingly, it is felt that mechanical and chemical analyses, determinations of soluble salt-content, etc., have much less value than has been commonly supposed. The usual methods of soil survey, which pay little or no attention to water-content, and none at all to available water, are practically valueless for ecological research. This statement does not indicate a failure to appreciate the importance of the usual soil methods for many agricultural problems, such as the use of fertilizers, conservation of moisture, etc., though even here to focus the work upon water-content would give much more fundamental and serviceable results. For these reasons, slight attention will be paid to methods of mechanical and chemical analysis. In their stead is given a brief statement of the origin, structure, and character of soils with especial reference to water-content.
113. The origin of soils. Rocks form soils in consequence of weathering, under the influence of physical and biotic factors. Weathering consists of two processes, disintegration, by which the rock is broken into component particles of various sizes, and decomposition, in which the rock or its fragments are resolved into minute particles in consequence of the chemical disaggregation of its minerals, or of some other chemical change. These processes are usually concomitant, although, as a rule, one is more evident than the other. The relation between them is dependent upon the character 78of the rock and the forces which act upon it. Hard rocks, i. e., igneous and metamorphic ones, as a rule disintegrate more rapidly than they decompose; sedimentary rocks, on the other hand, tend to decompose more rapidly than they disintegrate. In many cases the two processes go hand in hand. This difference is the basis for the distinction, first proposed by Thurmann, between those rocks which weather with difficulty and those which weather readily. The former were called dysgeogenous, the latter eugeogenous. Thurmann restricted the application of the first term to those rocks which produce little soil, but it seems more logical to apply dysgeogenous to those in which disintegration is markedly in excess of decomposition, and eugeogenous to those rocks that break down rather readily into fine soils. With respect to the general character of the soil formed, rocks are pelogenous, clay-producing, psammogenous, sand-forming, or pelopsammogenous, producing mixed clay and sand. The first two are divided into perpelic, hemipelic, oligopelic, perpsammic, etc., with reference to the readiness with which they are weathered, but this distinction is not a very practicable one. The grouping of soils into silicious, calcareous, argillaceous, etc., with reference to the chemical nature of the original rock, is of no value to the ecologist, apart from the general clue to the physical properties which it furnishes.
114. The structure of soils. The water capacity of a soil is a direct result of the fineness of the particles. Since the water is held as a thin surface film by each particle or group of them, it follows that the amount of water increases with the water-holding surface. The latter increases as the particles become finer and more numerous, and thus produce a greater aggregate surface. The upward and downward movements of water in the soil are likewise in immediate connection with the size of particles. The upward or capillary movement increases as the particles become finer, thus making the irregular capillary spaces between them smaller, and magnifying the pull exerted. On the contrary, the downward movement of gravitation water, i. e., percolation, is retarded by a decrease in the size of the soil grains and hastened by an increase. Hence, the two properties, capillarity and porosity, are direct expressions of the structure of the soil, i. e., of its texture or fineness. Capillarity, however, increases the water-content of the upper layers permeated by the roots of the plant, while porosity decreases it. On the basis of these properties alone, soils would fall into two groups, capillary soils and porous soils, the former fine-grained and of high water-content, the latter coarse-grained and with relatively little water. A third factor, however, of great importance must be taken into account. This is the pull exerted upon each water film by the soil particle itself. This pull apparently 79increases in strength as the film grows thinner, and explains why it finally becomes impossible for the root-hairs to draw moisture from the soil. This property, like capillarity, is most pronounced in fine-grained soils, such as clays, and is least evident in the coarser sands and gravels. It seems to furnish the direct explanation of non-available water, and, in consequence, to indicate that the chresard is an immediate result of soil texture.
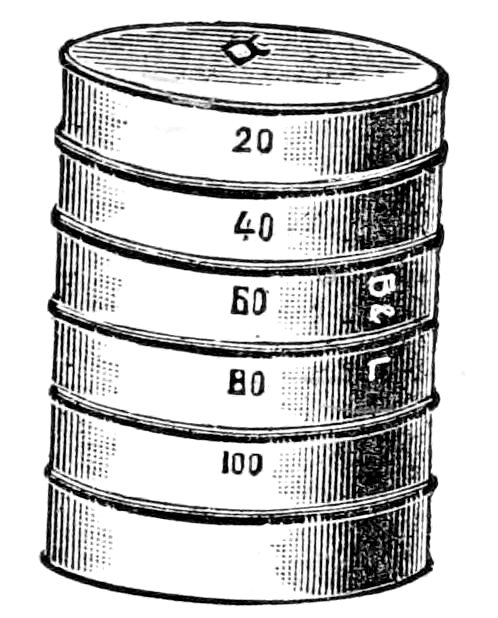
Fig. 25. Sieves for soil analysis.
115. Mechanical analysis. From the above it is evident that, with the same rainfall, coarse soils will be relatively dry, and fine soils correspondingly moist. However, this difference in holard is somewhat counterbalanced by the fact that the chresard is much greater in the former than in the latter. The basis of these relations can be obtained only from a study of the texture of the soil. The usual method of doing this is by mechanical analysis. This is far from satisfactory, since the use of the sieves often brings about the disaggregation of groups of particles which act as units in the soil. Furthermore, the analysis affords no exact evidence of the compactness of the soil in nature, and tests of capillarity and porosity made with soil samples out of position are open to serious error. Nevertheless, mechanical analyses furnish results of some value by making it possible to compare soils upon the basis of texture. For ecological purposes, minute analyses are undesirable; their value in any work is doubtful. A separation of soil into gravel, sand, and silt-clay is sufficient, since the relative proportion of these will explain the holard and chresard of the soil concerned. The latter are also affected in rich soils, especially of forests, by the organic matter present. If this is in a finely divided condition, the amount is determined by calcining. When a definite layer of leafmold is present, as in forests and thickets, its water-value is found separately, since its power of retaining water is altogether out of proportion to its weight.
116. Kinds of soils. It is very doubtful whether it is worth while to attempt to distinguish soils upon the basis of mechanical analysis. Unquestionably, the most satisfactory method is to distinguish them with respect to holard and chresard, and to regard texture as of secondary importance. A series of soil classes which comprise various soil types has been proposed by the U. S. Bureau[7] of Soils as follows: (1) stony loam, (2) gravel, (3) gravelly loam, (4) dunesand, (5) sand, (6) fine sand, (7) sandy loam, (8) fine sandy loam, (9) loam, (10) shale loam, (11) silt loam, (12) clay loam, (13) clay, (14) adobe. These are based 80entirely upon mechanical analyses, and in some cases are too closely related to be useful. The line between them can nowhere be sharply drawn. Indeed, the variation within one class is so great that soils have frequently been referred to the wrong group. Thus, Cassadaga sand (gravel 22 per cent, sand 43 per cent, silt 21 per cent, clay 10 per cent) is more closely related to Oxnard sandy loam (26–37–18–12) and to Afton fine sandy loam (28–43–18–8) than to Coral sand (61–29–3–4), Galveston sand (6–91–1–1), or Salt Lake sand (84–15–1–0). Elsinore sandy loam (8–38–35–10) is much nearer to Hanford fine sandy loam (9–36–33–14) than to Billings sandy loam (1–60–22–11) or to Utuado sandy loam (48–23–19–8). The soil types are much more confused, and for ecological purposes at least are entirely valueless. Lake Charles fine sandy loam has the composition, 1–34–52–9; Vernon fine sandy loam, 1–37–54–7, while many other so-called types show nearly the same degree of identity.
117. The chemical nature of soils. The effect of alkaline and acid substances in the soil upon water-content and the activities of the plant is far from being well understood. It is generally recognized that salts and acids tend to inhibit the absorptive power of the root-hairs. In the case of saline soils, this inhibitive effect seems to be established, but the action of acids in bogs and swamps is still an open question. It is probable that the influence of organic acid has been overestimated, and that the curious anomaly of a structural xerophyte in a swamp is to be explained by the stability of the ancestral type and by the law of extremes. Apart from the effect which excessive amounts of acids and salts may have in reducing the chresard, the chemical character of the soil is powerless to produce structural modification in the plant. Since Thurmann’s researches there has been no real support of the contention that the chemical properties of the soil, not its physical nature, are the decisive factors in the distribution and adaptation of plants. It is not sufficient that the vegetation of a silicious soil differs from that of a calcareous one. A soil can modify the plants upon it only though its water-content, or the solutes it contains. Hence, the chemical composition of the original rock is immaterial, except in so far as it modifies these two factors. Humus, moreover, while an important factor in growth, has no formative influence beyond that which it exerts through water-content.
PHYSIOGRAPHY
118. Factors. The physiographic factors of a definite habitat are altitude, exposure, slope, and surface. In addition, topography is a general though less tangible factor of regions, while the dynamic forces of weathering, 81erosion and sedimentation play a fundamental role in the change of habitats. It is evident, however, that these, except where they affect the destruction of vegetation directly, can operate upon the plant only through more direct factors, such as water, light, and temperature. While they are themselves not susceptible of measurement, they can often be expressed in terms of determinable factors, i. e., slope, exposure, and surface. Fundamentally, they constitute the forces which change one habitat into another, and, in consequence, are really to be considered as the factors which produce succession. The static features of physiography, altitude, etc., lend themselves readily to determination by means of precise instruments. These factors, though by no means negligible, are remote, and consequently their mere measurement is insufficient to indicate the nature or extent of their influence upon the plant. It is necessary to determine also the manner and degree in which they affect other factors, a task yet to be done. Readings of altitude, slope, and exposure are so easily made that the student must carefully avoid the tendency to let them stand at their own value, which is slight. Instead, they should be made the starting point for ascertaining the differences which they produce in water-content, humidity wind, and temperature.
Altitude
119. Analysis into factors. Of all physiographic features, altitude is the most difficult to resolve into simple factors. Because of general geographic relations, it has a certain connection with rainfall, but this is vague and inconstant. Obviously, in its influence upon the plant, altitude is really pressure, and in consequence its effect is exerted upon the climatic and not the edaphic factors of the habitat. Theoretically, the decrease of air pressure in the increased altitude directly affects humidity, light, and temperature. Actually, while there is unquestionably a decrease in the absorption of the light and heat rays owing to the fact that they traverse less atmosphere, which is at the same time less dense, this seems to be negligible. Photometric readings at elevations of 6,000 and 14,000 feet have so far failed to show more than slight differences, which are altogether too small to be efficient. The effect upon humidity is greater, but the degree is uncertain. Continuous psychrographic records at different elevations for a full season, at least, will be necessary to determine this, since the psychrometric readings so far made, while referred to a base psychrograph, are too scattered to be conclusive. Finally, the length of the season, itself a composite, is directly dependent upon the altitude. This relation, though obscure, rests chiefly upon the rarefaction of the air which prevents the accumulation of heat in both the soil and the air.
82
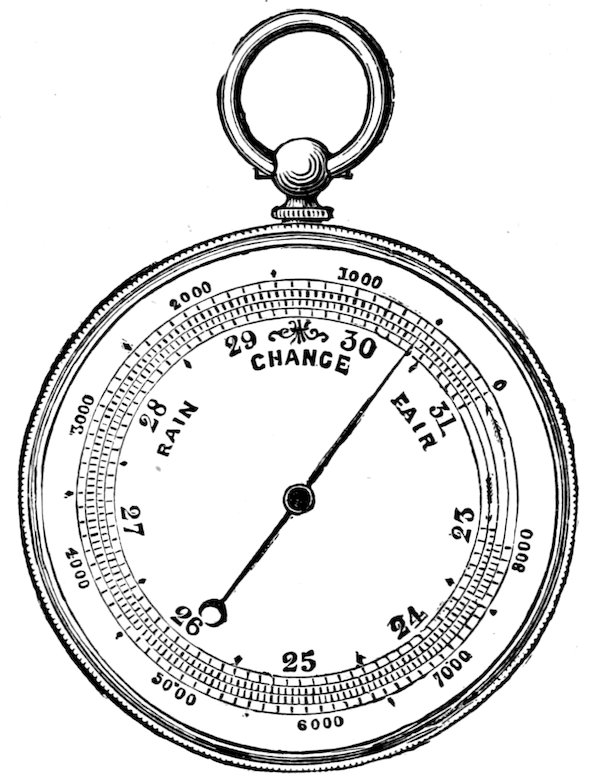
Fig. 26. Aneroid barometer.
120. The barometer. To secure convenience and accuracy in the determination of altitude, it is necessary to use both a mercurial and an aneroid barometer. The latter is by far the most serviceable for field work, but it requires frequent standardizing by means of the former. The mercurial form is much more accurate and should be read daily in the base station. It is practically impossible to carry it in the field, except in the so-called mountain form, which is of great service in establishing the altitudes of a series of stations. In use the aneroid barometer may be checked daily by the mercurial standard, or it may be set at the altitude of the base station, thus giving a direct reading. After the normal pressure at the base has once been ascertained, however, the most satisfactory method is to set the aneroid each day by the standard, at the same time noting the pressure deviation in feet of elevation (see p. 46). The absolute elevation of the various stations of a series may be determined either by adding or subtracting this deviation from the actual reading at the station, or by noting the change from the base station, and then adding or subtracting this from the normal of the latter. When it is impossible to check the aneroid by means of a mercurial barometer, the average of a series of readings made at different days at one station, especially if taken during settled weather, will practically eliminate the daily fluctuations, and yield a result essentially accurate. Even in this event, the accuracy of the aneroid should be checked as often as possible, since the mechanism may go wrong at any time. The barograph, while a valuable instrument for base stations, is not at all necessary. These instruments can be obtained from all makers of meteorological apparatus, such as H. J. Green, and J. P. Friez. Aneroid barometers reading to 16,000 feet cost about $20; the price of the Richards aneroid barograph is $45. Ordinary observatory barometers cost $30–$40; the standard instrument sells at $75–$100. The mountain barometer, which is altogether the most serviceable for the ecologist, ranges from $30–$55, depending upon accessories, etc.
83
Slope
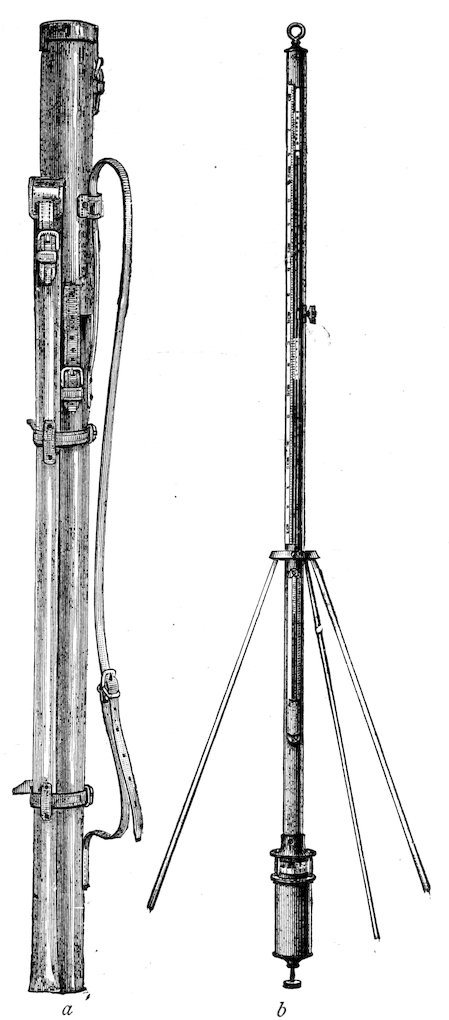
Fig. 27. Mountain barometer: (a) in carrying case; (b) set up for use.
121. Concept. This term is used in the ordinary sense to indicate the relation of the surface of a habitat to the horizon. Although it is a complex of factors, or rather influences several factors, these are readily determinable. The primary effect of slope is seen in the control of run-off and drainage, and consequently of water-content, although these are likewise affected by soil texture and by surface. Slope, moreover, as a concomitant of exposure, has an important bearing upon light and heat by virtue of determining the angle of incidence, and also upon wind, and, through it, upon the distribution of snow. At present, while it can be expressed definitely in degrees, it has not yet been connected quantitatively with more direct factors. This is, however, not a difficult task, and it is probable that we shall soon come to express slope principally in amount of run-off, and of incident heat.
122. The clinometer. In the simplest form, this instrument is merely a semicircle of paper, with each half graduated from 1–90°. It is mounted on a board and placed base upward, upon a wooden strip, 2 feet long and 2 inches wide, which has a true edge. At the center of the circle is attached a line and plummet for reading the perpendicular. A more convenient form is shown in figure 28, which is both clinometer and compass. This also necessitates the use of a 84basing strip to eliminate the inequalities of the surface. The dial face is graduated to show inches of rise per yard, as well as the number of degrees, but the latter, as the simpler term, is preferable for ecological work. In making a reading, the basing strip is placed upon a representative area of the slope, and pressed down firmly to equalize slight irregularities. The clinometer is moved slightly along the upper edge, causing the marker to swing freely. After the latter comes to rest, the instrument is carefully turned upon its back, when the angle of the slope in degrees may be read directly. Two or three such readings in different areas will suffice for the entire habitat, unless it be extremely irregular. The clinometer with compass may be obtained from the Keuffel and Esser Company, 111 Madison St., Chicago, Illinois, for $5.
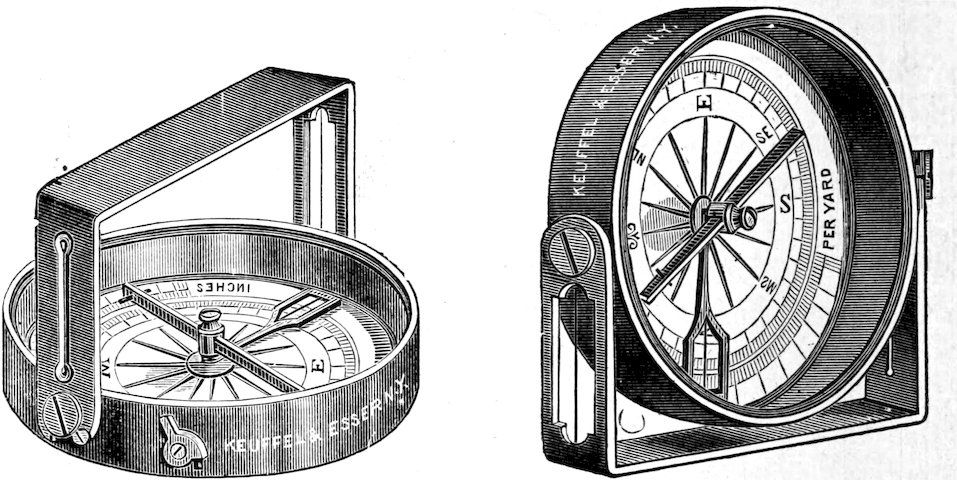
Fig. 28. Combined clinometer and compass.
123. The trechometer. For measuring the effect of slope upon run-off, a simple instrument called the trechometer (τρέχω, to run off) has been devised. This consists merely of a metal tank, 3 × 4 × 12 inches, holding 144 cubic inches of water, with an opening ¼ × 12 inches at the base in front, closed by a tight-fitting slide. Three metal strips, 2 × 12 inches, are fastened to the front of the tank in such a way as to enclose a square foot of soil into which the strips penetrate an inch. In the front strip is an opening, 1 inch square, provided with a drip from which the run-off is collected in a measuring vessel. In use, the instrument is put in position with the metal rim forced down 1 inch into the soil; the tank is filled, the graduate put in place, and the slide raised. The run-off for a square foot is the amount of water caught by the graduate, and is represented in cubic inches per square foot. For obtaining results which express slope alone, comparisons must be made upon the same soil, from which all cover, dead and living, has been removed. They must be as closely together in time as possible, at least during the same day, as rain or evaporation will 85cause considerable error. It is obvious that with the same slope or on a level the trechometer may also be used to advantage to determine the absorptive power of soils of different texture. It serves well a similar purpose when used in different habitats to measure the composite action of slope, soil, and cover in dividing the rainfall into run-off and absorbed water.
Exposure
124. Exposure refers primarily to the direction toward which a slope faces, i. e., its exposition or insolation with respect to sun and wind. It is not altogether separable from slope, however, inasmuch as the angle of the slope has some effect upon the degree of exposure. The chief influence of exposure is exerted through temperature, since slopes longest exposed to the sun’s rays receive the most heat. This is supplemented in an important degree by the fact that a group of rays 1 foot square will occupy this area only on slopes upon which they fall at right angles. In all other cases the rays are spread over a longer area, with a consequent reduction in the amount of heat received. This effect is felt principally in evaporation from the soil, and in soil temperatures. For the leaf, it is largely if not entirely negligible, since the angle of incidence is determined by the position of the leaf, which is the same for each species whether on the level or upon a slope. On this account, exposure has little or no bearing upon light, except that the total amount of light received by the aggregate vegetation of a slope will be greater than for a level area of the same size. The effect of wind varies with the exposure. It is naturally most pronounced in those directions from which the prevailing dry or cold winds blow, and it is greatly emphasized by the fact that the opposite exposure is correspondingly protected. The influence of wind, especially in producing evaporation from the plant and the soil, increases with the slope, since the mutual protection of the plants, or that afforded the soil by the cover, is much reduced. Finally, the distribution of the snow by the wind, a matter of considerable importance for early spring vegetation, is largely determined by exposure.
Exposure is expressed directly in terms of direction, to which is added the angle of the slope. A good field compass, reading to twelve points, is sufficient. It should be checked, of course, by the declination of the needle at the place under observation. A convenient instrument is the one already mentioned, in which compass and clinometer are combined, since these are regularly used at the same time.
125. Surface. The most important consideration with respect to surface is the presence or absence of cover, and the character of the latter. With 86the exception of snow, cover is, however, a question of vegetation, living and dead, and consequently is to be referred to the discussion of biotic factors. The surface of the soil itself often shows irregularities which must be taken into account. Such are the rocks of boulder and rock fields, the hummocks of meadows and bogs, the mounds of prairie dog towns, the innumerable minute gullies and ridges of bad lands, the raised tufts of sand-hills, etc. The influence of these is not profound, but they do have an appreciable effect upon the run-off, temperature, and wind. In many cases, this is distinctly measurable, but as a rule little more can be done than to indicate that the surface is even or uneven, and to describe the degree and kind of unevenness.
126. Record of physiographic factors. Altitude, slope, exposure, and surface are essentially constant factors, and are determined once for all, after a few check readings have been made, except in those relatively rare habitats in which dynamic forces are very active. The form of record used is the following:
DATE FORMATION STATION GROUP ALTITUDE SLOPE EXPOSURE SURFACE
10/7/02 Gravel slide Golf Links Eriogonare 2700 m. 23° N.N.W. Even
„ Brook bank Jack Brook Violare 2550 m. 5° E.N.E. „
„ Half gravel Hiawatha Achilleare 2600 m. 14° E. Uneven
„ Spruce Milky Way Opulasterare 2625 m. 12° N. Even
127. Topography. As heretofore indicated, questions pertaining to the form and development of the land concern groups of habitats within which each habitat is the unit of investigation after the manner already laid down. A knowledge of topography is essential to the accurate mapping of a region, for which the simple methods of plane table and contour work are employed, while the geology of the surface is of primary importance in the study of successions.
BIOTIC FACTORS
128. Influence and importance. Biotic factors are animals and plants. With respect to influence they are usually remote, rarely direct. Nevertheless, they often play a decisive part in the vegetation. Their effect is, as a rule, felt directly by the formation rather than the habitat, but in either case the one reacts upon the other. Such factors are not themselves susceptible of exact measurement, but their influence upon the habitat is usually measurable in terms of the physical factors affected. In the case 87of biotic factors, it must be distinctly understood that these are not properly factors of the habitat as a physical complex, but that they are rather to be considered as reactions exerted by the effect, or formation, upon the cause or habitat. This is most especially true of plants.
129. Animals. The activities of man fall into two classes: (1) those that destroy vegetation, and (2) those that modify it. There are rare instances also where the work of man has changed a new or already denuded habitat. In the cases where the vegetation is destroyed, the habitat itself is sufficiently changed to permit the effect to be measured by physical factor instruments. Otherwise, the influence is felt only by the formation, as when man makes possible the migration of weeds, and it can be measured in terms of invasion by the quadrat alone. It becomes especially evident, then, in the case of man’s activities, that where they produce a denuded habitat they are to be regarded as factors in the habitat; when they merely affect the formation, this is not strictly true. The changes wrought by other animals are essentially the same as those produced by man. They are not so marked nor so important, but their relation to habitat and formation is the same. As a rule, however, they affect the habitat much less than they do the formation.
130. Plants. As a dead cover, vegetation is a factor of the habitat proper, but it has relatively little importance, since it occurs regularly during the resting period. Its chief effects are in modifying soil temperature, and in holding snow and rain, and thereby increasing the water-content. By its gradual decay, moreover, it not only adds humus to the soil, but it thereby increases the water-retaining capacity of the latter also. The cover of living vegetation reacts upon the habitat in a much more vital fashion, exerting a powerful effect upon every physical factor of the habitat. The factors thus affected are distinctly measurable though it is often impossible to determine just how much of the factor is directly traceable to the vegetation. This is a simple problem in the case of most aerial factors, especially light, but it is extremely difficult for soil factors, such as water-content and soil texture. In the case of all habitats covered with formations, by far the great majority, it is impossible as well as unnecessary to separate the physical factors of the habitat proper from the reaction upon them which the plant covering exerts. Indeed, the great differentiation of habitats is largely due to the universal principle that in vegetation the effect or formation always reacts upon the cause or habitat in such a way as to modify it. As fundamental causes of succession, the discussion of the various reactions of vegetation is reserved for another place.
88
Methods of Habitat Investigation
131. The use of the various instruments previously described depends largely upon the preponderance of simple instruments or recording ones. The former necessitate a number of well-trained assistants; the latter require only a part of the time of one investigator. For the most satisfactory results, however, an assistant is all but indispensable. Since simple instruments are most easily obtained because of their cheapness, and are especially adapted to purposes of instruction, the method of using them will be described first, and then that of ecograph batteries.
THE METHOD OF SIMPLE INSTRUMENTS
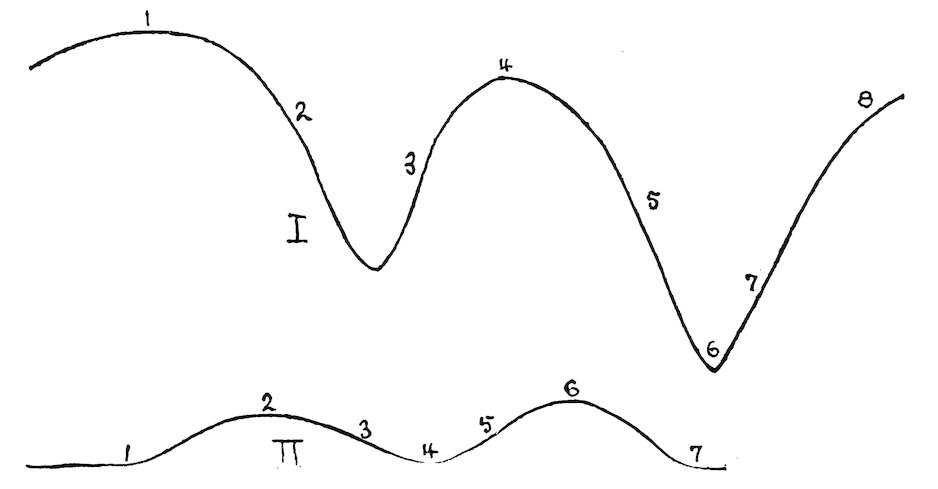
Fig. 29. Series of stations: I, at Minnehaha; II, at Lincoln in the prairie formation.
132. Choice of stations. This method is based upon simultaneous readings by means of simple instruments in a series of habitats, or of stations in a single habitat. Such readings are necessary for the variable atmospheric factors, humidity, light, temperature, and wind. Frequent readings suffice for water-content and precipitation, while only two or three determinations, enough to check out the error, are necessary for the constant factors, altitude, slope, exposure, and surface. An account of the exact procedure employed in class study at Lincoln and Minnehaha will best serve to illustrate the use of this method. The series of stations chosen at Lincoln were primarily within a single formation, for the purpose of determining the physical factor variation in different areas. One series was located in the prairie-grass formation (Koelera-Andropogon-psilium), and consisted of the following stations: (1) low prairie, (2) crest of ridge I, 89(3) northeast slope of ridge I, (4) grassy ravine, (5) southwest slope of ridge II, (6) bare crest of ridge II, (7) thicket ravine. The other series was established in the bur-oak-hickory forest (Quercus-Hicoria-hylium) at the following stations: (1) thicket, (2) woodland, (3) knoll in forest, (4) depression in forest, (5) level forest floor, (6) nettle thicket, (7) brook bank. At Minnehaha the series was primarily one of different formations: (1) the pine formation (Pinus-xerohylium), (2) the gravel slide formation (Pseudocymopterus-Mentzelia-chalicium), (3) east slope of spruce forest (Picea-Pseudotsuga-hylium), (4) ridge in the spruce forest, (5) north slope of spruce forest, (6) brook bank in forest, (7) the thicket formation (Quercus-Cercocarpus-lochmodium), (8) the aspen formation (Populus-hylium). When permanent or temporary quadrats are established, they are ordinarily used as regular stations, since this enables one to refer the physical factor readings to a few definite individual plants, as well as to the entire formation. The transects in figure 29 illustrate two of the above series of stations.
133. Time of readings. The frequency of simple readings and the times at which they are made must be regulated largely by opportunity and convenience. In addition to making readings once or twice a week throughout the season, the series should be read at least once every day for a representative week or two. It is also very desirable to have a series for each hour of a typical day, or of two days, one of which is clear, the other cloudy. When a single daily reading is made, it should be taken at or as near meridian as possible. The usual series is the one obtained by simultaneous observations at the same level in different stations. An important series is also secured by simultaneous readings at the various levels of the same station, though it is not necessary to take this series frequently.
90
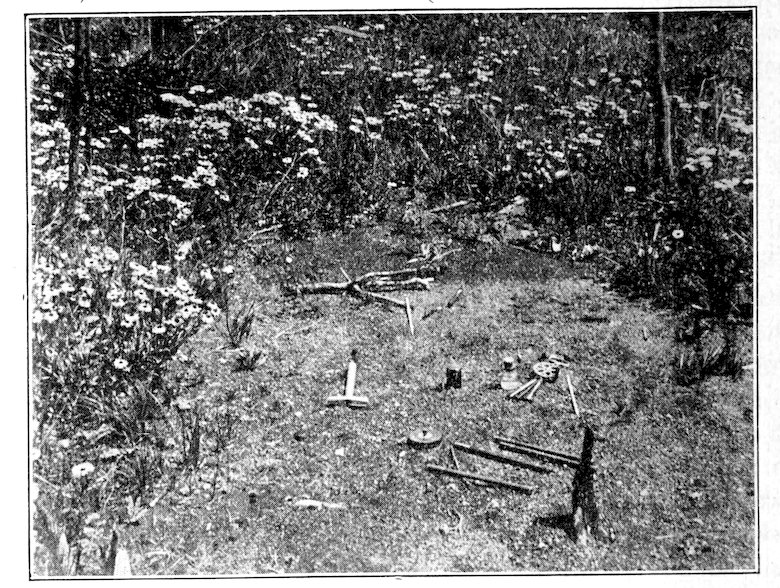
Fig. 30. A denuded station in the aspen formation.
134. Details of the method. After the stations have been selected by a careful preliminary survey of the habitat or series of habitats, their location is indicated by a small flag bearing a number, in case there is no danger of these being disturbed. Otherwise, less conspicuous stakes are used. The ordinary practice is to visit each station of the series, and to take readings of water-content, altitude, slope, and exposure. On the first trip these are all made by the instructor, but after a short time the determination of each factor may be assigned in rotation to each of the students. After these constant factors have been read and recorded, one student is equipped with photometer, thermometer, and psychrometer, and, if desirable, anemometer, and left at the first station. At each succeeding station the same plan is followed, so that at the end of the series the constant factors have all been read, and there is an observer at each station prepared to make readings of the variable ones. The task of acquainting the students with the operation of photometer, psychrometer, etc., can best be done in class or at a previous field period, as it is evident that they must be familiar with the instruments before they can use them accurately in the field series. The details of operation have already been given and need not be repeated here. The task of obtaining readings at the same moment may be met by supplying each observer with a watch, which runs exactly with all the others, or by making observations upon signal. The second means has been found most successful in practice, since the signal fixes the attention at the exact moment. The best plan is for the instructor to occupy a commanding position somewhere near the middle of the series, and to give the signals by shout or whistle at the proper interval. Considerable care and experience are necessary to do the last satisfactorily. Sufficient time must be given for the operation of the instrument and the making of the record. In addition, a period must be permitted to elapse which is long enough for every instrument to reach the proper reading. For example, in a series which contains a gravel slide and a forest, the thermometer which has just been used for an air reading will require four or five times as long an interval to respond to the temperature of the gravel as to that of the cool forest floor. In such series, the instructor should regularly take his place in the station where 91the response is slowest or greatest. He must record the exact time of each signal, and note any general changes of sky or wind that produce temporary fluctuations at the time of reading. When the readings extend over a whole day, the usual plan is to begin at the last station and take a second series of water-content samples, noting the exact time in order that the rate of water loss may be determined. A check series of physiographic factors may be made at this time also, or this may be left for future visits. While it is unnecessary to take soil samples oftener than once a day, it is important to make at least one series at each visit. Sometimes it becomes desirable to know the rate of water loss in different stations during the day, and in this event, samples are taken at one or two hour intervals for the entire day.
In making simultaneous readings at the different levels of one station, the observers are grouped in one spot in such a way that they do not interfere with the correct reading of each instrument. Readings of this sort are most valuable in the case of temperature, which shows greater differences at the various levels. Important differences of humidity and wind also are readily obtained, and, in layered formations, marked variations in the amount of light. In the open, the ordinary levels for temperature are 6 feet, 3 feet, surface, 5, 10, and 15 inches in the ground, and for wind and humidity, 6 feet, 3 feet, and surface. In forests the same levels are used for comparison with formations in the open, but a more desirable series for light especially is secured by making readings at the height of, or better, just below the various layers. Series of this sort are likewise made on signal. The best time of day is that of a period in which the middle station is read near meridian, since the variation due to time is sufficiently small to permit fairly accurate comparisons between the readings for the different stations.
135. Records. The form used for recording the observations made by means of simple instruments is shown below. It is hardly necessary to state that it may be readily modified to suit the needs of different investigators. Ordinarily, each sheet is used for the records of one habitat or series alone, but for convenience sake, the records of two different series are here combined. The figures given are taken from records for the prairie and forest formations at Lincoln.
92
Koelera-Andropogon-psilium
April 25, 1901. Clear. South wind.
TEMPERATURE LIGHT HUMIDITY WATER-CONTENT WIND
TIME P.M. 3:20 3:24 3:30 3:35 3:40 3:45 3:55 % 2:40 3:05
STATION 1½ m. Surf. 5 10 15 1½ m. Surf. 1½ m. Surf. 5 10 15 1½ m. Surf.
1. 27.8 29.6 17.8 15.8 10.9 57 59 17.7 14.6 17.4 740 280
2. 26.5 31.3 18.3 16.6 12.8 59 59 17.9 12.2 14.3 1100 510
3. 26.9 28.5 18.2 14.2 13.5 58 59 16.5 16.9 19 980 520
4. 26.2 30 16.8 13.2 11.6 63 66 24.4 21.3 24.8 920 460
5. 28 32.4 18.6 14.6 14.2 59 60 10.7 17 17.2 1080 490
6. 28 40.8 23.8 16 15 51 51 5 8.3 10.3 1010 410
7. 26.4 30.8 16 13 11 68 70 27 24.3 21.4 680 52
Quercus-Hicoria-hylium
April 20, 1901. Clear. Southeast wind.
TEMPERATURE LIGHT HUMIDITY WATER-CONTENT WIND
TIME A.M. 10:40 10:46 10:50 10:55 11:00 12:00 12:05 11:10 11:20 % 11:30 11:45
STATION 1½ m. Surf. 5 10 15 1½ m. Surf. 1½ m. Surf. 5 10 15 1½ m. Surf.
1. 16 25 9.6 8.4 7.8 .08 .06 73 81 24.2 19.2 19.5 298 0
2. 16.2 30.5 8.5 8.4 7.8 .11 .09 73 86 22 22.5 19.4 375 2
3. 16.2 17.8 7.6 7.8 8 .08 .06 73 95 22.1 20.4 21.6 640 6
4. 15.6 26.2 10.6 8.4 8.2 .06 .03 81 95 25.4 23.1 22.4 275 12
5. 17.6 25.4 7.6 7.4 7.2 .03 .02 90 95 27.2 19.8 18.8 178 2
6. 16.2 20.2 8.4 7 6.2 .02 .01 82 90 27.6 20.8 18.8 115 4
7. 15.8 17.2 6.4 6.4 6.1 .05 .04 82 90 23.8 19 19.3 60 0
METHOD OF ECOGRAPH BATTERIES
136. A battery of recording instruments consists of a selagraph, a psychrograph, and a thermograph, to which an anemograph is added when possible. As stated before, the determination of water-content by the geotome method is more satisfactory than by any automatic instrument yet devised. When the base station is located where the sunlight is unobstructed, which should be the case whenever possible, it is unnecessary to include a selagraph in those batteries placed in similarly exposed stations, since the light values will be the same. As a rule, batteries are established within different zones or different habitats, except where a highly diversified habitat is made the subject of special inquiry. Such a restriction arises from the fact that expense, care of operation, etc., place a limit upon the number of batteries, 93and, in such case, the task of primary importance is to establish the physical character of representative habitats. For these reasons, the first series of thermographs established in 1903 was located with respect to altitude, the instruments being placed at Manitou 2,000 m., Minnehaha, 2,600 m., and Mount Garfield 3,800 m. In 1904, the stations established for the record of temperature and humidity were situated with respect to habitats representing the four formations: gravel slide, half gravel slide, spruce forest, and brook bank.
The batteries are located and set up according to the directions already given. A 2–meter quadrat with the battery as the middle is staked and mapped. Within this, all readings of water-content, soil temperature, and physiographic factors are made. Altitude, slope, exposure, and cover are recorded when each battery is located, and a soil sample is taken for mechanical analysis. When the position of the batteries permits it, water-content readings should be made frequently, once or twice a week at least. In addition, a complete series of samples should be taken daily for a period sufficient to indicate the ordinary extremes of water-content.
The ecograph battery of each habitat constitutes a standard to which the results obtained by simple instruments may be referred with accuracy. It not only does this, but it also serves as a basis for interpreting the readings of simple instruments in distant habitats of the same character. In this way a few batteries judiciously placed make possible the exact physical investigation of a large number of habitats, covering a considerable area. The only limit, indeed, upon this method is that placed by time. The proportionate use of batteries and of simple instruments must be largely determined by the conditions which confront the investigator. It is obvious that, where expense is not a decisive factor, the gain in time and in completeness of results is enormously in favor of the battery. There is an additional value in the automatic and continuous record which can not be overlooked. When the use of instruments in the study of habitat and formation becomes universal, the importance of the ecograph will be immeasurably enhanced. It will be possible to secure duplicate records of batteries located in the most remote and diverse regions, from the equator to the poles, and comparative phytogeography upon a scientific basis will for the first time be possible. This opens an alluring vista of the future when ecologists the world over will cooperate in such a way that the results obtained by ecograph batteries anywhere on the globe will permit of exact comparison.
94
THE EXPRESSION OF PHYSICAL FACTOR RESULTS
137. The form of results. It is almost inevitable that the general adoption of precise methods of measuring the habitat will result in a common form for expressing the physical character of the latter. An actual diagnosis of each habitat is not a difficult matter, after the factors are carefully measured, and will unquestionably lead to very desirable definiteness and precision. The accurate investigation of the physical factors of a number of habitats for one growing season furnishes the necessary material for a diagnosis based upon the mean for the growing season. Similar results for two or three seasons will yield a diagnosis as accurate and as final as that of a formation, or, indeed, as that of many species. The author’s investigations have not yet gone far enough to warrant proposing a final form for this, but the following diagnosis is offered as a suggestion:
Elymus-Muhlenbergia-chalicium. Habitat: holard 9 per cent, chresard 8 per cent, relative humidity 40 per cent, light 0.6, soil colluvial gravel (gravel 70 per cent, sand 27 per cent, silt 3 per cent), air temperature 65°, surface 82°, soil 59°, wind 10 miles, rainfall 8 inches, altitude 2,800 m., slope 23°, exposure south, surface even, cover open, no active biotic agencies.
The detailed comparison of habitats is made most readily by the graphic method of curves, which constitute the most desirable form of expression in connection with the original record upon which they are based. Factor means are particularly desirable for diagnostic purposes, and they furnish valuable curves also. Factor sums are impracticable at present, and it seems doubtful that they will ever be of much value. It is by no means impossible, however, that a more detailed and exact knowledge of the physiology of adaptation, coupled with methods of precision in the habitat, will render them necessary.
Factor Records
138. Experience has shown that the practice of making hasty and often formless records in the field is unwise and is apt to be inaccurate as well. The time saved in the field is more than counterbalanced by that consumed in copying the results into the permanent form. The danger of error in field notes rapidly taken is very grave, and the chance of confusion and the waste of time in deciphering them are great. Moreover, the task of checking a copy with the original, which is absolutely necessary for accuracy, involves a further expenditure of time and energy. For these reasons the field record should be made in permanent form. Definite record sheets are used, and the invariable rule is made that all readings are to be noted in ink at the time and spot where they are taken. On a long journey, or in the face of 95many observations, the tendency to take notes or to record observations rapidly is very great, but this will correct itself after a few attempts to use such notes. The record forms for various factors have been indicated in the proper place, as well as the one for simultaneous readings. Ecograph sheets are carefully filed, and constitute permanent records. With a little practice they may be read almost as easily as tables, and any attempt to put them into tabular form is a mere waste of time. For purposes of study and of publication, it often becomes necessary to bring together all the results obtained for a particular habitat, both by simple instruments and by ecographs. The form of record used for this is essentially that already indicated for simultaneous readings on page 92, since general features and constant factors can not well be included in the table. Record sheets of this type have been printed at a cost of $5 per thousand, and the various factor records can be obtained at about the same rate. The size of sheet used is 9½ × 7¾ inches. The record book is the usual notebook cover, which has been found neither too large nor too small. It is protected from dirt and rain by a covering of oilcloth which overlaps the edges. Record books should be carefully labeled, and each one should contain a single year’s records.
Factor Curves
139. Plotting. The paper employed is divided into centimeter squares which are subdivided into 2–millimeter units. For ordinary curves the size of sheet is 9½ × 7¾ inches, which makes it possible for curve sheets to be filed in the record book. Tablets containing 60 of these sheets can be obtained for 20 cents each from the Central School Supply House, Chicago. For curves longer than 9 inches special sizes of sheets must be used. On account of their inconvenience large sheets are avoided whenever possible. This can usually be accomplished by increasing the numerical value of the intervals. The inks employed in plotting are the waterproof inks of Chas. Higgins & Co., Brooklyn, New York. These are made in ten or more colors, black, violet, indigo, blue, green, yellow, orange, brown, brick red, carmine, and scarlet, and cost 25 cents per bottle. In addition to being waterproof, they make it possible to combine curves in all conceivable ways without destroying their identity. Furthermore, it is a great advantage to use the same color invariably for the same kind of curve: thus, it has been the practice to indicate the 3–foot, surface, 5, 10, and 15–inch temperature curves by violet, green, yellow, blue, and carmine respectively. A fine-pointed pen, such as the Spencerian No. 1, is most satisfactory for inking; drawing pens, such as Gillott’s Crowquill, are too finely pointed for ordinary use.
96In plotting a curve, it is first necessary to determine the value of the interval, and the extreme range of the curve or combination. For example, in the case of temperature, it is most convenient to assign a value of 1° Centigrade to each centimeter, since the thermometers used read to one-fifth of a degree, which corresponds exactly to the 2–millimeter units of each square. The length of the sheet permits a range of 22 degrees Centigrade, and the actual limits must be determined for the particular results to be employed. For the same region, it is very desirable that the unit interval and the range be the same, in order that all curve sheets may admit of direct comparison. Indeed, it is greatly to be hoped that in the future ecologists will agree to a uniform system of curve-plotting, cartography, etc., as the geographers are beginning to do in the construction of maps. The major intervals are written, or, better, typewritten, at both sides of the sheet, and the time or space intervals are indicated at the top. Each curve sheet is properly labeled, and essential data indicated. The readings are taken from the field record, and their proper positions indicated by a dot. These are connected first by a pencil line, the curves being made abrupt rather than flowing; and the line, after having been carefully checked, is traced in ink.
140. Kinds of curves. Curves are named both with reference to the factor concerned and the position or sequence of the readings. The factors which lend themselves most readily to this method of representation are the variable ones, water-content, humidity, light, temperature, and wind, and corresponding curves are distinguished. Altitude and slope may likewise be shown by means of curves, but the use of cross section or contour lines serves the same purpose and is more natural. With regard to time and position, curves are distinguished as level, station, and point curves. A level curve is one based upon readings made at the same level through a series of stations or of habitats, e. g., the level curve of surface temperature. The station curve represents the various levels or points at which readings are made in a single station. The point curve has for a basis the hourly or daily variation of a factor at a particular point or level in a station. All of these may be simple curves, when established upon a single reading for a series, or mean curves when they are based upon the mean of a number of readings. Curves which show the extremes of a factor, i. e., the maximum and minimum, are also extremely valuable, though a combination of the two for comparison is preferable.
141. Combinations of curves are invaluable for bringing similar curves together, and permitting ready comparison of them. For this, and also because they save space, they are regularly employed to the almost complete 97exclusion of single curves. Combinations are made simply by tracing the curves to be compared upon the same sheet, it being understood that dissimilar curves, e. g., level and station, can not be combined. Colored inks are an absolute necessity in combining; the primary principle underlying their use is that curves that approach closely or cross each other must be traced in inks that contrast sharply. As elsewhere stated, it has been made the invariable rule to use the same color for the same level or point. This applies especially to temperature, but holds also for humidity, light, wind, and water-content, so that the color always indicates the level. For the same reason, it is applied to a combination of point curves for one station, though it is inapplicable to a series of point curves when these lie in the same level. Light readings above 6 feet and water-content readings below 15 inches necessitate the use of additional colors.
Combinations may be made of the curves of a single factor for purposes of comparison, or they may consist of curves of different factors in order to aid in interpreting or indicating their relation to each other. Curves of the same factor may be combined to form various series. The level series consists of all the level curves for the stations under observation, e. g., the six levels for temperature, three levels for wind, etc. Similarly, the station series is a combination of all the station curves, and a corresponding arrangement may be made for point curves with reference either to station or to level. An extremely valuable combination of curves is that of the holard and chresard for a series of stations. The most important combinations of the curves of different factors are naturally those based upon factors intimately related to each other or to the plant. The grouping of water-content and humidity curves is of great value, especially when the transpiration curve is added. Light and temperature curves make an interesting combination, while a humidity, temperature, and wind series is of much aid in tracing the connection between these factors. Finally, it is altogether feasible to arrange the curves of water-content, humidity, light, temperature, and wind upon the same sheet in such fashion as to give a graphic representation of the whole physical nature of a single habitat or a series. In all combinations of curves representing different factors, it must be borne in mind that the position of a curve does not represent a definite value with reference to the others, since some are based upon per cents, others upon degrees, etc. The comparison must be based upon the character of the curves, but even then it is an important aid. An instructive grouping has been employed where series of readings on the same day, or on two successive days in forest and in prairie have yielded the usual level series of curves. The series for the two habitats are arranged on the same page, one at the right and the other at the left, and permit direct 98comparison of corresponding level or factor curves, both with respect to position and character.