PHYSICAL ANTHROPOLOGY (continued 2)
Reading edition
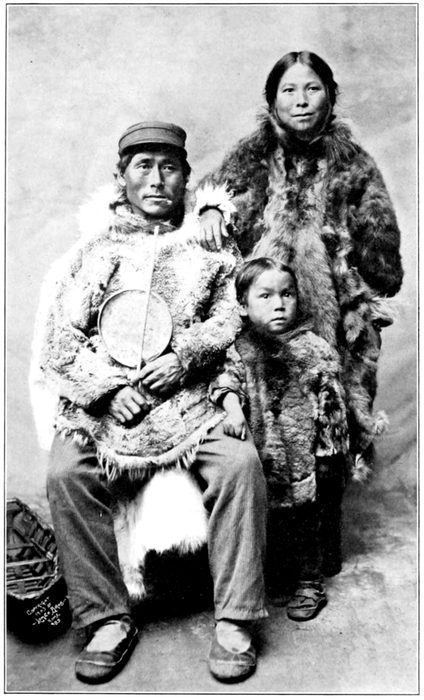
Eskimo, Indianlike; Northern Bering Sea Region
(Photo by Lomen Bros.)
BUREAU OF AMERICAN ETHNOLOGY FORTY-SIXTH ANNUAL REPORT PLATE 56
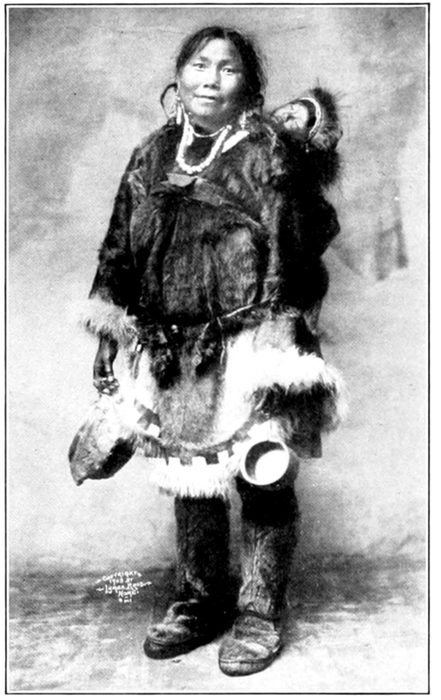
Eskimo, Indianlike; Arctic Region
(Photo by Lomen Bros.)
BUREAU OF AMERICAN ETHNOLOGY FORTY-SIXTH ANNUAL REPORT PLATE 57
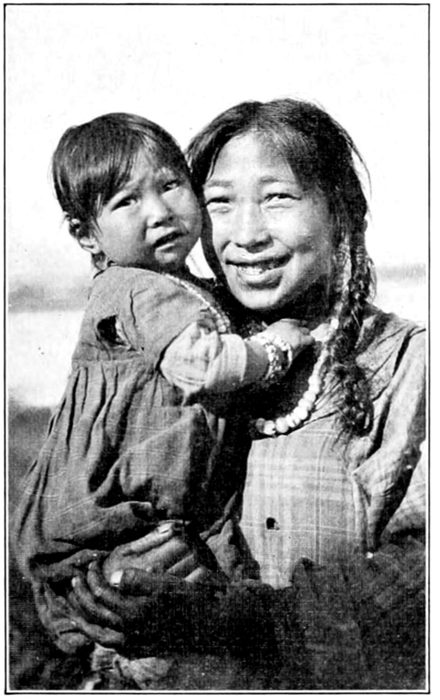
Siberian Eskimo and Child, Indian Type
BUREAU OF AMERICAN ETHNOLOGY FORTY-SIXTH ANNUAL REPORT PLATE 58
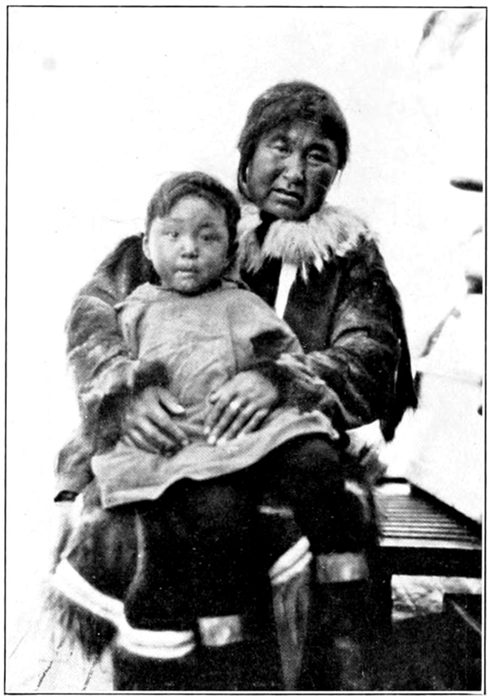
a, Mrs. Sage, Kevalina. Fine Indian type. Born on Notak. Both parents Notak "Eskimo." (A. H., 1926.)
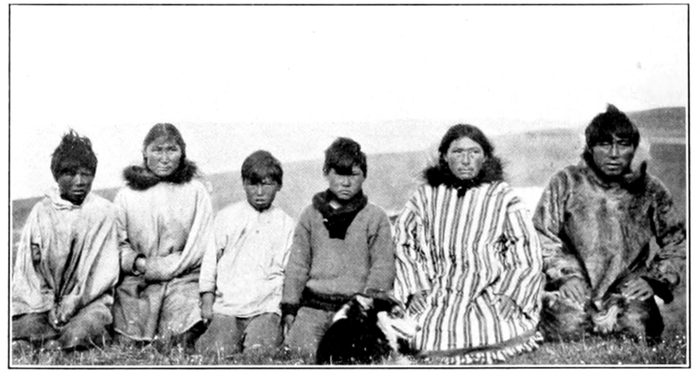
b, Eskimo family, Indianlike; near Barrow. (A. H., 1926.)
Western Eskimo: Measurements on the Living
[Measurements by Collins and Stewart, except as noted]
Males—Locality Females—Locality
Kulukak Togiak Tanunuk (Nelson Island) Nunivak Island Hooper Bay Marshall, Lower Yukon St. Lawrence Island Kanakanak, Bristol Bay Nunivak Island Hooper Bay St. Lawrence Island
Date of record (1927) (1927) (1927) (1927) (1927) (1927) (1912) (1927) (1927) (1927) (1912)
Age Adult. Adult. Adult. Adult. Adult. Adult. Adult. Near adult. Adult. Adult. Adult.
Stature 160.6 166 162.7 161.8 162.5 163.8 163.3 147.8 153.1 153 151.35
Height sitting 86 89.75 90.62 88.86 89.48 90.22 88.4 (83.08) 84.36 83.80 84.07
Height-sitting-stature index 53.55 53.95 55.69 55.70 55.06 55.08 54.13 (56.21) 55.10 54.77 55.55
Arm span vs. stature +2.8 +6.7 +5.5 +2.7 +.7 +5.1 +.6 +1.5 -.7 (?) -.7
Head:
Length 19.06 18.95 19.37 19.70 19.13 19.05 19.33 18.10 18.85 18.85 18.56
Breadth 15.56 15.70 15.37 15.48 15.57 15.85 15.40 15.26 15 15.30 14.77
Height[140] 12.98 13.02 12.90 13.07 13.11 13.43 13.23 13.01 12.81 12.90 12.76
Cephalic module 15.87 15.89 15.88 16.08 15.94 16.11 15.99 15.46 15.55 15.68 15.36
Cephalic index 81.7 82.9 79.4 78.6 81.3 83.3 79.7 84.3 79.6 81.2 79.6
Mean height index 75 75.2 74.3 74.3 75.6 77 76.2 79 79 75.5 76.6
Face:
Menton-crinion 19.70 20.05 19.70 19.23 19.41 19.85 20.01 18.73 18.45 18 18.03
Menton-nasion 12.89 12.87 12.58 12.74 12.47 12.78 12.68 (11.79) 12.11 11.50 11.31
Diameter bizygomatic maximum 14.74 15.27 14.95 14.99 14.97 14.85 14.73 (13.95) 14.31 14.55 14.03
Physiognomic facial index 72.3 76.2 75.9 78.2 77.1 74.8 73.6 (62.9) 77.6 80.8 77.8
Anatomical facial index 87.4 84.2 85.7 85 83.3 86.1 86.7 84.6 84.6 79 80.6
Height of forehead (nasion-hair line) 6.81 7.18 7.12 6.49 6.94 7.07 7.33 6.94 6.34 6.50 6.72
Breadth of forehead (diameter front—minimum) 10.26 10.75 10.65 10.54 10.35 10.38 10.94 10.62 10.38 10.65 10.58
Diameter bigonial 11.78 11.18
Nose:
Height 5.65 6.03 5.57 5.58 5.48 5.42 5.47 (5.02) 5.17 4.89
Breadth 3.88 3.82 3.85 3.89 3.89 3.60 3.93 (3.35) 3.59 3.63
Nasal index 68.7 63.7 69.1 69.8 71 66.4 71.9 66.7 69.4 74.4
Mouth: Breadth 5.64 5.82 5.70 5.87 5.74 5.70 5.60 (4.81) 5.56 5.32
Ear (left):
Height 6.71 7.17 7.18 7.05 6.79 6.52 7.40 (5.99) 6.49 6.60 6.73
Breadth 3.76 3.82 3.72 3.91 3.69 3.38 4.04 (3.49) 3.45 3.45 3.57
Ear index 56.4 53.3 58.9 55.5 54.3 51.9 54.6 (58.3) 53.1 52.3 53
Chest:
Breadth 29.58 29.65 29.70 29.97 29.96 (27.43) 28.63
Depth 24.10 24.35 24.75 24.63 23 (19.39) 22
Chest index 81.5 82.1 83.3 82.2 76.7 [141](70.7) 76.8
Hand (left):
Length 17.35 17.87 17.55 18.42 17.61 18.12 17.94 (15.90) 16.62 16.85 16.60
Breadth 8.68 8.60 8.90 8.81 8.76 8.70 8.63 (7.53) 7.82 8.20 7.78
Hand index 52.9 48.1 50.7 47.8 49.7 48 48 47.4 47.1 48.7 46.7
Foot (left):
Length 24.82 24.05 24.31 23.88 24.07 (22.08) 22.27 22.15 21.98
Breadth 9.88 9.90 9.81 9.40 9.61 (8.55) 8.85 8.65 8.59
Foot index 37.8 41.2 40.4 39.4 39.9 (38.7) 40.6 39.1 39.1
Leg: Circumference, maximum 32.62 34.42 33.56 33.64 (32.39) 32.12 29.70 32.33
FOOTNOTES:
Present Data on the Skull and other Skeletal Remains of the Western Eskimo
THE SKULL
Until recently collections of skeletal remains of the western Eskimo were confined largely to skulls. The material in our own institutions comprised a small collection of Mahlemut (St. Michael Island) and "Chukchee" (Asiatic Eskimo) crania made in the early sixties by W. H. Dall; a larger series of crania gathered in 1881 on St. Michael and St. Lawrence Islands by E. W. Nelson; 28 skulls with 3 skeletons brought in 1898 by E. A. McIlheny from Point Barrow; a valuable lot of skulls from Indian Point, Siberia, with a few from St. Lawrence Island, collected by W. Bogoras; and some scattered specimens by other explorers. To this were added in 1912 an important collection of skulls, with a few skeletons, made by Riley D. Moore, at that time my aide, on St. Lawrence Island; an important lot of crania gathered a few years later by V. Stefánsson at Point Barrow; and a third large and highly interesting lot, this time of both skulls and skeletons, collected near Barrow for the University Museum at Philadelphia in 1917-1919 by W. B. Van Valin. But none of the later material was described excepting the McIlheny collection which, in 1916, was reported upon by E. W. Hawkes.[142]
During the survey which is the subject of this report a special effort was made to collect all the older skeletal material along the Bering Sea and Arctic coasts that could be reached, and the result was the bringing back of some 450 crania, nearly 50 with skeletons, and many separate parts of the skeleton; nearly all of the specimens proceeding from localities thus far not represented in the collections. To which were added in 1927 nearly 200 skulls with a good number of skeletons gathered by H. B. Collins, jr., assistant curator in the Department of Anthropology, United States National Museum, and my aide, T. D. Stewart, on Nunivak Island and along the west coast of Alaska from Bristol Bay to near the Yukon delta.[143]
We thus have now a relatively vast amount of skeletal material on the western Eskimo; it is essentially a virginal material; it is well identified as to locality; and the specimens are mostly in very good condition.
Aside from Hawkes's thesis, nothing of note had been published on these collections until 1924, when the first number of my Catalogue of Human Crania in the United States National Museum Collections appeared, which includes the principal measurements on 290 skulls of the western Eskimo. Since then, in view of the growing importance of the subject, I have remeasured every specimen reported before; have measured personally all the new collections; and thanks to the kindness of those in charge have been enabled to extend the measurements to all the collections of Eskimo crania, both from Alaska and elsewhere, that were preserved up to the spring of 1928 at the National Museum at Ottawa, the American Museum of Natural History of New York, and the Wistar Institute of Philadelphia, which now contains the University Museum collections. The total records reach now to 1,283 adult skulls from practically all important parts of the total Eskimo area, besides a considerable quantity of other bones of the skeleton. The main results of the work will be given here, the detailed measurements being reserved for another number of the Catalogue.
To save repetitions and possible confusion and to show more clearly the status of the southwestern and midwestern Eskimo, the entire cranial material will be dealt with in this section, and previous records on the northeastern and a few other groups of the Eskimo will not be drawn upon to preserve the advantage of dealing with data obtained by the same methods, instruments, and observer.
In presenting the records it is found expedient, both on geographical and anthropological grounds, to make but three groupings. The first of these comprises the Eskimo from their southernmost limit to Norton Sound and the Bering Sea islands; the second group takes in Seward Peninsula (or the larger part of it) and the Arctic coast to Point Barrow; while the third embraces all the Eskimo east of Point Barrow. The first of these three groups is remarkably homogeneous, the second and third show each some exceptional units. It may be said at once that the dialectic subdivisions of Dall, Nelson, and others, in a large majority of cases are not found to be accompanied by corresponding physical differences, so that in a somatological classification they become submerged.
FOOTNOTES:
SKULL SIZE
The external size of the skull is best expressed by the cranial module or mean of the three principal diameters; the internal size, respectively the volume of the brain, by the "cranial capacity."
The module among the southwestern and midwestern Eskimo averages 15.44 centimeters in the males and 14.77 centimeters in the females. For people of submedium stature these are good dimensions. Fifty-two male and 40 female skulls of the much taller Sioux (writer's unpublished data) give the modules of only 15.25 and 14.27 centimeters; while 6 male and 9 female Munsee Indians, also tall,[144] give practically the same values as these Eskimos, namely 15.48 centimeters for the males and 14.75 centimeters for the females.
Not all the western groups, however, give equally favorable proportions. In general, the coast people below Norton Sound, and especially below the Yukon, give, so far as the males are concerned, the lowest values. It is interesting to note that it is precisely these people who among the western Eskimo are reputed to be about the lowest also in culture. The Togiak and near-by Kulukak males showed, as seen before, also about the smallest head in the living. The St. Lawrence Island males stand just about the middle, but the females of this island, as, interestingly, also in the living, show markedly less favorably. The Nunivak skulls, as with the living, are somewhat above the average, while in the small Pilot Station (Yukon) group, just as in the near-by contingent of Marshall among the living, the males have the largest heads in this western territory. The lower Yukon Eskimo were also shown, it may be recalled, to be of a higher stature than the majority of the coast people. It is a group that deserves further attention.
The module of the female skull does not evidently stand always in harmony with that of the male. The most striking example of this is shown, as already mentioned, by the St. Lawrence Island females, both skulls and the living. The females of this isolated island are also unduly short, but their small head is not entirely due to the defective stature. There must exist on this island, it would seem, some conditions that are disadvantageous to the female. In the small groups, such as that from the Little Diomede, the disharmonies are doubtless partly due to small numbers of specimens, but there may also be other factors, such as the bringing in of women from other places.[145]
Taking the mean of all the groups equalizes conditions, and it is seen that the module in both sexes is almost identical with that of the more northern groups, to Point Barrow. But the north Arctic and northeastern groups give a cranial module that in both sexes is somewhat higher, though their stature, according to the available data (Deniker, Boas, Duckworth, Steensby, Thalbitzer), is not superior.
A very remarkable showing is that of the percentage relation of the female to male skull size in the three large groupings. In the first two it is identical, in the third it differs less than could confidently be expected among the closest relatives. Another remarkable fact is that this important relation is found to be much like that in the Eskimo in various groups of Indians; thus it was 96 in the Indians of Arkansas and Louisiana,[3] 95.5 in the Munsee of New Jersey,[146] and 96.4 in the Indian skulls of California.[147] But it is only 93.6 in the Sioux (52 male, 40 female skulls) and differs more or less also in other tribes and peoples. A comprehensive study of this relation, with due respect to age, will some day well repay the effort.
Eskimo: Cranial Module
(L+B+H)
3
MALES IN ASCENDING ORDER
Southwestern and midwestern
Males Females
(5) (7)
Togiak 15.21 14.73
(4) (6)
Mumtrak 15.22 14.68
(3) (2)
Southwestern Alaska 15.25 14.90
(9) (4)
Hooper Bay 15.30 14.68
(8) (6)
St. Michael Island 15.30 14.72
(5) (7)
Little Diomede Island 15.33 15.09
(14) (20)
Pastolik and Yukon Delta 15.34 14.83
(145) (128)
St. Lawrence Island 15.42 14.27
(4) (2)
Golovnin Bay to Cape Nome 15.52 14.65
(46) (70)
Nunivak Island 15.53 14.90
(13) (16)
Indian Point (Siberia) 15.54 14.88
(3) (2)
Chukchee 15.56 15.05
(4) (1)
Port Clarence 15.57 (14.57)
(9) (16)
Nelson Island 15.59 14.64
(3) (3)
Pilot Station, Yukon 15.91 15
(275) (290)
General averages, approximately 15.44 14.77
Females vs. males (M=100) 95.7
Northwestern
(2) (1)
Kotzebue Sound 15.05 (14.67)
(12) (8)
Shishmaref 15.19 14.71
(132) (84)
Point Hope 15.37 14.72
(47) (52)
Point Barrow 15.45 14.75
(35) (34)
Barrow and vicinity 15.46 14.66
(27) (24)
Old Igloos near Barrow 15.52 14.72
(19) (14)
Wales 15.66 14.86
(274) (217)
General averages, approximately 15.39 14.73
Females vs. males (M=100) 95.7
Northern and northeastern
(49) (52)
Greenland 15.51 14.72
(5) (2)
Hudson Bay and vicinity 15.55 14.57
(16) (17)
Baffin Land and vicinity 15.55 15.04
(6) (10)
Northern Arctic 15.63 14.85
(9) (6)
Southampton Island 15.65 15.18
(7) (2)
Smith Sound 15.81 15.15
(92) (89)
General averages, approximately 15.62 14.92
Females vs. males (M=100) 95.5
FOOTNOTES:
MODULE AND CAPACITY
A comparison of considerable interest is also that of the cranial module or mean diameter, to the capacity of the same skulls. This comparison reveals an important sex factor.[148] Relatively to the module, the capacity is very appreciably smaller in the female than it is in the male. This is a universal condition to which, so far as known, there are occasional individual but no group exceptions. It appears very clearly in the Eskimo. In 283 western male Eskimo skulls in which we have so far measured the capacity,[149] the module averages 15.38 centimeters, the capacity 1,490 cubic centimeters; while in 382 female skulls thus far gauged the former averages 14.82 centimeters, the latter 1,337 cubic centimeters. The percentage relation of the capacity to the module, the numbers taken as a whole, is 96.8 in the males but only 90.2 in the females. This means that relatively to the external size of the skull the female Eskimo brain is 6.66 per cent smaller. Similar sex disproportion exists in other American groups as well as elsewhere. Some day when suitable data accumulate it will be of much interest to study this condition on a wider scale.
FOOTNOTES:
ADDITIONAL REMARKS ON CRANIAL MODULE
Before we leave this subject, it may be well to point out two noteworthy facts apparent from the data on the northwestern and northeastern groups. The first is that the figures on both sexes from Barrow and Point Barrow are very nearly the same, suggesting strongly the identity of the people of the two settlements; and the Point Hope group is in close relation. The second fact is the curious identity of the old Igloo group, 8 miles southwest of Barrow, with the Greenlanders. The import of this will be seen later.
SKULL SHAPE
Utilizing the materials of the Otis and Barnard Davis Catalogues and with measurements taken for him on additional specimens in several of our museums, Boas, in 1895 (Verh. Berl. anthrop. Ges., 398), as already mentioned, reported the cranial index of 37 "western Eskimo" skulls of both sexes (without giving localities or details) as 77. He also reports in the same place (p. 391) the cephalic index of 61 probably male living "Alaska Eskimo," again without locality, as 79.2. These rather high indices and the relatively elevated stature (61 subjects, 165.8 centimeters) lead him to believe (p. 376) that both are probably due to an admixture with the Alaskan Indian, though the report contains no measurements of the latter.
The data that it is now possible to present may perhaps throw a new light on the matter. As was already seen in part from the data on the living, the head resp. the skull tends to relative shortness and broadness throughout the southwestern, midwestern, and Bering Sea region (excepting parts of the Seward Peninsula). Important groups in this region, particularly those on some of the islands, had little or no contact with the Indian. The cranial index in most of the groups of the southwestern and midwestern Eskimo equals or even exceeds that of the Indian. And Eskimo groups with a relatively elevated cranial index are met with even in the far north, as at Point Hope, Hudson Bay, and Smith Sound.[150] Finally, the shorter and broader head connects with that of the Asiatic Eskimo and that of the Chukchee, as well as other northeastern Asiatics.[151]
The records now available show the highest cranial indices to occur on the coast between Bristol Bay and the Yukon and on lower Yukon itself, while the lowest indices of the midwest area, though still mesocranic, occur in the aggregate of Nunivak Island and the mouths of the Yukon. Another geographical as well as somatological aggregate is that of the people of the St. Lawrence and Diomede Islands and of Indian Point, Siberia, the cranial index in these three localities being identical.
Eskimo: Cranial Index
Mean of both sexes
(Male+Female index)
2
on 1,281 adult skulls.
IN DESCENDING ORDER
Southwestern and midwestern
(11)
Togiak 80.1
(13)
Hooper Bay 79.7
(10)
Mumtrak 79.6
(6)
Pilot Station, Lower Yukon 79.3
(5)
Chukchee (Siberia) 78.6
(26)
Nelson Island 78
(6)
Southwestern Alaska 77.7
(32)
Indian Point (Siberia) 77.4
(12)
Little Diomede Island 77.4
(299)
St. Lawrence Island 77.2
(5)
Port Clarence 76.6
(34)
Pastolik and Yukon Delta 76.1
(14)
St. Michael Island 75.7
(116)
Nunivak Island 75.6
Northwestern
(222)
Point Hope 76.0
(3)
Kotzebue Sound and Kobuk River 75.4
(22)
Shishmaref 74.5
(101)
Point Barrow 74.1
(73)
Barrow 73.5
(33)
Wales 73.5
(7)
Golovnin Bay [152]72.6
(52)
Igloos, southwest of Barrow 69.7
Northern and northeastern
(7)
Hudson Bay and vicinity 76.3
(9)
Smith Sound 76.2
(15)
Southampton Island 74.8
(15)
Northern Arctic 73.6
(33)
Baffin Land and vicinity 73.2
(101)
Greenland 71.9
The Seward Peninsula shows sudden differences. There are a few localities along its southern coast where the cranial type belongs apparently to the Bering Sea and southern area. One site at Port Clarence was one of these. But already at Golovnin Bay, which is not far from Norton Sound and St. Michael Island, and according to the evidence of the most recent collections (Collins 1928), also at Sledge Island, there is a sudden appearance of marked dolichocrany, which is repeated at Wales, on the western extremity of the peninsula, approached at Shishmaref, the main Eskimo settlement on its northern shore, and, judging from some fragmentary material seen at the eastern end of the Salt Lake, also in the interior. The cause of this distinctive feature in the Seward Peninsula is for the present elusive. The little known territory urgently needs a thorough exploration.
The distribution of the cranial index farther north along the western coast shows several points of interest. The first is the exceptional position of Point Hope, one of the oldest and most populous settlements in these regions, which by its cranial index seems to connect with the Bering Sea groups. The second is the closeness, once more, of Barrow and Point Barrow. The third and greatest is the presence, in a small cluster of old igloos 8 miles down the coast from Barrow, of a group of people that finds no counterpart in its cranial index and, as will be seen later, also in some other characteristics, in the entire western region; in fact, in the whole Eskimo territory outside of Greenland. As noted before, the size of the head in this group is also closest to that of Greenland. These peculiar facts indicate a problem that will call for separate consideration.
The northern and northeastern groups, with the exception of the mesocranic Hudson Bay and Smith Sound contingents, and the very dolichocranic Greenlanders, show dolichocrany much the same as that of Barrow and Point Barrow.
FOOTNOTES:
HEIGHT OF THE SKULL
This is a measurement of much value, both alone and as a supplement to the cranial index, for skulls with the same index may be high or low and thus really of a radically distinct type.
The height of the vault is best studied in its relation to the other cranial dimensions, particularly to the mean of the length and breadth, with both of which it correlates. But in the Eskimo it is also of interest to compare the height with the breadth of the skull alone. The former relation is known as the mean height index and the latter as the height-breadth index. Both mean the percentage value of the basion-bregma height as compared to the other dimensions.
The mean height index H (Mean of L+B) advocated independently by the writer since 1916 (Bull. 62, Bur. Amer. Ethn., p. 116), is proving of much value in differentiation of types and has already become a permanent feature in all writers' work on the skull. There is a corresponding index also on the living.
In the American Indian the averages of the index range from approximately 76 to 90. (See Catalogue of Crania, U. S. Nat. Mus., Nos. I and II.) Where the series of specimens are sufficiently large the index does not differ materially in the two sexes. Indices below 80 may be regarded as low, those between 80 and 84 as medium, and those above 84 as high.[153]
The southwestern and midwestern Eskimo skulls show mean height indices that may be characterized as moderate to slightly above medium. In general the broader and shorter skulls show lower indices, approaching thus in all the characters of the vault the Mongolian skulls of Asia. (Compare Catalogue Crania, U. S. Nat. Mus., No. I.) The Indian Point, St. Lawrence Island, and Little Diomede Island skulls are again, as with the cranial index, very close together, strengthening the evidence that the three constitute the same group of people. (Pls. 59, 60.)
The northwestern Eskimo and most of those of the northeast have relatively high vault. Barrow and Point Barrow are once more almost the same. The Point Hope group shows a high vault, though also rather broad. The somewhat broad Hudson Bay crania are but moderately high, like those of the southwestern Eskimo. The northern Arctic skulls give smaller height than would be expected with their type; the Southampton Island specimens give higher. The old Igloo group from near Barrow stands again close to Greenland; its skull is even a trace narrower and higher, standing in both respects at the limits of the Eskimo. The whole, as with the cranial index, shows evidently a rich field of evolutionary conditions.
Eskimo: Cranial Mean Height Index
(
H-Floor-Line of Aud. Meatus to Bg×100
)
Mean of L+B
MEAN OF BOTH SEXES IN ASCENDING ORDER
Southwestern and midwestern
(11)
Togiak 81.8
(25)
Nelson Island 82.1
(6)
Southwest Alaska 82.3
(6)
Pilot Station, Yukon 82.3
(10)
Mumtrak 82.5
(13)
Hooper Bay 82.7
(116)
Nunivak Island 83.3
(5)
Chukchee 83.3
(34)
Pastolik and Yukon Delta 83.4
(4)
Port Clarence 83.4
(29)
Indian Point (Siberia) 83.8
(279)
St. Lawrence Island 84.1
(12)
Little Diomede Island 84.5
(14)
St. Michael Island 85.1
Northwestern
(69)
Barrow 83.8
(99)
Point Barrow 84.1
(2)
Kotzebue Sound and Kobuk River 84.4
(20)
Shishmaref 84.5
(33)
Wales 85.0
(216)
Point Hope 85.7
(4)
Golovnin Bay—Cape Nome 85.9
(51)
Igloos, southwest of Barrow 86.3
Northern and northeastern
(7)
Hudson Bay and vicinity 82.2
(15)
Northern Arctic 82.7
(33)
Baffin Land and vicinity 84.4
(9)
Smith Sound 85.1
(101)
Greenland 85.1
(15)
Southampton Island 85.5
The height-breadth index (H×100) (B) of the Eskimo skull shows in substance the same conditions as did the mean height index, but while less informative or dependable on one side, on the other it accentuates the relative narrowness of the skull in some of the groups.
BUREAU OF AMERICAN ETHNOLOGY FORTY-SIXTH ANNUAL REPORT PLATE 59
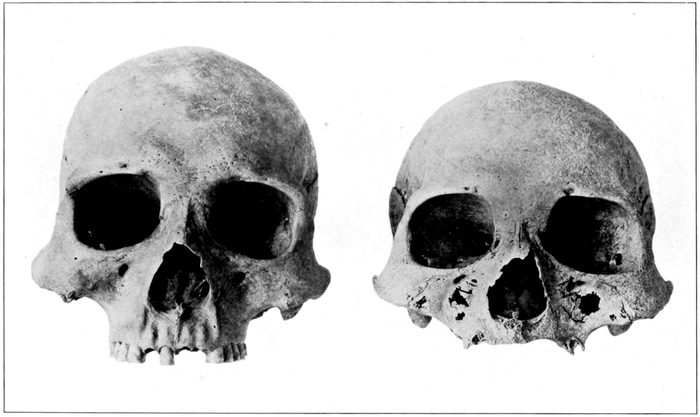
Skulls From Old Burials, Point Hope; Right Skull Shows Low Vault. (U.S.N.M.)
BUREAU OF AMERICAN ETHNOLOGY FORTY-SIXTH ANNUAL REPORT PLATE 60
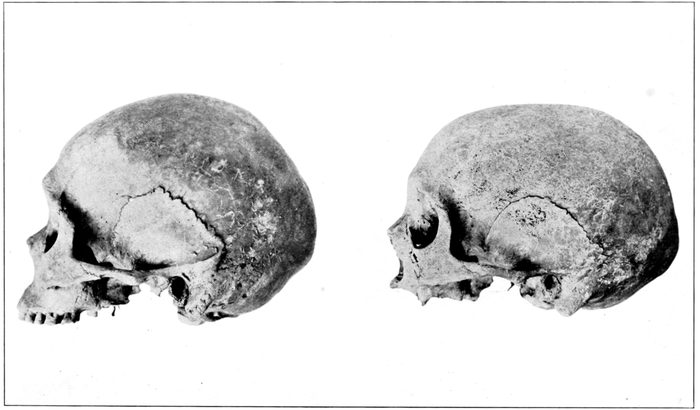
Skulls From Old Burials, Point Hope; Right Skull Shows Low Vault. (U.S.N.M.)
Eskimo: Height-Breadth Index of the Skull
MEAN OF BOTH SEXES IN ASCENDING ORDER
Southwestern and midwestern
(12)
Togiak 91.9
(6)
Pilot Station, Lower Yukon 92.8
(10)
Mumtrak 93.1
(5)
Chukchee 93.1
(13)
Hooper Bay 93.2
(25)
Nelson Island 93.7
(5)
Yukon Delta 94.7
(5)
Southwest Alaska 95.2
(12)
Little Diomede Island 96.3
(279)
St. Lawrence Island 96.5
(116)
Nunivak Island 96.7
(31)
Indian Point (Siberia) 96.7
(29)
Pastolik 96.8
(6)
Cape Nome and Port Clarence 97.0
(14)
St. Michael Island 98.2
Northwestern
(99)
Point Barrow 98.7
(69)
Barrow 98.8
(20)
Shishmaref 98.9
(216)
Point Hope 99.2
(3)
Kotzebue Sound and Kobuk River 99.6
(33)
Wales 100.3
(51)
Igloos, southwest of Barrow 105.0
Northern and eastern
(7)
Hudson Bay and vicinity 95.3
(16)
North Arctic 97.8
(9)
Smith Sound 98.3
(15)
Southampton Island 99.8
(33)
Baffin Land and vicinity 99.9
(101)
Greenland 101.8
FOOTNOTES:
THE FACE
The facial dimensions of the Eskimo skull offer a number of points of unusual interest. The face is absolutely and especially relatively to stature very large in all measurements. It is particularly high between the upper alveolar point and nasion.
The large size of the Eskimo face will best be appreciated from a few figures.
Facial Dimensions of the Western and Other Eskimo Crania Compared With Those of the Siouan and Algonquian Tribes
Southwestern and midwestern Eskimo Eskimo in general Siouan tribes Algonquian tribes
Mean of 14 groups (male) 10 groups (female) 27 groups (male) 22 groups (female) 12 groups (male) 15 groups (female)
Total height (ment.-nas.) 12.60 (11.63) 12.52 (11.59) 12.26 12.11
Upper height (alv. pt.-nas.) 7.87 (7.29) 7.79 (7.21) 7.52 7.35
Diameter bizyg. max. 14.25 (13.27) 14.26 (13.22) 14.16 13.89
Module of upper face (U. H.+B) 2 11.06 (10.28) 11.03 (10.22) 10.84 10.62
So far as known there are no larger faces among the Indians than those of the Sioux, yet they remain very perceptibly, in all three measurements, behind the Eskimo. No face as large as that of the Eskimo is known, in fact, from anywhere else in the world. In whites the mean diameter of the largest faces (see data in Martin's Lehrbuch Anthrop., 789-791) does not exceed 10.36 centimeters. The above showing assumes especial weight when it is recalled that both the Siouan and the Algonquian tribes are among the tallest there are on the American Continent. The cause of the large size of the Eskimo face can only be the excessive use of the jaws; no other reason even suggests itself. But the character may already be more or less hereditary. It furnishes another attractive subject for further investigation.
With its large dimensions the face of the Eskimo skull presents generally also large orbits, large molars, submedium prominence and breadth of the nasal bridge, shallow suborbital (canine) fossae, large dental arch above medium teeth, and a large and stout lower jaw with broad not seldom more or less everted angles, giving the whole a characteristic appearance. With partial exception of the orbits and the nose, which are subject also to other factors, all these features of the Eskimo face are explainable as strengthenings resulting from the increased function of mastication.
The main dimensions of the cranial face in the three large groupings of the Eskimo are given in the next table.
Western and Other Eskimo: Facial Dimensions in the Skull
Males Females
Mentonnasion Alveolar point-nasion Diameter bizygomatic maximum Cranial facial index Mentonnasion Alveolar point-nasion Diameter bizygomatic maximum Cranial facial index
Total Upper Total Upper
Groups (9) (14) (14) (8) (14) (8) (10) (10) (8) (10)
Southwestern and midwestern 12.60 7.87 14.25 88.2 55.3 11.63 7.29 13.27 87.7 54.9
Groups (5) (7) (7) (5) (7) (2) (7) (7) (2) (7)
Northwestern 12.58 7.73 14.23 88.3 54.4 11.55 7.19 13.18 88.2 54.6
Groups (5) (6) (6) (5) (5) (3) (5) (5) (3) (5)
North Arctic and northeastern 12.22 7.69 14.32 85.9 53.7 11.61 7.13 13.15 85.7 54.2
These data show a number of interesting conditions. The height of the upper face (alveolar point-nasion) is greatest in the southwestern and midwestern groups, is slightly lower in the northwesterners, and still further slightly lower in the north Arctic and the northeast. On the other hand the facial breadth is slightly higher in the north and east, and that although the vault has become mostly decidedly narrower.
These facts are shown best by the upper facial index, which in the males descends quite perceptibly in the west from the south to the north and in the Arctic from the west to the east. In the females there is a parallel gradual diminution in the upper facial height from the south to the north and then east, but the facial breadth diminishes very slightly also instead of increasing, as a result of which the upper facial index shows only minor differences; yet these differences are in the same direction as those in the males.
These matters are involved with a number of factors—the stature, the breadth of the vault, and the development and direct influence of the temporal muscles, besides hereditary conditions. Their proper study will necessitate even more—in fact, much more—material than is now at our disposal.
The following table gives the distribution of the upper cranial facial index in the various groups. Of the two indices that of the whole face, including the lower jaw, is the less valuable; first, because the jaw is often absent; second, because it is influenced by the height of the lower jaw, which does not correlate perfectly with the upper; and third, on account of the wear of the teeth, which in such people as the Eskimo is very common and diminishes more or less the total height of the face. Its averages in the three main groupings have already been given. Its figures are not very exceptional.
Eskimo Skulls: Facial Index, Upper
MEAN OF BOTH SEXES IN ASCENDING ORDER
Southwestern and Midwestern
(6)
Pilot Station, Lower Yukon 53.6
(5)
Cape Nome and Port Clarence 54.0
(10)
Hooper Bay 54.4
(9)
Mumtrak 54.5
(93)
Nunivak Island 54.6
(262)
St. Lawrence Island 54.9
(8)
Togiak and vicinity 55.0
(24)
Indian Point (Siberia) 55.1
(23)
Nelson Island 55.2
(4)
Southwestern Alaska 55.4
(10)
St. Michael Island 55.5
(25)
Pastolik 55.7
(4)
Chukchee 55.8
(11)
Little Diomede Island 56.0
Northwestern
(190)
Point Hope 52.8
(2)
Kotzebue 53.7
(17)
Shishmaref 54.1
(42)
Igloos north of Barrow 54.1
(41)
Barrow 54.8
(75)
Point Barrow 55.2
(31)
Wales 55.4
Northern and northeastern
(9)
Smith South 51.7
(14)
Southampton Island 52.3
(23)
Baffin Land and vicinity 53.8
(90)
Greenland 54.1
(7)
Hudson Bay and vicinity 54.3
(11)
Northern Arctic 56.6
The upper facial index of the Eskimo skull is high, though there is considerable group variation. The reason is the height of the upper face, for which the accompanying considerable expansion of the zygomatic arches does not fully compensate. In the white groups this index ranges from approximately 50 to 54; it averages 52.9 in 15 Algonquian and 53.1 in 12 Siouan tribes. The means in the large Eskimo groupings are from a little below 54 to a little over 55. Its regional differences have already been mentioned. Sex differences in the index are very small. There are a number of points of significant agreement, the foremost of which is once more that in the case of Barrow and Point Barrow, and especially that of the Old Igloos near Barrow and Greenland.
THE NOSE
Equally as engaging as the whole face of the Eskimo skull is the cranial nose. Our data throw much light on this feature also.
Where the dimensions of the whole face are altered by some cause the nose can not remain unaffected. This is especially true of its height, which correlates directly and closely with that of the face proper; the correlation of the breadth of the nose with that of the face is weaker and more irregular, but not absent where not counteracted by other factors. Accordingly with the high Eskimo upper face there is found also a high nose, both being the highest known to anthropometry. But the nasal breadth, instead of responding to the considerable facial breadth, has become smaller, until in some of the Eskimo groups it is the smallest of all known human groups. There is plainly another potent factor in action here. This factor could conceivably be connected simply with the above-average growth of the facial bones; but if this were so then individuals with smaller development of these bones ought to have broader noses, and vice versa. This point can readily be tested. Taking the largest and best cranial series, that of St. Lawrence Island, and selecting the skulls with the smallest and the largest faces, the facts come out as follows:
Smallest development of face Largest development of face
Face height (upper) Face breadth Breadth of nasal aperture Face height Face breadth Breadth of nasal aperture
10 males 7.52 13.64 2.37 8.46 14.79 2.49
10 females 6.81 12.56 2.37 7.54 14.02 2.40
Percentage relation of breadth of nose to mean diameter of face:
Male 22.4 21.4
Female 24.5 22.2
The above data show that while the narrow nose in the Eskimo is to some extent affected by the large development in these people of the facial bones, yet there must be also other factors.
But if not wholly connected with the development of the facial bones, then some of the causes of the narrow nose in the Eskimo must either be inherited from far back or must be due to influences outside the face itself.
Pushing the character far back would be no explanation of its original cause, but it may be shown that such a procedure would not be justified. In the following important table are given the now available data on the breadth of the nasal aperture of the Eskimo, group by group and area by area, and these data show that narrow nose is by no means universal in this family. The nasal aperture is broader in the southwest and midwest than in the northwest, and broader in the latter region than in the Arctic north, and the northeast. In general it is seen that the farther northward and northeastward the narrower the nose, until it reaches beyond that of all other human groups; while in the west and southwest it gradually approaches until it reaches the nasal breadth of the Indian. And that this latter condition is not due to Indian admixture is shown by the fact that among the broadest noses are those of the Eskimo in Siberia and those on the St. Lawrence Island, where there was no known contact with the Indian, while the narrower noses are along the midwestern coast, where Indian admixture might have been possible.
Eskimo: Breadth of the Nasal Aperture
BOTH SEXES TAKEN TOGETHER IN DESCENDING ORDER
Southwestern and midwestern
(5)
Southwestern Alaska 2.50
(31)
Indian Point (Siberia) 2.48
(5)
Chukchee 2.47
(6)
Pilot Station, Lower Yukon 2.45
(280)
St. Lawrence Island 2.42
(29)
Pastolik 2.41
(13)
Hooper Bay 2.39
(10)
Mumtrak 2.38
(6)
Cape Nome and Port Clarence 2.38
(23)
Nelson Island 2.37
(9)
Togiak and vicinity 2.36
(4)
Yukon Delta 2.34
(107)
Nunivak Island 2.33
(11)
Little Diomede Island 2.32
(13)
St. Michael Island 2.21
Northwestern
(3)
Kotzebue 2.41
(34)
Wales 2.37
(20)
Shishmaref 2.36
(56)
Barrow 2.35
(211)
Point Hope 2.33
(92)
Point Barrow 2.30
(48)
Igloos, north of Barrow 2.30
Northern and northeastern
(9)
Smith Sound 2.29
(15)
Northern Arctic 2.26
(14)
Southampton Island 2.25
(29)
Baffin Land and vicinity 2.25
(98)
Greenland 2.23
(7)
Hudson Bay and vicinity 2.19
It is hardly possible, therefore, to assume that a narrow nose is an ancient inheritance of the Eskimo. From the facts now at hand it seems much more probable that the Eskimo nose or respiratory nasal aperture was not originally very narrow, but that it gradually acquired this character as the people extended farther north and northeastward; and there appears to be but one potent factor that could influence this development and that increases from south to north, namely, cold. A narrowing of the aperture can readily be understood as a protective development for the throat and the organs of respiration.
It is not easy to see how the bony structures respond to the effects of cold or heat, but that they do, particularly where these are aggravated by moisture, has long been appreciated, and shown fairly conclusively through studies on the nasal index by Thomson and later by Thomson and Buxton.[154] An even more satisfactory study would have been that of the nasal breadth alone. Perhaps the normal variation with the elimination of the less fit are the main agencies.
The next two tables show other interesting conditions. The first of these, seen best from the more general data, are the relations of the nasal dimensions and index in the two sexes. The females in all the three large groupings have a higher nasal index than the males. This is a general condition among the Indians as well as in other races. It is usually due to a relative shortness of the female nose. This condition is very plain in the Eskimo. The female nose is actually narrower than the male, due to correlation with shorter stature and lesser facial breadth, yet the index is higher. The reason can most simply be shown by comparing the general mean nasal breadth and height in the two sexes. The breadth in the female is approximately 96.2 per cent of that in the male; the height is only 92.7 per cent.
Nasal Dimensions in Western and Other Eskimo Crania
Area Males Females
Height Breadth Index Height Breadth Index
Groups (14) (14) (14) (10) (10) (10)
Southwestern and Midwestern 5.46 2.42 44.3 5.06 2.32 45.8
Groups (7) (7) (7) (6) (6) (6)
Northwestern 5.42 2.37 43.7 5.06 2.30 45.4
Groups (6) (6) (6) (5) (5) (5)
Northern Arctic and northeastern 5.38 2.28 42.4 4.95 2.18 44.0
Detailed group data on the nasal index show that this ranges from 47.7 on the Yukon to 41.8 in the northernmost contingent of the Eskimo at Smith Sound. The Kotzebue group that shows even a higher index than on the Yukon is too small to have much weight. Barrow and Point Barrow are once more nearly the same, as are the Old Igloos and Greenland; and there are some other interesting relations.
Eskimo Skulls: Nasal Index
BOTH SEXES TAKEN TOGETHER IN DESCENDING ORDER
Southwestern and midwestern
(6)
Pilot Station, Lower Yukon 47.7
(5)
Southwestern Alaska 47.5
(31)
Indian Point (Siberia) 46.5
(13)
Hooper Bay 46.2
(6)
Cape Nome and Port Clarence 46.0
(280)
St. Lawrence Island 45.8
(5)
Chukchee 45.6
(10)
Mumtrak 45.2
(107)
Nunivak Island 45.1
(9)
Togiak and vicinity 45.0
(29)
Pastolik 44.9
(23)
Nelson Island 44.6
(11)
Little Diomede Island 44.5
(13)
St. Michael Island 42.9
(4)
Yukon Delta 42.7
Northwestern
(3)
Kotzebue 49.0
(20)
Shishmaref 46.0
(34)
Wales 45.3
(211)
Point Hope 44.9
(56)
Barrow and vicinity 44.0
(48)
Igloos north of Barrow 44.0
(92)
Point Barrow 43.5
Northern and northeastern
(7)
Hudson Bay and vicinity 44.6
(15)
North Arctic 44.1
(29)
Baffin Land and vicinity 43.8
(98)
Greenland 43.6
(14)
Southampton Island 43.0
(9)
Smith Sound 41.8
FOOTNOTES:
THE ORBITS
In many American groups the orbits are notoriously variable, yet their mean dimensions and index are of value.
The Eskimo orbits have long been known for their ample proportions. Their mean height and breadth are larger than those of any other known people and the excess is especially apparent when proportioned to stature. Taking the family as a whole, the mean height of the two orbits in males averages approximately 3.64 centimeters, the mean breadth 4.03 centimeters; while the males of 23 Algonquian tribes give for the same items 3.42 and 3.93, and those of 12 Siouan tribes 3.58 and 3.96 centimeters.
The general averages for the female Eskimo approach for orbital height 3.52 centimeters, for breadth 3.89 centimeters, dimensions which also surpass those in the females of any other known human group.
These large dimensions of the Eskimo orbit are, however, on closer examination into the matter, found not to be racial characters except in a secondary way. They are the direct consequence of the high and broad face. The correlation of the orbital height and breadth with the height and breadth of the face are shown by the following figures. These figures indicate also some additional details of interest.
Eskimo Orbits: Right and Left
MALES
Height Breadth Index
Right Left Right Left Right Left
(145) (145) (145)
St. Lawrence Island 3.67 3.68 4.05 4.01 90.7 91.8
(41) (41) (41)
Nunivak Island 3.59 3.59 4.05 4.— 88.7 89.7
(120) (120) (120)
Point Hope 3.63 3.63 4.05 4.01 89.6 90.5
(46) (46) (46)
Greenland 3.64 3.65 4.02 3.96 90.6 92.1
FEMALES
(128) (128) (128)
St. Lawrence Island 3.62 3.60 3.92 3.89 91.7 92.6
(58) (58) (58)
Nunivak Island 3.50 3.52 3.88 3.84 90.2 91.6
(70) (70) (70)
Point Hope 3.54 3.54 3.91 3.88 90.5 91.4
(45) (45) (45)
Greenland 3.55 3.56 3.86 3.83 91.9 92.9
The general orbital index of the Eskimo is close to 90 in the males, 90.5 in the females. Such orbits are classed as also relatively high or megaseme, a character in which they resemble many of the American Indians. Thus the male crania of the Siouan tribes give the practically identical general index of 90.5.
The slightly higher index in the females is the rule to which there are but few exceptions, and those in individual groups where the numbers of specimens may not be sufficient. The same tendency is observable in the Indians, and appears in fact to be panhuman. It is due to slightly lesser relative height as compared to the breadth of the orbit in the males, which condition is due in all probability to the greater development in the males of the frontal sinuses and supraorbital arches.
Eskimo Crania: Dimensions of the Orbits in Relation to Those of the Face
ORBITAL HEIGHT VERSUS UPPER FACIAL HEIGHT
Males
(10) Lowest faces (7.2-7.4) (10) Average faces (7.8) (10) Highest faces (8.4-9)
Face Orbits Face Orbits Face Orbits
7.37 3.62 7.80 3.65 8.55 3.78
Females
(10) Lowest faces (6.4-6.8) (10) Average faces (7.3) (14) Highest faces (7.8-8.4)
Face Orbits Face Orbits Face Orbits
6.69 3.54 7.30 3.56 7.89 3.67
PERCENTAGE RELATIONS OF ORBITS TO FACE
49.1 46.8 44.2
53 48.7 46.6
ORBITAL BREADTH VERSUS FACIAL BREADTH
Males
(10) Narrowest faces (13.4 and below) (17) Average faces (14.2) (10) Broadest faces (14.9 and above)
Face Orbits Face Orbits Face Orbits
13.30 3.96 14.20 4.01 15.11 4.17
Females
(10) Narrowest faces (12.7 and below) (14) Average faces (13.3) (10) Broadest faces (13.9 and above)
Face Orbits Face Orbits Face Orbits
12.57 3.74 13.30 3.88 14.09 3.98
PERCENTAGE RELATIONS OF ORBITS TO FACE
29.8 28.4 28.2
29.8 29.2 27.6
Individual variation in the orbital index of the Eskimo is extensive, reaching from slightly below 80 to well over 100. It extends more or less over the whole Eskimo area, without conveying definite indication anywhere of either a mixture or of a special evolutionary tendency. Yet it occasions group differences that eventually might prove evolutionary, though they may merely represent the next or higher order of variability, namely, that of groups within a family.
Orbital Dimensions and Index in Eskimo Skulls
Area Males Females
Mean height Mean breadth Mean index Mean height Mean breadth Mean index
(13) (13) (13) (13) (13) (13)
South and Midwestern 3.63 4.01 90.6 3.56 3.87 92.1
(6) (6) (6) (6) (6) (6)
Northwestern 3.62 4.02 90.1 3.51 3.92 89.7
(5) (5) (5) (5) (5) (5)
Northern Arctic and northeastern 3.65 4.07 89.5 3.54 3.91 90.6
The group differences in the orbital index of the Eskimo skull are shown in the next table. They elude a satisfactory explanation, unless recourse is had to the above suggested theory of normal group variability within a family. They have about the same range in the three large areas, which would seem to support this theory.
Group relations are indicated in the cases of Pastolik-Yukon Delta-St. Michael Island; Point Barrow-Barrow; and Old Igloos-Greenland.
Eskimo Skulls: Mean Index of the Orbits
BOTH SEXES TAKEN TOGETHER IN ASCENDING ORDER
Southwestern and midwestern
(10)
Mumtrak 88.4
(11)
Little Diomede Island 89.4
(6)
Cape Nome and Port Clarence 89.7
(101)
Nunivak Island 90.1
(31)
Indian Point (Siberia) 90.3
(5)
Chukchee 90.6
(6)
Pilot Station, Lower Yukon 91.0
(5)
Southwest Alaska 91.4
(271)
St. Lawrence Island 91.7
(24)
Nelson Island 91.9
(13)
Hooper Bay 92.5
(29)
Pastolik 93.2
(7)
Togiak 93.3
(4)
Yukon Delta 93.8
(13)
St. Michael Island 94.4
Northwestern
(3)
Kotzebue 86.1
(20)
Shishmaref 88.9
(34)
Wales 89.4
(85)
Point Barrow 90.3
(200)
Point Hope 90.4
(53)
Barrow 91.1
(43)
Igloos north of Barrow 91.1
Northern and northeastern
(9)
Smith Sound 87.6
(13)
Southampton Island 88.4
(28)
Baffin Land and vicinity 90.0
(16)
Northern Arctic 91.0
(94)
Greenland 91.6
(7)
Hudson Bay and vicinity 92.3
THE UPPER ALVEOLAR ARCH
The dental arches correlate with function (use), with stature, with the dimensions of the face, and with those of the teeth. The western as well as other Eskimo show arches that are about equal in absolute dimensions to those of our taller Indians, such as the Munsee, Arkansas, and Louisiana;[155] but relatively to stature the Eskimo arch is decidedly larger.
The upper dental arch index L×100 B, now being used in preference to the unwieldy "uranic index" B×100 L of Turner, is rather high, showing that the arch is relatively, as well as absolutely, broad. The same index in the Munsee averaged in the males 82.8, in the females 82.7; in the Arkansas and Louisiana mound skulls 84.4 in the males and 85.1 in the females. Data are needed here for more extensive comparisons.
Eskimo Crania: Alveolar Arch
Males Females
External length External breadth Module (mean diameter) Index L×100 B External length External breadth Module (mean diameter) Index L×100 B
11 groups:
Southwestern and Midwestern 5.56 6.66 6.11 83.5 5.34 6.38 5.86 83.8
6 groups:
Northwestern 5.63 6.61 6.12 85.1 5.38 6.31 5.85 85.2
5 groups:
Northern Arctic and northeastern 5.68 6.75 6.21 84.2 5.37 6.28 5.83 85.6
Eskimo Skulls: Length-Breadth Index of the Upper Alveolar Arch
BOTH SEXES TAKEN TOGETHER IN ASCENDING ORDER
Southwestern and Midwestern
(5)
Pilot Station, Lower Yukon 79.4
(8)
Togiak and vicinity 80.5
(4)
Chukchee 81.1
(12)
Hooper Bay 81.7
(9)
Mumtrak 81.7
(9)
Little Diomede Island 82.2
(234)
St. Lawrence Island 83.0
(10)
St. Michael Island 84.3
(22)
Pastolik 84.4
(90)
Nunivak Island 84.4
(4)
Southwest Alaska 84.7
(5)
Cape Nome and Port Clarence 84.9
(22)
Indian Point (Siberia) 85.0
(22)
Nelson Island 85.5
Northwestern
(39)
Igloos north of Barrow 84.1
(14)
Shishmaref 84.4
(171)
Point Hope 84.6
(31)
Wales 84.9
(38)
Barrow 85.8
(66)
Point Barrow 87.1
Northern and northeastern
(9)
Smith Sound 82.7
(13)
Southampton Island 83.7
(7)
Hudson Bay and vicinity 84.4
(23)
Baffin Land and vicinity 85.7
(89)
Greenland 85.9
(10)
Northern Arctic 86.5
Sex differences in the index are small, nevertheless the females tend to show a slightly higher index, due to relatively slightly smaller breadth of the arch.
The size of the arch and its index differ but little over the three main areas of the Eskimo territory, yet there are slight differences. They appear plainly in the following table. Notwithstanding the fact that on the whole the southwestern and midwestern groups are somewhat taller than those of the far north and northeast, the largest palate, in the males at least, is found in the latter area.
In the southwest and midwest the upper alveolar arch is relatively (as well as absolutely, barring one group) somewhat broad and short. This may be in correlation with the broader head in this area, just as the absolutely slightly longer palates over the rest of the Eskimo territory and particularly (in males) in the northeast may correlate with the longer heads in those regions. This point may be tested on our splendid material from St. Lawrence Island. Taking the broadest and the narrowest skulls from this locality, the following data are obtained for the proportions of the upper dental arch:
Eskimo Crania: Dental Arch and Form of Skull
ST. LAWRENCE ISLAND MATERIAL
Males Females
Narrowest skulls (C. I. 70.7-73.5) Broadest skulls (80.6-83.1) Narrowest skulls (70.3-74.2) Broadest skulls (80.9-83.8)
Length 5.68 5.58 5.52 5.20
Breadth 6.83 6.77 6.66 6.36
Index 83.2 82.4 82.9 82.7
Mean diameter 6.26 6.18 6.09 5.78
Mean cranial diameter (cranial module) of same skulls 15.61 15.49 14.97 14.73
Percentage relation of mean dental arch diameter to the mean diameter of the skull 40.1 39.8 40.7 39.2
Length of same skulls 19.21 18.10 18.35 17.25
Percentage relation of length of dental arch to that of skull 29.5 30.8 30.1 30.1
The above figures show several conditions. The first is that the arch is quite distinctly larger in the narrow than in the broad skulls in both sexes. The second fact is that the skull (vault) itself is slightly larger in the narrow-headed. The third is that the length of the arch is somewhat greater in the narrow and long skulls than it is in the broad and shorter, relatively to the skull size. The fourth is that there appears a close correlation, more particularly in the females, between the length of the arch and that of the skull.
FOOTNOTES:
THE BASION-NASION DIAMETER
The anterior basal length (basion-nasion) is a measurement of importance, though its full meaning in anthropology is not yet entirely clear. From data quoted by Martin (Lehrb., 715-716) it appears to average in whites up to 10.3 centimeters in males and up to 10.1 centimeters in females, and is known to correlate closely with the length of the vault. Secondarily it also correlates with stature.
Data on American Indians are not yet generally available, though in preparation. The Munsee skulls gave the writer for the diameter the means of 10.27 for the males and 10.02 for the females; the mound skulls from Arkansas and Louisiana gave 10.45 for the males and 9.77 for the females.
An abstract of the data on the Eskimo skulls is given in the next table. The values for the measurement are rather high, especially for such short people. The percentage relation of the measurement to the length of the skull appears also to be high. Manouvrier (1882, quoted in Martin, Lehrb., 716) found this relation in French skulls to be 53.6 in the males and 54.7 in the females.
Eskimo Crania: Basion-Nasion Length
Groups of males Corresponding groups of females
Basion-nasion diameter Its percentage relation to length of skull Basion-nasion diameter Its percentage relation to length of skull
(13) (13) (13) (13)
Southwestern and Midwestern 10.38 56.4 9.85 55.7
(6) (6) (6) (6)
Northwestern 10.58 56.4 10.06 56.3
(5) (5) (5) (5)
Northern Arctic and northeastern 10.65 56.2 10.06 55.4
The female measurement to that of the male, in the Eskimo, is as 94.9 to 100. As a similar relation of the cranial modules in the two sexes is close to 95.7, the anterior basal length would seem to be at a little disadvantage in the female Eskimo skull.
The same condition is seen also when the basion-nasion diameter is compared with the length of the skull. In the males, notwithstanding the fact that the length of the vault is increased through the development of the frontal sinuses and not infrequently also through that of the occipital ridges, the percentage relation of the basion-nasion to the maximum total length of the vault is approximately 56.3, in the females but 55.8. It seems therefore safe to say that in the Eskimo, in general, that part of the brain anterior to the foramen magnum is relatively somewhat better developed in the males than in the females.
But to this there are some exceptions. Thus it may be seen in the general table which follows that in the northwestern groups conditions in this respect are equalized; and in the succeeding detailed table it will be noted that while the males exceed the females in this particular in 14 of the groups, in 5 groups conditions are equal (or within one decimal), and in 5 the female percentage exceeds slightly that in the males. In the numerically best represented groups conditions are nearly equal, with the males nevertheless slightly favored.
Eskimo Skulls: Basion-Nasion Length and Its Relation to Length of Skull
SEXES SEPARATELY IN ASCENDING ORDER
Males Females
B-N. BN×100 Skull l B-N. BN×100 Skull l
Southwestern and Midwestern
(4) (7)
Little Diomede Island 10.18 56.2 9.91 54.9
(3) (2)
Chukchee 10.20 54.8 10.00 54.8
(3) (3)
Pilot Station (Yukon) 10.27 54.3 9.97 56
(9) (4)
Hooper Bay 10.29 57.6 9.70 55.7
(4) (6)
Mumtrak 10.32 57 9.52 55.1
(146) (133)
St. Lawrence Island 10.36 56.3 9.93 56.1
(3)
Yukon Delta 10.37 55.8
(11) (18)
Pastolik 10.41 56.5 9.98 56.3
(8) (6)
St. Michael Island 10.44 57.3 9.98 56.3
(9) (15)
Nelson Island 10.46 55.8 9.73 55.9
(3) (7)
Togiak 10.47 57.2 9.56 55.7
(3) (2)
Southwestern Alaska 10.47 57.6 9.80 54.8
(15) (16)
Indian Point and Puotin 10.54 56.5 9.97 56.5
(46) (69)
Nunivak Island 10.55 56.1 10.02 56
Northwestern
(2)
Kotzebue 10.45 57.3
(133) (82)
Point Hope 10.48 57 10.00 56.9
(12) (8)
Shishmaref 10.50 56.8 10.20 57.5
(47) (52)
Point Barrow 10.54 56.2 9.94 55.5
(35) (34)
Barrow 10.61 55.9 10.01 56.3
(19) (15)
Wales 10.64 56.7 10.01 55.5
(27) (24)
Igloos north of Barrow 10.70 55.6 10.18 56.2
Northern and northeastern
(16) (17)
Baffin Land and vicinity 10.51 55.6 10.11 55.2
(5) (2)
Hudson Bay and vicinity 10.60 56.4 9.75 55.6
(48) (52)
Greenland 10.60 55.9 10.13 56.2
(5) (10)
Northern Arctic 10.68 56.1 10.07 55.3
(7)
Smith Sound 10.70 56.4
(9) (5)
Southampton Island 10.83 57.3 10.34 56.9
An interesting point is that in the north and northeast, where the skulls are longest, there is evidently a slightly greater relative development of the occipital portion of the vault, or slightly lesser development of the frontal portion.
Some additional points of interest appear when the basion-nasion: skull-length index, taken collectively for the two sexes, is compared in the different groups. All these comparisons suffer, naturally, from unevenness and often insufficiency of the numbers of specimens, yet some of the results are very harmonious with those brought out repeatedly by other data. Thus the St. Lawrence material stands once more close to the medium of the southwestern and midwestern groups; Barrow and Point Barrow are almost identical; and so are the Old Igloos from near Barrow and Greenland. The St. Michael islanders show very favorably in the midwest, the Shishmarefs in the northwest and the Southampton islanders in the northeast.
Eskimo Skulls: Basion-Nasion Line in Relation to Skull Length
BN×100
SL
BOTH SEXES TOGETHER IN ASCENDING ORDER
Southwestern and midwestern
(5)
Chukchee 54.8
(6)
Pilot Station, Lower Yukon 55.2
(11)
Little Diomede Island 55.6
(24)
Nelson Island 55.9
(115)
Nunivak Island 56.0
(10)
Mumtrak 56.1
(279)
St. Lawrence Island 56.2
(5)
Southwestern Alaska 56.2
(29)
Pastolik 56.4
(10)
Togiak 56.5
(31)
Indian Point and vicinity (Siberia) 56.5
(13)
Hooper Bay 56.6
(14)
St. Michael Island 56.8
Northwestern
(51)
Igloos southwest of Barrow 55.9
(99)
Point Barrow 55.9
(69)
Barrow 56.1
(34)
Wales 56.1
(215)
Point Hope 57.0
(20)
Shishmaref 57.1
Northern and northeastern
(33)
Baffin Land and vicinity 55.4
(10)
Northern Arctic 55.7
(7)
Hudson Bay and vicinity 56.0
(100)
Greenland 56.1
(7)
Smith Sound (male) 56.4
(14)
Southampton Island 57.1
The next table gives the percentage relations of the basion-nasion diameter to the mean diameter of the skull. The correlation of the two is even closer than in the case of the skull length, and the grouping, while in the main alike, seems in general even more in harmony with that in previous comparisons. The St. Lawrence Island females are very exceptional, as was also apparent in other connections. The unusual smallness of their skull (compare section on Cranial module) is evidently due to a poor development of its posterior half.
Eskimo Crania: Percentage Relation of the Basion-Nasion Diameter to Mean Cranial Diameter (Cranial Module)
BN×100
CM
BOTH SEXES TOGETHER IN ASCENDING ORDER
Southwestern and Midwestern
Pilot Station, Yukon 65.6
Chukchee 66.0
Little Diomede Island 66.1
Hooper Bay 66.4
Nelson Island 66.7
Togiak 66.9
Southwest Alaska 67.3
Indian Point, Siberia 67.4
Mumtrak 67.4
Nunivak Island 67.6
Pastolik 67.6
St. Michael Island 68.0
St. Lawrence Island:
Male 67.2
Female (69.6)
Northwestern
Wales 67.7
Point Barrow 67.8
Point Hope 68.1
Barrow 68.4
Old Igloos 69.0
Shishmaref 69.2
Northern Arctic and northeastern
Baffin Land 67.4
Hudson Bay 67.6
Smith Sound (male) 67.6
North Arctic 68.1
Greenland 68.5
Southampton Island 68.7
PROGNATHISM
Since better understood, the subject of facial prognathism has lost much of its allure in anthropology; yet the matter is not wholly without interest.
Facial protrusion is as a rule secondary to and largely caused by alveolar protrusion, which in turn is caused by the size and shape of the dental arch; and the dental arch is generally proportional to the size of the teeth. The form of the arch is, however, quite influential. With the teeth identical in size a narrow arch will be more, a broad arch less protruding, and a narrow arch with small teeth may protrude more than a broad one with larger teeth. Another influence is that of the height of the upper face, the same arch protruding more in a low face than in a high one. And still another factor is the incline of the front teeth, though this affects merely the appearance of prognathism and not its measurements.
There are different ways of measuring facial prognathism, and with sufficient care all may be effective; I prefer, for practical reasons, linear measurements from the basion, which, together with the facial and subnasal heights, give triangles that can readily be reconstructed on paper and allow a direct measurement of both the facial and the alveolar angle. The three needed diameters from basion are taken, the first to the "prealveolar point," or the most anterior point on the upper dental arch above the incisors; the second to the "subnasal point," or the point on the left (for convenience) of the nasal aperture, where the outer part of its border passes into that which belongs to the subnasal portion of the maxilla (the point where the subnasal slant begins); and the third to nasion. The facial height is that from the alveolar point (lowest point of the upper alveolar border in the median line) to nasion; while for the subnasal height, which can not be measured directly, I utilize the difference between the facial and nasal heights, which is very close to the needed dimension.
The important basion-nasion diameter has already been considered. That to the subnasal point needs no comment. That to the prealveolar point shows in the western and other Eskimo as follows:
Eskimo Crania: Basion-Prealveolar Point Diameter
All Eskimo
Males:
Mean diameter centimeters 10.54
Mean relation to length of skull per cent 56.3
Females:
Diameter centimeters 9.99
Relation per cent 55.8
MALES
A = Basion prealveolar point diameter B = Its relation to length of skull
Southwestern and midwestern Northwestern Northern Arctics and northeastern
A B A B A B
10.38 56.4 10.58 56.4 10.65 56.2
Mean skull lengths
18.41 18.75 18.96
FEMALES
9.85 55.7 10.06 56.3 10.06 55.4
Mean skull lengths
17.69 17.86 18.15
As in other details, so here there is a remarkable similarity between the skulls from the three large areas, pointing both to the unity of the people and to absence of heterogeneous admixtures. As the skull length increases so does the basi-alveolar line, but the relative proportions of the two remain very nearly the same.
The relative value of the basi-alveolar length in the males, compared to the length of the skull, is in general about 0.5 per cent higher than it is in the females. This is just about the excess of the relative proportion of the length of the male dental arch when compared to the same skull dimension. The general mean skull length in the Eskimo male approximates 18.705, in female 17.899 centimeters; the mean length of the arch is, in the male, close to 5.625, in the female 5.365 centimeters; and the percentage relation of the latter to the former is 30.6 in the males, 30 in the females. The relatively slightly greater basi-alveolar length in the males is evidently, therefore, at least partly due to the relatively longer male dental arch, which in turn is doubtless due to the somewhat larger teeth in the males.[156]
Notwithstanding the just discussed slight sex difference in the Eskimo, the facial angle, i. e., the angle between the basi-alveolar line and the line nasion-alveolar point, is equal in the two sexes. This equalization is due largely, if not wholly, to the effect in the males of the relatively longer basio-nasion diameter (v. a.), while the alveolar angle, or that between the basi-alveolar and the subnasal lines, is in general by about 1 per cent lower in the females (males, 56°; females, 55°), indicating a slightly greater slant of the subnasal region in the female, which can only be due to a relatively slightly shorter in this sex of the basion-subnasal point diameter. As a matter of fact, the percentage relation of this diameter to the length of the skull amounts in the males to 56.3, in the females to but 55.6.
Compared to that in the Indians, the facial angle in the Eskimo skulls shows close affinities. Its value (69°) is very nearly the same as in the mound skulls from Arkansas and Louisiana (males 70.7°, females 69°). In other Indians it ranges from close to 68° to 71.5°. In the Munsee it reached 73.5°. In whites, according to Rivet's data,[157] it ranges from about 72° to 75°; in a group of negroes it was 68.5°. In American and other negro crania measured by me[158] it ranged from 67° to 70.5°, in Melanesians from 66° to 68°, in Australians from 67° to 69°.
The alveolar angle is more variable. It shows considerable individual, sex, and group differences. It averages slightly to moderately higher, which means a more open angle or less slant in the males than in the females. In the Eskimo as a whole it was seen to be approximately 56° in the males, 55° in the females; in the Munsee Indians (Bull. 62, Bur. Amer. Ethn.) it was males 59°, females 57°; in the Arkansas and Louisiana skulls (J. Ac. Sci., Phila., 1909, XIV) it averaged males 55°, females 52°. In my catalogue material it shows a group variation of 46.5° to 55.5° in the negro, 47.5° to 52.5° in the Australians, 46.5° to 50.5° in the Melanesians. In the whites it generally exceeds 60°.
Differences in facial and alveolar protrusion among the Eskimo according to area are small, yet they are not wholly absent. The figures below show that in the southwesterners and midwesterners, where the skull is more rounded, the prognathism is smallest; and that toward the north and northeast, where the skull is narrower and the palate (dental arch) tends to become longer, prognathism increases. The "Old Igloo" group shows once more such affinity with the Greenlanders that it is placed with the third subdivision.
Eskimo Skulls: Facial and Alveolar Angle with Principal Areas
Males Females
South- and midwest Northwest North and northeast South- and midwest Northwest North and northeast
Groups (13) (5) (6) (13) (5) (6)
Facial angle 68 69 70 67.5 69 70
Alveolar angle 55 56 55 54 55 54.5
Individual group differences in the facial and alveolar angle are moderate, yet evidently not negligible. (See next table.) The most prognathic, especially in the subnasal region, are the skulls from Nelson Island. A marked alveolar slant is also present in the Pilot Station Yukon group, and in Greenland. The least prognathic are the St. Michael Islanders, the Point Hope people, and those from Southampton Island. St. Lawrence stands once more near the middle of the southwesterners and midwesterners, and there are to be seen the principal old relations.
The main points shown by the above conditions are the group variability, particularly in the southwest and midwest; the tendency, on the whole, toward a slightly greater prognathy, both facial and alveolar, in this same area; and the evidence that the alveolar slant has some individuality.
Eskimo Skulls: Group Conditions in Facial and Alveolar Angle
South and Midwest Facial angle Alveolar angle
(20)
Nelson Island 66.3 51.5
(4)
Southwest Alaska 66.8 54.5
(4)
Chukchee 66.8 57.0
(21)
Indian Point 67.0 56.5
(8)
Togiak 67.0 54.0
(242)
St. Lawrence Island 67.8 55.3
(86)
Nunivak Island 67.8 56.5
(23)
Pastolik 68.3 54.8
(10)
Hooper Bay 68.3 55.3
(10)
Little Diomede Island 68.5 57.5
(9)
Mumtrak 68.8 55.3
(5)
Pilot Station, Yukon 68.8 52.0
(10)
St. Michael Island 70.0 56.8
Northwest
(11)
Sledge Island 69.5 54.9
(31)
Wales 67.8 56.0
(17)
Shishmaref 68.3 55.8
(73)
Point Barrow 69.5 56.0
(43)
Barrow 69.8 56.8
(181)
Point Hope 70.5 56.5
North and northeast
(11)
North Arctic 68.5 54.5
(24)
Baffin Land 70.0 55.0
(87)
Greenland 69.8 53.8
(35)
Old Igloos near Barrow 70.3 55.8
(7)
Hudson Bay 70.3 56.8
(12)
Southampton Island 71 55
ESKIMO CRANIA
Southwestern and Western Alaska, Bering Sea Islands, and Asiatic Coast
MALES
Prince William Sound Kodiak Island Unalaska Peninsula Nushagak Bay and Kanakanak Togiak Mumtrak Nunivak Island Nelson Island Tanunok Village Hooper Bay Lower Yukon and delta Pilot Station, lower Yukon Kotlik and Pastolik St. Michael Island St. Lawrence Island Little Diomede Island Northeastern Asia
Indian Point (E. Cape) Puotin (NW. of E. Cape) Chukchi (in or near Bering Strait)
Vault: (1) (1) (1) (1) (4) (4) (46) (9) (9) (3) (3) (11) (8) (153) (5) (14) (2) (3)
Length 18.1 18.6 17.8 17.4 18.30 18.10 18.81 18.73 17.86 18.57 18.90 18.44 18.23 18.40 18.12 18.59 18.95 18.63
(1) (1) (1) (1) (4) (4) (46) (9) (9) (3) (3) (11) (8) (153) (5) (14) (2) (3)
Breadth 13.8 14.4 14.1 14.4 14.20 14.20 14.09 14.44 14.43 14.13 15.07 13.90 13.84 14.19 14.28 14.32 14.45 14.67
(1) (1) (1) (1) (4) (4) (46) (9) (9) (3) (3) (11) (8) (145) (5) (13) (2) (3)
Height 12.8 14 13.6 13.4 13.25 13.35 13.69 13.60 13.60 13.67 13.77 13.60 13.83 13.68 13.60 13.68 14.30 13.37
(1) (1) (1) (1) (4) (4) (46) (9) (9) (3) (3) (11) (8) (145) (5) (13) (2) (3)
Cranial Module 14.90 15.67 15.17 15.07 15.25 15.22 15.53 15.59 15.30 15.46 15.91 15.31 15.30 15.42 15.33 15.54 15.90 15.56
(1) (1) (1) (3) (4) (46) (9) (9) (3) (3) (11) (8) (142) (5) (3)
Capacity 1,380 1,485 1,440 1,447 1,465 1,504 1,556 1,519 1,490 1,660 1,486 1,461 1,462 1,470 1,490
(1) (1) (1) (1) (4) (4) (46) (9) (9) (3) (3) (11) (8) (153) (5) (14) (2) (3)
Cranial Index 76.2 77.4 79.2 82.3 77.6 78.5 75 77.2 80.8 76.1 79.7 75.4 75.9 77.1 78.8 77 76.3 78.7
(1) (1) (1) (1) (4) (4) (46) (9) (9) (3) (3) (11) (8) (145) (5) (13) (2) (3)
Mean height Index 80.3 84.8 85.3 84.3 81.6 82.7 83.2 82 84.2 83.6 81.6 84.1 86.2 84 83.9 83 85.6 80.3
(1) (1) (1) (1) (4) (4) (46) (9) (9) (3) (3) (11) (8) (145) (5) (13) (2) (3)
Height-breadth index 90.7 97.2 96.4 93 93.3 94 97.1 94.2 94.2 96.7 91.4 97.8 99.9 96.4 95.2 95.2 98.9 91.1
Face: (1) (1) (2) (3) (24) (7) (7) (3) (7) (2) (24)
Menton-nasion 11.8 12.6 12.90 12.17 12.95 13 12.44 12.40 12.67 12.20 12.70
(1) (1) (1) (3) (3) (43) (9) (8) (3) (2) (9) (7) (139) (5) (10) (2) (2)
Nasion-upper alveolar point 7.5 7.8 7.6 8 7.60 7.83 8.19 7.69 7.87 7.85 7.78 7.86 7.82 7.58 7.91 8.05 8.10
(1) (1) (1) (1) (3) (4) (45) (9) (9) (3) (3) (9) (8) (148) (5) (14) (2) (3)
Diameter-bizygomatic maximum 13.4 14.8 14.1 14.6 14.07 13.90 14.32 14.44 14.17 14.30 14.97 14.13 13.99 14.20 13.52 14.37 14.65 14.53
(1) (1) (2) (3) (24) (7) (7) (2) (7) (2) (24)
Facial Index, total 79.7 86.3 95.6 88.8 90.3 90.5 87.4 82.4 90.1 87.8 88.8
(1) (1) (1) (3) (3) (43) (9) (8) (3) (2) (9) (7) (13) (5) (10) (2) (2)
Facial Index, upper 56 49.3 52.1 56.9 55.5 54.6 56.7 54.1 55 52.2 55 56.4 55.1 56.1 55.7 55 55.7
Basio-facial: (1) (1) (3) (1) (3) (42) (7) (8) (3) (2) (7) (7) (131) (4) (8) (2) (2)
Basion alveolar point 11 10.5 10.43 10 10.43 10.65 10.61 10.25 10.20 10.35 10.40 10.21 10.43 10.25 10.40 10.95 10.50
(1) (1) (1) (1) (3) (4) (44) (9) (9) (3) (3) (10) (8) (143) (4) (13) (2) (3)
Basion-subnasal point 9.4 9.4 9 8.6 9.37 9.12 9.51 9.28 9.12 9.20 9.07 9.17 9.04 9.26 9.12 9.35 9.80 9.10
(1) (1) (1) (1) (3) (4) (46) (9) (9) (3) (3) (11) (8) (145) (4) (13) (2) (3)
Basion-nasion 10.4 10.8 10.2 9.9 10.47 10.32 10.55 10.46 10.29 10.37 10.27 10.41 10.44 10.36 10.18 10.48 10.90 10.20
(1) (1) (1) (4) (3) (41) (7) (8) (3) (2) (7) (7) (131) (4) (8) (2) (2)
Facial angle 65.5 72 67.5 68 69 68 66 68 69 70.5 69 69 67.5 68 67 68 66
(1) (1) (1) (4) (3) (41) (7) (8) (3) (2) (7) (7) (131) (4) (8) (2) (2)
Alveolar angle 48.5 56.5 49 56.5 55 58 53 55.5 59.5 53 56 56.5 56.5 55.5 57 58 57.5
Orbits: (1) (1) (1) (1) (3) (4) (42) (9) (9) (3) (3) (11) (8) (145) (5) (14) (2) (3)
Mean height 3.47 3.55 3.62 3.67 3.64 3.45 3.59 3.75 3.66 3.76 3.57 3.67 3.74 3.68 3.45 3.80 3.60 3.66
(1) (1) (1) (1) (3) (4) (42) (9) (9) (3) (3) (11) (8) (145) (5) (14) (2) (3)
Mean breadth 3.85 4.07 4 3.9 3.95 4.09 4.02 4.08 3.92 3.94 4.07 3.98 4.04 4.03 3.88 4.10 4.25 4.01
(1) (1) (1) (1) (3) (4) (42) (9) (9) (3) (3) (11) (8) (145) (5) (14) (2) (3)
Mean index 90.2 87.1 90.7 94.2 92.2 84.3 89.2 92 93.4 95.5 87.7 92.3 93.3 91.2 89.1 92.7 84.7 91.1
Nose: (1) (1) (1) (1) (3) (4) (44) (9) (9) (3) (3) (11) (8) (148) (5) (14) (2) (3)
Height 4.9 5.1 5.4 5.3 5.57 5.49 5.35 5.59 5.41 5.45 5.37 5.44 5.36 5.42 5.30 5.57 5.47 5.63
(1) (1) (1) (1) (3) (4) (44) (9) (9) (3) (3) (11) (8) (148) (5) (14) (2) (3)
Breadth 2.4 2.45 2.45 2.45 2.35 2.54 2.35 2.41 2.43 2.23 2.57 2.51 2.26 2.45 2.36 2.55 2.50 2.30
(1) (1) (1) (1) (3) (4) (44) (9) (9) (3) (3) (11) (8) (148) (5) (14) (2) (3)
Index 49 48 45.4 46.2 42.2 46.3 43.8 43 44.9 41 47.8 46.2 42.1 45.2 44.6 45.7 45.7 40.8
Upper alveolar arch: (1) (1) (1) (3) (3) (44) (8) (8) (3) (2) (7) (7) (121) (5) (8) (2) (2)
Length 5.9 5.6 5.5 5.60 5.40 5.66 5.73 5.46 5.40 5.70 5.57 5.44 5.63 5.38 5.57 5.70 5.95
(1) (1) (1) (3) (3) (44) (8) (8) (3) (2) (7) (7) (121) (5) (8) (2) (2)
Breadth 6.9 6.8 6.6 6.43 6.63 6.79 6.68 6.65 6.63 7.40 6.70 6.63 6.79 6.46 6.66 6.60 7.15
(1) (1) (1) (3) (3) (44) (8) (8) (3) (2) (7) (7) (121) (5) (8) (2) (2)
Index 87 82.4 83.3 87 81.4 83.4 85.8 82.1 81.4 77 83.4 82.1 82.9 83.3 83.6 86.4 83.2
(1) (1) (2) (4) (28) (8) (8) (3) (11) (2) (26) (2)
Lower jaw: Height at symphysis 3.3 4 3.8 3.55 4 3.91 3.63 3.63 3.75 3.65 3.62 3.90
ESKIMO CRANIA—Continued
Seward Peninsula to Point Barrow and Eastward to Greenland
MALES
Golovnin Bay Cape Nome Sledge Island Port Clarence Wales Shishmaref Kotzebue Point Hope Barrow and vicinity Old Igloos, southwest of Barrow Point Barrow Northern Arctic Melville Peninsula Southampton Island Hudson Bay and Ungava Bay Baffin Land, northern Devon, and vicinity Smith Sound Greenland
Vault: (3) (1) (5) (4) (19) (13) (2) (131) (37) (27) (49) (5) (1) (9) (5) (16) (7) (49)
Length 19.23 18 19.16 18.88 18.75 18.49 18.25 18.40 18.90 19.25 18.74 19.04 19.6 18.91 18.78 18.91 18.96 8.97
(3) (1) (5) (4) (19) (13) (2) (131) (37) (27) (49) (5) (1) (9) (5) (16) (7) (49)
Breadth 13.67 13.5 13.72 13.78 13.64 13.65 13.50 13.86 13.73 13.30 13.84 14.08 13.7 14.03 14.10 13.83 14.37 13.61
(3) (1) (5) (3) (19) (12) (2) (128) (35) (27) (47) (5) (1) (9) (5) (16) (7) (49)
Height 14.13 13.6 14.02 13.90 13.92 13.48 13.40 13.90 13.78 14.02 13.78 13.76 13.6 14.01 13.76 13.87 14.06 13.95
(3) (1) (5) (3) (19) (12) (2) (128) (35) (27) (47) (5) (1) (9) (5) (16) (7) (49)
Cranial Module 15.68 15.03 15.63 15.57 15.66 15.19 15.05 15.39 15.46 15.52 15.44 15.63 15.63 15.65 15.55 15.55 15.81 15.51
(3) (1) (5) (18) (11) (2) (126) (5) (9) (1) (7) (42)
Capacity 1,483 1,325 1,498 1,474 1,395 1,398 1,474 1,324 1,563 1,450 1,566 1,518
(3) (1) (5) (4) (19) (13) (2) (131) (37) (27) (49) (5) (1) (9) (5) (16) (7) (49)
Cranial Index 71.1 75 71.6 73 72.8 73.8 74 75.3 72.6 69.1 73.9 74 70 74.2 75.1 73.1 75.8 71.8
(3) (1) (5) (3) (19) (12) (2) (128) (35) (27) (47) (5) (1) (9) (5) (16) (7) (49)
Mean height Index 85.9 86.1 85.3 84.8 85.9 84 84.4 86.2 84.6 86.2 84.7 83.1 81.7 85.1 83.7 84.9 84.4 85.7
(3) (1) (5) (3) (19) (12) (2) (128) (35) (27) (47) (5) (1) (9) (5) (16) (7) (49)
Height-breadth index 103.4 100.7 102.2 99 102 98.8 99.3 100.3 99.6 105.5 99.6 97.7 99.3 99.8 97.6 100.5 97.8 102.5
Face: (3) (1) (4) (1) (12) (6) (1) (4) (16) (2) (1) (1) (6) (4) (6) (6) (12)
Menton-nasion 12.67 12.6 12.73 13 12.74 12.30 (11.8) 12.40 12.39 13.10 14 12.8 12.63 12.18 12.27 12.13 12.38
(3) (1) (5) (3) (16) (10) (1) (118) (21) (261) (37) (5) (1) (9) (5) (12) (7) (46)
Nasion-upper alveolar point 7.97 8 7.83 7.73 7.81 7.60 (7.3) 7.52 7.89 7.71 7.86 8.02 8 7.67 7.56 7.61 7.64 7.61
(3) (1) (5) (3) (18) (10) (2) (124) (26) (26) (44) (5) (9) (5) (16) (7) (47)
Diameter-bizygomatic maximum 14.37 14.3 14.20 14.17 14.16 14.20 (13.85) 14.31 14.34 14.16 14.26 14.44 14.48 14.06 14.22 14.69 14.05
(3) (1) (4) (1) (12) (6) (1) (4) (16) (2) (1) (6) (4) (6) (6) (12)
Facial Index, total 88.2 88.1 89.3 89.7 90 87.2 88.1 6.7 86.9 90.7 94.6 87.2 87 85.9 82.4 87.1
(3) (1) (5) (3) (16) (10) (1) (114) (20) (24) (36) (5) (9) (5) (12) (7) (45)
Facial Index, upper 55.5 55.9 55.2 54.6 55.2 53.6 54.5 52.5 55 54.5 55.1 55.5 53 53.8 53.7 52 54.1
Basio-facial: (2) (1) (5) (3) (17) (10) (1) (105) (21) (20) (36) (5) (8) (5) (12) (7) (42)
Basion-alveolar point 10.4 10.9 10.62 10.87 10.55 10.60 10.7 10.31 10.39 10.45 10.39 10.46 10.76 10.58 10.41 10.26 10.54
(3) (1) (5) (3) (18) (11) (2) (123) (28) (27) (45) (5) (9) (5) (16) (7) (47)
Basion-subnasal point 9.57 9.9 9.58 9.63 9.43 9.44 (9.20) 9.28 9.31 9.33 9.23 9.20 9.52 9.52 9.24 9.39 9.32
(3) (1) (5) (3) (19) (12) (2) (128) (35) (27) (47) (5) (9) (5) (16) (7) (48)
Basion-nasion 10.87 10.8 10.88 10.77 10.64 10.50 (10.45) 10.49 10.61 10.70 10.54 10.68 10.83 10.60 10.51 10.70 10.60
(2) (1) (5) (8) (16) (10) (1) (105) (36) (5) (9) (5) (7) (42)
Facial angle 69.5 67.5 70 68 68.5 68.5 68.5 70 69 69 69 69.5 71.4 70
(2) (1) (5) (8) (16) (10) (1) (105) (36) (5) (9) (5) (7) (42)
Alveolar angle 60.5 59 57 53.5 57 56 54 57 56 55 53 59 57.7 56
Orbits: (3) (1) (5) (3) (19) (11) (2) (118) (28) (25) (43) (5) (1) (9) (5) (15) (7) (47)
Mean height 3.66 3.42 3.64 3.62 3.67 3.60 3.48 3.63 3.60 3.62 3.61 3.82 3.9 3.67 3.58 3.56 3.54 3.64
(3) (1) (5) (3) (19) (11) (2) (118) (28) (25) (43) (5) (1) (9) (5) (15) (7) (47)
Mean breadth 4.20 4.05 4.03 4.03 4.09 3.98 4.05 4.03 4.04 3.97 4.02 4.22 4.3 4.06 3.97 3.98 4.11 3.99
(3) (1) (5) (3) (19) (11) (2) (118) (28) (25) (43) (5) (1) (9) (5) (15) (7) (47)
Mean index 87.1 84.6 90.3 89.9 89.8 90.4 85.9 90.1 89.2 91.3 89.9 90.5 90.7 90.3 90 88.8 86.7 91.4
Nose: (3) (1) (5) (3) (19) (11) (2) (126) (29) (27) (46) (5) (1) (9) (5) (16) (7) (48)
Height 5.57 5.7 5.59 5.37 5.39 5.35 (4.95) 5.36 5.52 5.45 5.48 5.44 5.4 5.43 5.14 5.32 5.73 5.24
(3) (1) (5) (3) (19) (11) (2) (126) (29) (27) (46) (5) (1) (9) (5) (16) (7) (48)
Breadth 2.35 2.55 2.35 2.35 2.41 2.39 2.22 2.39 2.39 2.37 2.31 2.32 2.45 2.30 2.23 2.31 2.27 2.27
(3) (1) (5) (3) (19) (11) (2) (126) (29) (27) (46) (5) (1) (9) (5) (16) (7) (48)
Index 42.2 44.7 42 43.8 44.8 44.6 44.9 44.6 43.4 43.6 42.2 42.6 45 42.3 45.3 43.4 39.7 43.3
Upper alveolar arch: (3) (1) (5) (3) (17) (9) (1) (99) (15) (23) (33) (4) (9) (5) (11) (7) (44)
Length 6.13 6.1 5.70 5.90 5.69 5.74 5.5 5.55 5.59 5.57 5.63 5.80 5.84 5.78 5.63 5.50 5.63
(3) (1) (5) (3) (17) (9) (1) (99) (15) (23) (33) (4) (9) (5) (11) (7) (44)
Breadth 7 6.9 6.83 6.80 6.76 6.79 5.8 6.54 6.45 6.68 6.47 6.70 6.94 6.72 6.72 6.74 6.63
(3) (1) (5) (3) (17) (9) (1) (99) (15) (23) (33) (4) (9) (5) (11) (7) (44)
Index 87.6 88.4 83.5 86.8 84.2 84.6 94.8 84.9 86.6 83.4 86.9 86.6 84.2 86 83.8 81.6 85
(3) (1) (4) (1) (16) (7) (1) (4) (2) (22) (2) (1) (6) (4) (7) (6) (16)
Lower jaw: Height at symphysis 4 3.85 3.61 4.2 3.91 3.78 3.8 3.82 3.95 3.72 3.9 4.2 3.67 3.56 3.83 3.52 3.76
ESKIMO CRANIA—Continued
Western, Northern, and Eastern Eskimo
FEMALES
Unalaska Peninsula Togiak Mumtrak Nunivak Island Nelson Island Hooper Bay Yukon Delta (Kashunok) and lower Yukon Pilot Station, lower Yukon Kotlik and Pastolik St. Michael Island St. Lawrence Island Little Diomede Island Northeastern Asia
Indian Point Chukchee
Vault: (2) (7) (6) (70) (17) (4) (2) (3) (18) (6) (140) (7) (16) (2)
Length 17.90 17.17 17.27 17.89 17.42 17.42 18.7 17.8 17.72 17.72 17.69 18.04 17.64 18.25
(2) (7) (6) (70) (17) (4) (2) (3) (18) (6) (140) (7) (16) (2)
Breadth 13.70 14.17 13.92 13.65 13.71 13.70 13.95 14 13.62 13.38 13.60 13.71 13.74 14.30
(2) (7) (6) (70) (16) (4) (2) (3) (18) (6) (128) (7) (16) (2)
Height 13.10 12.86 12.85 13.15 12.78 12.62 13 13.20 13.04 13.07 13.21 13.50 13.25 13.60
(2) (7) (6) (70) (16) (4) (2) (3) (18) (6) (128) (7) (16) (2)
Cranial Module 14.90 14.73 14.68 14.90 14.64 14.68 (15.22) 15 14.81 14.72 14.87 15.09 14.88 15.38
(2) (6) (4) (66) (14) (4) (3) (18) (6) (120) (6) (2)
Capacity 1,352 1,375 1,376 1,353 1,334 1,246 1,442 1,359 1,293 1,335 1,359 1,512
(2) (7) (6) (70) (17) (4) (2) (3) (18) (6) (140) (7) (16) (2)
Cranial Index 76.5 82.7 80.6 76.3 78.7 78.6 74.6 78.7 76.8 75.5 77.4 76 77.9 78.4
(2) (7) (6) (70) (16) (4) (2) (3) (18) (6) (128) (7) (16) (2)
Mean height Index 82.9 82 82.4 83.4 82.1 81.1 (79.2) 83 83.2 84 84.2 85 84.5 83.6
(2) (7) (6) (70) (16) (4) (2) (3) (18) (6) (128) (7) (16) (2)
Height-breadth index 95.6 90.7 92.3 96.4 93.2 92.2 (92.8) 94.3 95.8 97.6 96.5 98.4 96.4 95.1
Face: (2) (4) (27) (10) (2) (2) (15) (3) (23) (1)
Menton-nasion 12.1 11.3 11.62 11.62 11.80 11.90 11.82 11.5 11.49 11.40
(2) (4) (6) (52) (14) (2) (3) (16) (3) (120) (6) (13) (2)
Nasion-upper alveolar point 7.80 7.30 7.05 7.27 7.18 7.30 7.40 7.49 7.13 7.29 7.38 7.41 7.40
(2) (4) (6) (63) (15) (4) (1) (3) (16) (5) (128) (7) (14) (2)
Diameter-bizygomatic maximum 13.40 13.12 13.1 13.27 13.37 13.37 13.9 13.47 13.26 13.12 13.31 13.09 13.34 13.25
(2) (4) (26) (10) (2) (2) (15) (3) (23) (1)
Facial Index, total 93.1 84.8 88.2 87 88.4 89.1 89 88.2 86.9 85.7
(2) (4) (6) (51) (14) (2) (3) (16) (3) (120) (6) (12) (2)
Facial Index, upper 58.2 55.6 53.6 54.8 53.6 54.7 55 56.5 54.7 54.8 56 55 55.9
Basio-facial: (2) (4) (6) (45) (14) (2) (3) (16) (3) (111) (6) (13) (2)
Basion-alveolar point 10.05 9.78 9.53 10.17 10.06 9.60 10.17 10.09 9.77 10.04 9.73 10.14 10.10
(2) (4) (6) (60) (15) (4) (1) (3) (18) (6) (119) (6) (15) (2)
Basion-subnasal point 8.80 8.55 8.50 8.97 8.76 8.55 8.9 8.80 8.86 8.80 8.88 8.78 8.95 9.05
(2) (7) (6) (69) (15) (4) (1) (3) (18) (6) (128) (7) (16) (2)
Basion-nasion 9.80 9.56 9.52 10.02 9.73 9.70 10.2 9.97 9.98 9.98 9.93 9.91 9.97 10
(2) (4) (6) (45) (13) (2) (3) (16) (3) (111) (6) (13) (2)
Facial angle 65.5 66 68.5 67.5 66.5 68.5 67 67.5 71 68 69 67 67.5
(2) (4) (6) (45) (13) (2) (3) (16) (3) (111) (6) (13) (2)
Alveolar angle 54.5 51.5 55.5 55 50 55 51 53.5 57 54 59.5 54 56.5
Orbits: (2) (3) (6) (59) (15) (4) (1) (3) (18) (5) (121) (6) (15) (2)
Mean height 3.65 3.59 3.53 3.51 3.50 3.56 3.5 3.54 3.62 3.61 3.60 3.60 3.59 3.41
(2) (3) (6) (59) (15) (4) (1) (3) (18) (5) (121) (6) (15) (2)
Mean breadth 3.92 3.85 3.81 3.86 3.81 3.89 3.8 3.89 3.86 3.78 3.91 4.01 3.90 3.79
(2) (3) (6) (59) (15) (4) (1) (3) (18) (5) (121) (6) (15) (2)
Mean index 93 93.5 92.6 91 91.8 91.7 92.1 91 94.1 95.5 92.1 89.7 91.9 90.1
Nose: (2) (5) (6) (63) (14) (4) (1) (3) (18) (5) (127) (6) (15) (2)
Height 5.32 5.06 5.03 4.99 5.06 4.95 5.5 5 5.19 4.95 5.13 5.15 5.16 5.20
(2) (5) (6) (63) (14) (4) (1) (3) (18) (5) (127) (6) (15) (2)
Breadth 2.58 2.32 2.23 2.32 2.34 2.35 2.45 2.33 2.31 2.17 2.39 2.28 2.45 2.65
(2) (5) (6) (63) (14) (4) (1) (3) (18) (5) (127) (6) (15) (2)
Index 47.5 45.8 44.2 46.4 46.3 47.5 44.5 46.7 44.5 43.8 46.6 44.4 47.4 50.5
Upper alveolar arch: (2) (4) (6) (46) (14) (2) (3) (15) (3) (109) (4) (12) (2)
Length 5.55 5.18 5.03 5.39 5.39 5.25 5.40 5.45 5.40 5.37 5.30 5.44 5.45
(2) (4) (6) (46) (14) (2) (3) (15) (3) (109) (4) (12) (2)
Breadth 6.55 6.40 6.13 6.31 6.32 6.45 6.60 6.38 6.23 6.46 6.52 6.40 6.90
(2) (4) (6) (46) (14) (4) (3) (15) (3) (109) (4) (12) (2)
Index 84.7 80.9 82.1 84.4 85.3 81.4 81.8 85.4 86.6 83.0 81.2 85 79
(2) (3) (32) (11) (4) (2) (17) (4) (25) (1)
Lower jaw: Height at symphysis 3.50 3.30 3.48 3.40 3.40 3.67 3.56 3.39 3.18 3.2
ESKIMO CRANIA—Continued
Western, Northern, and Eastern Eskimo
—Continued
FEMALES
Seward Peninsula Port Clarence Wales Shishmaref Kotzebue Sound and Kobuk River Point Hope Barrow and vicinity Old Igloos north of Barrow Point Barrow Northern Arctic Southampton Island Hudson Bay and vicinity Baffin Land, North Devon and vicinity Smith Sound Greenland
Golovnin Bay Cape Nome Sledge Island
Vault: (4) (2) (9) (3) (15) (10) (1) (92) (36) (25) (52) (10) (6) (2) (17) (2) (52)
Length 17.92 17.70 18.13 17.63 18.05 17.73 17.2 17.5 7 17.77 18.11 17.91 18.21 18.17 17.55 18.33 18 18.04
(4) (2) (9) (3) (15) (10) (1) (92) (36) (25) (52) (10) (6) (2) (17) (2) (52)
Breadth 13.22 13.25 13.50 13.50 13.35 13.29 13.4 13.43 13.23 12.72 13.32 13.36 13.70 13.60 13.44 13.80 12.98
(4) (2) (9) (3) (15) (9) (1) (89) (34) (24) (52) (10) (6) (2) (17) (2) (52)
Height 13.20 13 13.22 12.90 13.21 13.16 13.4 13.20 12.97 13.21 13.03 12.99 13.69 12.55 13.34 13.65 13.12
(4) (2) (9) (3) (15) (9) (1) (89) (34) (24) (52) (10) (6) (2) (17) (2) (52)
Cranial Module 14.78 14.65 14.95 14.68 14.87 14.72 14.67 14.72 14.66 14.72 14.75 14.85 15.18 14.57 15.04 15.15 14.72
(4) (2) (8) (1) (15) (6) (89) (3) (6) (1) (43)
Capacity 1,345 1,290 1,374 1,285 1,359 1,239 1,316 1,235 1,443 1,510 1,324
(4) (2) (9) (3) (15) (10) (1) (92) (36) (25) (52) (10) (6) (2) (17) (2) (52)
Cranial Index 73.8 74.8 74.5 76.6 73.9 75 77.9 76.4 74.5 70.2 74.4 73.4 75.4 77.5 73.3 76.7 72
(4) (2) (9) (3) (15) (9) (1) (89) (34) (24) (52) (10) (6) (2) (17) (2) (52)
Mean height Index 84.8 83.9 83.6 82.9 84 84.9 87.6 85.2 82.9 86.4 83.4 82.3 85.9 80.6 84 85.8 84.6
(4) (2) (9) (3) (15) (9) (1) (89) (34) (24) (52) (10) (6) (2) (17) (2) (52)
Height-breadth index 99.8 98.1 97.9 95.5 99 98.9 100 98.2 98.1 104.6 97.8 97.2 99.9 92.3 99.3 98.9 101
Face: (3) (3) (11) (1) (1) (2) (15) (1) (3) (5) (2) (5)
Menton-nasion 12.03 11.93 11.85 12 11.9 12.05 11.21 12.7 11.7 11.60 11.20 11.52
(3) (1) (7) (1) (16) (9) (1) (78) (22) (18) (40) (7) (5) (2) (12) (2) (45)
Nasion-upper alveolar point 7.40 7.3 7.30 6.7 7.39 7.20 7.1 7.06 7.18 7.01 7.22 7.43 7.14 6.95 7.10 6.80 7.05
(4) (2) (7) (1) (1) (8) (1) (84) (23) (24) (46) (7) (5) (2) (14) (2) (50)
Diameter-bizygomatic maximum 13.2 5 13.15 13.26 13.1 13.29 13.21 13.4 13.32 13.16 13.08 13.06 12.96 13.82 12.65 13.27 13.20 13.03
(3) (3) (1) (1) (1) (2) (15) (3) (5) (2) (5)
Facial Index, total 90.9 90.9 89.6 91.6 88.5 88.3 86.8 84.8 86.6 84.9 85.7
(3) (1) (7) (1) (1) (8) (1) (77) (21) (18) (39) (6) (5) (2) (11) (2) (45)
Facial Index, upper 55.8 55.7 55.1 51.1 55.6 54.7 53 53.1 54.7 53.8 55.3 57.8 51.7 54.9 53.9 51.5 54.1
Basio-facial: (3) (1) (6) (1) (15) (8) (1) (76) (22) (15) (37) (6) (4) (2) (12) (2) (45)
Basion-alveolar point 10.27 10.3 10.25 9.8 10.24 10.38 9.2 9.72 9.85 10.13 9.77 10.03 10.02 9.4 10.13 9.35 10.09
(4) (2) (7) (2) (16) (8) (1) (83) (27) (21) (46) (10) (4) (2) (13) (2) (50)
Basion-subnasal point 9 8.85 9.16 8.8 9.04 9.25 7.9 8.72 8.86 9.12 8.73 8.85 9.02 8.35 9.05 8.35 8.94
(4) (2) (8) (3) (16) (9) (1) (89) (34) (24) (52) (10) (5) (2) (17) (2) (52)
Basion-nasion 10.10 10.05 10.29 9.93 10.01 10.16 9.5 9.89 10.01 10.18 9.94 10.07 10.34 9.75 10.11 9.65 10.13
(1) (6) (1) (15) (8) (75) (37) (6) (2) (45)
Facial angle 67 69 66 67 68 70 69 68 71.5 70
(1) (6) (1) (15) (8) (75) (37) (6) (2) (45)
Alveolar angle 54 53 41.5 55 55.5 56.5 55 54 54.5 54
Orbits: (4) (2) (7) (2) (16) (10) (1) (83) (25) (18) (42) (10) (5) (2) (13) (2) (47)
Mean height 3.57 3.52 3.58 3.55 3.52 3.43 3.30 3.54 3.61 3.47 3.55 3.50 3.64 (3.60) 3.53 3.51 3.55
(4) (2) (7) (2) (16) (10) (1) (83) (25) (18) (42) (10) (5) (2) (13) (2) (47)
Mean breadth 3.86 3.92 3.98 3.95 3.94 3.90 3.82 3.90 3.88 4.01 3.90 3.83 4.05 (3.80) 3.88 3.96 3.85
(4) (2) (7) (2) (16) (10) (1) (83) (25) (18) (42) (10) (4) (2) (13) (2) (47)
Mean index 92.5 89.8 90 89.4 89.3 88.1 86.3 90.8 93 91 90.7 91.4 86.6 (94.7) 91.3 88.6 92.4
Nose: (4) (2) (7) (1) (16) (10) (86) (27) (21) (46) (9) (5) (2) (13) (2) (50)
Height 5.20 5.02 5.10 4.9 5.08 4.93 4.9 5.04 5.19 5.02 5.11 4.83 5.06 4.90 4.98 5.30 4.99
(4) (2) (7) (1) (16) (10) (1) (86) (27) (21) (46) (9) (5) (2) (13) (2) (50)
Breadth 2.32 2.50 2.26 2.3 2.32 2.33 2.6 2.28 2.32 2.23 2.29 2.14 2.21 2.15 2.20 2.32 2.20
(4) (2) (7) (1) (16) (10) (1) (86) (27) (21) (46) (9) (5) (2) (13) (2) (50)
Index 44.6 49.8 44.3 46.9 45.7 47.3 53.1 45.3 44.7 44.4 44.9 44.4 43.7 43.9 44.3 43.9 44
Upper alveolar arch: (3) (1) (6) (1) (15) (6) (73) (23) (16) (33) (6) (4) (2) (12) (2) (45)
Length 5.77 5.5 5.61 5.3 5.61 5.67 5.5 5.21 5.22 5.34 5.25 5.38 5.50 4.85 5.44 5.20 5.35
(3) (1) (6) (1) (15) (6) (1) (73) (23) (16) (33) (6) (4) (2) (12) (2) (45)
Breadth 6.73 6.4 6.46 6.6 6.57 6.67 6.4 6.19 6.13 6.29 6.01 6.22 6.60 5.85 6.22 6.20 6.16
(3) (1) (6) (11) (15) (6) (1) (73) (23) (16) (33) (6) (4) (2) (12) (2) (45)
Index 85.7 85.9 86.8 80.3 85.3 85 85.9 84.3 85.1 84.9 87.4 86.5 83.3 82.9 87.6 83.9 86.8
(3) (1) (4) (14) (1) (1) (3) (3) (17) (1) (2) (2) (5) (2) (13)
Lower jaw: Height at symphysis 3.73 3.7 3.60 3.56 3.8 3.9 3.38 3.27 3.38 3.7 3.20 3.15 3.46 3.42 3.40