STATISTICS GONE MAD.
Reading edition
WITH APOLOGIES TO THE STATISTICAL SOCIETY AND MR. HOLT SCHOOLING. By J. G. Grant. Illustrated by the Author's diagrams.
Of late years our magazines have been overrun by the statistical fiend, and I propose to show how the thing is done.
I shall have the honour of laying before the reader a few startling statistics of facts and phenomena discovered by myself. These discoveries might have been made by anybody who would take the trouble, and the great point about them is what Mr. Jerome terms their hopeless veracity.
But let me plunge at once in medias res; and let me mention, before we proceed further, that my statistics will be illustrated by scientific diagrams, invented by myself without the assistance of any man, woman, or child whatsoever.
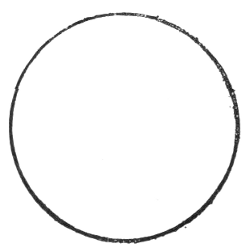
Any ordinary intelligent person must have observed that human beings differ in many things, and especially in personal appearance. This is an absolute fact. And here is a terrible field for the fiend aforementioned. I begin at once, and I herewith give a diagram, which I am able to produce after years of observation. The number of dots inside the circle in Fig. 1 represents, with great accuracy, the number of men—and women, for that matter—in every hundred, who are born bald. In order to spare the reader the trouble of counting the dots, I have counted them myself, and find there are one hundred. The reader can count them in Fig. 2 for himself, without any undue strain. This figure represents the percentage of men with green whiskers.
FIG. 1. THESE 100 DOTS SHOW HOW MANY PEOPLE PER CENT. ARE BORN BALD.
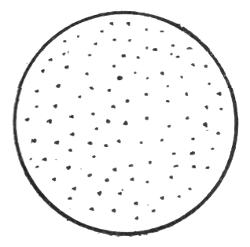
FIG. 2. PERCENTAGE OF MEN WITH GREEN WHISKERS.
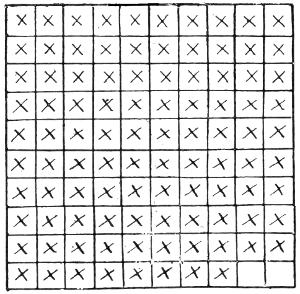
Talking of hair reminds me, and so in Fig. 3 I give another diagram, which shows at a glance the number per cent, of red-headed men who are thoroughly convinced that their hair—if any—is any colour under the sun except red. I have counted the crosses in the hundred squares, and find there are ninety-eight; the ninety-ninth man is colour-blind as a rule, and the hundredth hasn't got any hair; so neither cares a rap.
FIG. 3 SHOWS THE NUMBER PER CENT. OF RED-HEADED MEN WHO DENY THE RIGHT COLOUR OF THEIR HAIR.
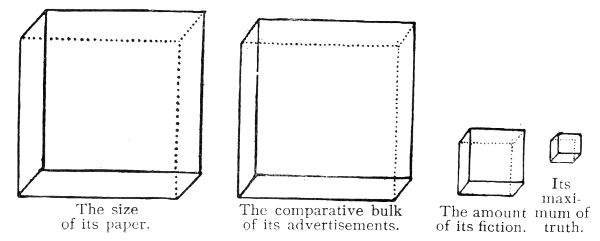
From hair we pass, by an easy transition, to the average monthly magazine. Let us put down its average composition diagramatically. Let us represent by the first cube the size of the paper, the whole paper, and nothing but the paper. The other three cubes explain themselves and that, by the way, is what scientific diagrams are sometimes not very guilty of.
FIG 4. THE AVERAGE MONTHLY MAGAZINE.
Do any of you ever go to smoking concerts? Yes? Very well, you will appreciate the next scientific diagram for its mathematical exactness. I have a friend called Smith—he spells it Smythe, but that's nothing—and the diagram refers to certain events which (as the descriptive reporter would say) sometimes transpire.
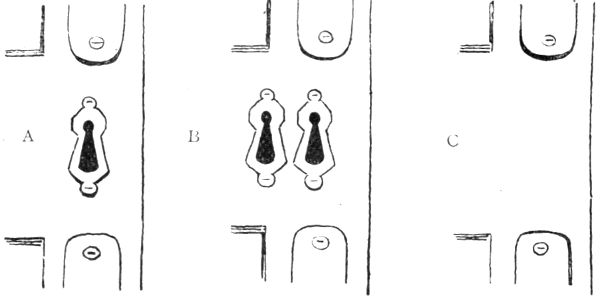
Fig. 5 A shows the number of keyholes observed in the door by Smith (or Smythe) as he is about to operate with his latch-key on returning home from business at 5 p.m. Fig. 5 B shows the number he sometimes sees when he returns from his club about 11.30 p.m. As a rule he attempts, on this occasion, with great perseverance to put the right key in the wrong hole, or vice versá. Fig. 5 C shows the number he doesn't see when he returns home even later than 11.30 p.m.
THE TRAGEDY OF A KEYHOLE. Fig. 5 represents the number of keyholes seen by Smythe in the same door at different times of the day and night.
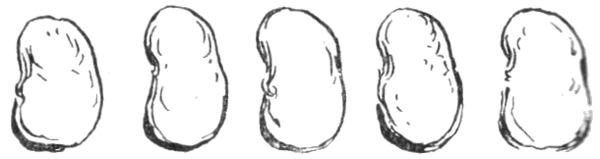
Let us change the subject, my friends, as it must be very painful to you to read such things about my poor friend Smith (or Smythe). I can easily change it—it is all the same to me. I will now give you an "easy one"—so easy that it can be comprehended by a person of the meanest intelligence. Fig. 6 merely shows in a simple and unobtrusive manner how many beans make five. There is no answer to this.
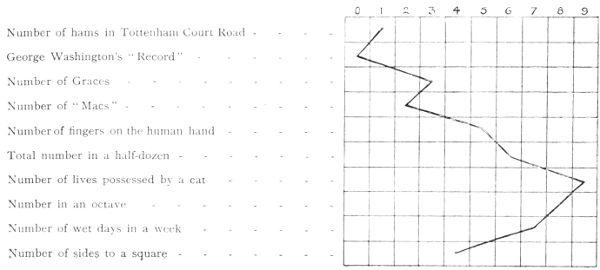
We may now attempt something more difficult and elaborate. In point of fact, let us proceed to "trace a curve," as we say in the differential and integral trigonometry. The curve explains itself, and to those who are not acquainted with the Higher Mathematics the diagram may seem a bit mixed; but the same may be said of most things in this wicked world.
It is evident that diagrams such as Fig. 7 might be manufactured ad infinitum, also ad nauseam.
At this stage of the proceedings I may say that I challenge and defy the whole world to controvert, deny, or disprove any one of my statistics.
But, really, if anyone has any faculty for statistic-mongering, and wishes to exercise that faculty, let me cordially recommend him to try his hand on statistics taken from astronomy, and, if he emerges scatheless from the fray, he may thank his stars (no pun intended).
He might, for example, calculate how long a London Chatham and Dover train would take to travel from Capella to the Great Bear, supposing it ran(!) day and night. Or again, he might reckon how long it would take an average bargee to circumnavigate the canals of Mars.
FIG. 6 ACCURATELY TELLS HOW MANY BEANS MAKE FIVE.
Or yet again he might work out how many threepenny pieces it would require piled one above the other to reach from Whitechapel to the Moon.
FIG. 7.
Scientific diagrams of such things as these would be extremely interesting, and nearly as useful as those of the present article.
"IT WAS ALL I COULD DO TO GUARD MYSELF FROM THE FURIOUS LUNGES OF THE COUNT."