VOLUME XVII SLICE VI Map to Mars (continued 2)
Reading edition
The cylindrical and modified conical projections of Marinus and Ptolemy were still widely used, the stereographical projection of Hipparchus, was for the first time employed for terrestrial maps in the 16th century, but new projections were introduced in addition to these. The earliest of these, a trapeziform projection with equidistant parallels, by D. Nicolaus Germanus (1466), naturally led to what is generally known as Flamsteed’s projection. Joh. Stabius (1502) and his pupil J. Werner (1514) devised three heart-shaped projections, one of which was equivalent. Petrus Apianus (1524) gave his map an elliptical shape. H. Glareanus (1510) was the first to employ an equidistant zenithal polar projection.
No reasonable fault can be found with the marine surveyors of this period, but the scientific cartographers allowed themselves too frequently to be influenced by Ptolemaic traditions. Thus Gastaldo (1548) presents us with a map of Italy, which, except as to nomenclature, differs but little from that of Ptolemy, although on the Portolano charts the peninsula had long since assumed its correct shape. Many of the local maps, too, were excellent specimens of cartography, but when we follow any cartographer of the period into regions the successful delineation of which depended upon an intelligent interpretation of itineraries, and of information collected by recent travellers, they are generally found to fail utterly. This is illustrated by the four sketch maps shown in fig. 28.
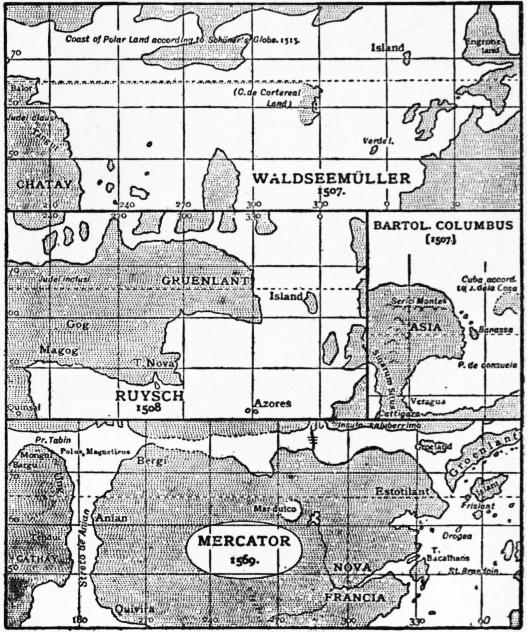
Fig. 28.
Columbus, trusting to Toscanelli’s misleading chart, looked upon the countries discovered by him as belonging to eastern Asia, a view still shared about 1507 by his brother Bartolomeo. Waldseemüller (1507) was the first to separate America and Asia by an ocean of considerable width, but J. Ruysch (1508) returns to the old idea, and even joins Greenland (Gruenlant) to eastern Asia. Bologninus Zalterius on a map of 1566, and Mercator on his famous chart of 1569, separates the two continents by a narrow strait which they call Streto de Anian, thus anticipating the discovery of Bering Strait by more than a hundred and fifty years. Anian, however, which they place upon the American coast, is no other than Marco Polo’s Anica or Anin, our modern Annam. Such an error could never have arisen had the old compilers of maps taken the trouble to plan Marco Polo’s routes.
Globes, both celestial and terrestrial, became popular after the discovery of America. They were included among the scientific apparatus of ships and of educational establishments. Columbus and Magellan had such globes, those of the latter produced by P. Reinel (1519), and Conrad Celtes tells us that he illustrated his lectures at the university of Vienna with the help of globes (1501). Globes were still engraved on copper, or painted by hand, but since 1507, in which year Waldseemüller published a small globe of a diameter of 110 mm., covered with printed segments or gores, this cheap and expeditious method has come into general use. Waldseemüller constructed his gores graphically, A. Dürer (1525) and Hen. Loriti Glareanus (1527) were the first who dealt scientifically with the principles underlying their construction. Globes covered with printed gores were produced by L. Boulenger (1514), Joh. Schöner (1515), P. Apianus, Gemma Frisius (1530) and G. Mercator (1541). Leonardo da Vinci’s rough map of the world in 8 segments (c. 1513) seems likewise to have been intended for a globe. Of J. Schöner we know that he produced four globes, three printed from segments (1515, 1523, 1533), and one of larger size (diam. 822 mm.), which is drawn by hand, and is preserved in the Germanic Museum at Nuremberg. Among engraved globes, one of the most interesting is that which was discovered by R. M. Hunt in Paris, and is preserved in the Lenox Library, New York. Its diameter is only 41⁄2 in. (127 mm.). The so-called “Nancy globe” is of chased silver, richly ornamented, and formerly served the purpose of a pyx. Its diameter is 160 mm., its date about 1530. About the same date is assigned to a globe by Robert de Bailly, engraved on copper and gilt (diam. 440 mm.). Celestial globes were manufactured by Regiomontanus (d. 1476) at Nuremberg, by Joh. Stöffler (1499), and by G. Hartmann (1535).
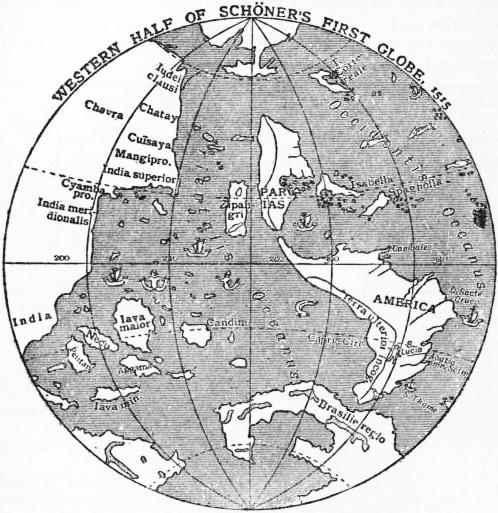
Fig. 29.
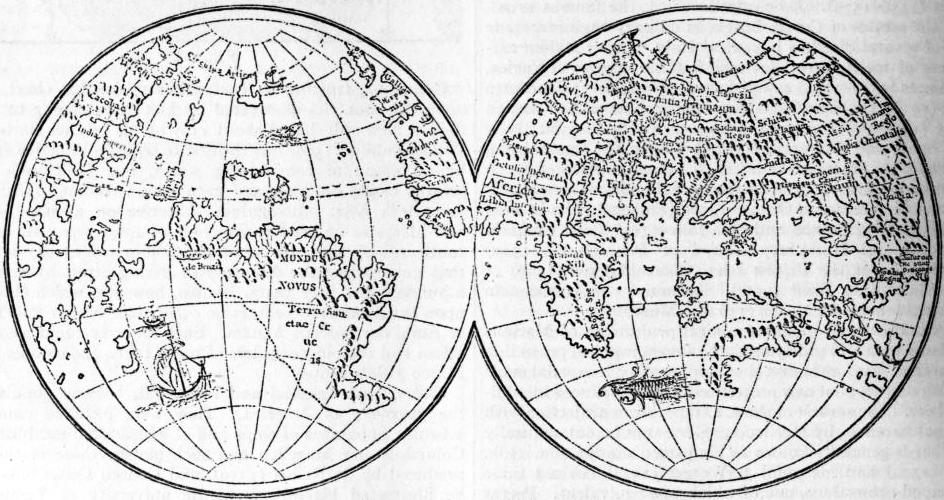
Fig. 30.—Lenox Globes (1510).
Mercator and his Successors.—Of Gerhard Kremer (1512-1594) the earliest works are a map of Palestine (1537), a map of the world on a double heart-shaped projection (1525), and a topographical map of Flanders based upon his own surveys (1540), a pair of globes (1541, diam. 120 mm.), and a large map of Europe which has been praised deservedly for its accuracy (1554). He is best known by his marine chart (1569) and his atlas. The projection of the former may have been suggested by a note by W. Pirkheimer in his edition of Ptolemy (1525). Mercator constructed it graphically, the mathematical principles underlying it being first explained by E. Wright (1594). The “Atlas” was only published after Mercator’s death, in 1595. It only contained nine maps, but after the plates had been sold to Jodocus (Jesse) Hondius the number of maps was rapidly increased, although Mercator’s name was retained. Mercator’s maps are carefully engraved on copper. Latin letters are used throughout; the miniatures of older maps are superseded by symbols, and in the better-known countries the maps are fairly correct, but they fail lamentably when we follow their author into regions—the successful delineation of which depends upon a critical combination of imperfect information.
Even before Mercator’s death, Antwerp and Amsterdam had become great centres of cartographic activity, and they maintained their pre-eminence until the beginning of the 18th century. Abraham Ortelius (1527-1592), of Antwerp, a man of culture and enterprise, but not a scientific cartographer, published the first edition of his Theatrum orbis terrarum in 1570. It then contained 53 maps, by various authors. By 1595 the number of maps had increased to 119, including a Parergon or supplement of 12 maps illustrating ancient history. In 1578 was published the Speculum orbis terrarum of Gerard de Jude or de Judaeis. Lucas Janszon Waghenaer (Aurigarius) of Enkhuizen published the first edition of his Spiegel der Zeevaart (Mariners’ Mirror) at Leiden in 1585. It was the first collection of marine maps, lived through many editions, was issued in several languages and became known as Charettier and Waggoner. In the same year Adrian Gerritsz published a valuable Paskaarte of the European Sea. Ten years afterwards, in 1595, W. Barentszoon published a marine atlas of the Mediterranean, the major axis of which he reduced to 42 degrees. Jodocus Hondius has already been referred to as the purchaser of Mercator’s plates. The business founded by him about 1602 was continued by his sons and his son-in-law, Jan Janszon (Jansonius) and others. By 1653 this firm had already produced atlases including 451 charts. Willem Janszon, the father of Hondius’s partner, published a collection of charts (1608), to which he gave the title of Het Licht der Zeevaart (the seaman’s light). Another cartographic publishing firm was established at Amsterdam in 1612 by Willem Janszon Blaeu (1571-1638), a friend of Tycho Brahe, from 1633 “mapmaker” of the states-general, and a man of scientific culture. He was succeeded by his son Jan (d. 1673) and grandson Cornelius, and before the end of the century turned out a Zee-Spiegel of 108 charts (1623), an Atlas novus (Nieuwe Atlas), 1642, enlarged in the course of time until it consisted of 12 folio volumes containing hundreds of maps. J. A. Colom in 1633 published a collection of maps under the quaint title of Vurig Colom der Zeevaert (Fiery Column of Navigation). Among more recent Dutch map publishers are Nicolaus Vischer (Piscator), R. Goos, H. Doncker, F. de Wit, and J. and G. van Keulen, whose atlases were published between 1681 and 1722. These Dutch maps and charts are generally accompanied by descriptive notes or sailing directions printed on the back of them. A similar work is the Arcano del mare of Sir Robert Dudley, duke of Northumberland, the numerous sheets of which are on Mercator’s projection (1631).
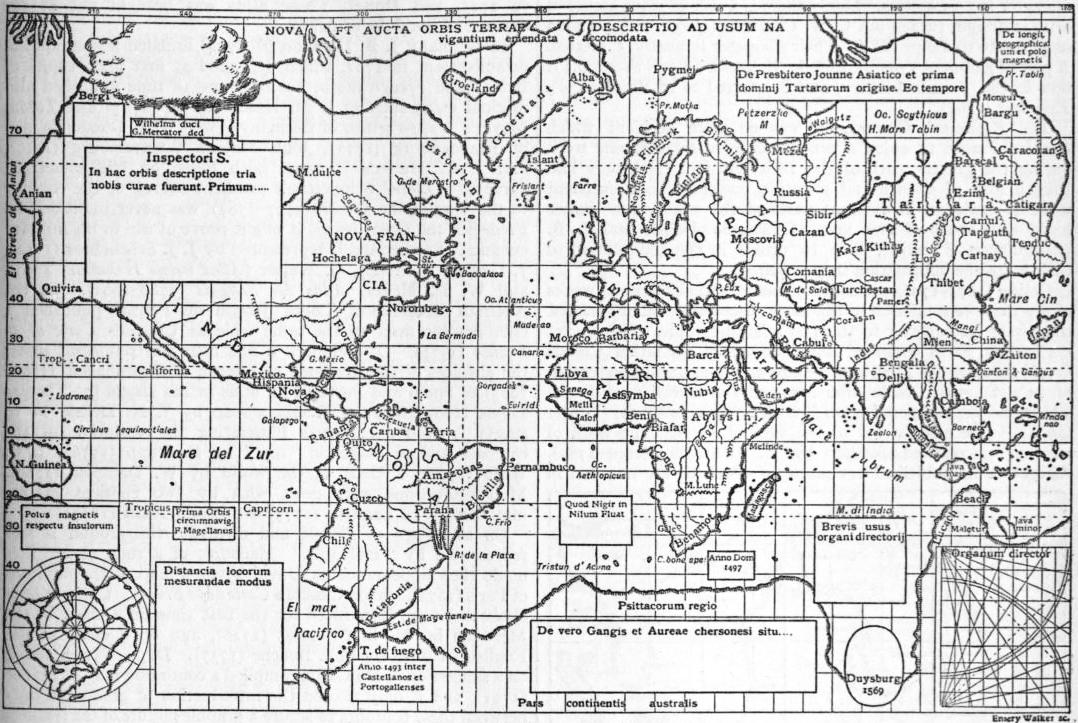
Fig. 31.—Mercator’s Chart of the World (1569).
In France, in the meantime, an arc of the meridian had been measured (1669-1670) by Jean Picard, numerous longitudes had been observed between 1672 and 1680 by the same, and by Phil. de Lahire (d. 1719), and these were utilized in a Carte de France “as corrected from the observations of the members of the Academy of Sciences” (1666-1699), in a map of the world (1694) by D. Cassini, as also in Le Neptune François (1693) with contributions by Pene, D. Cassini and others. These corrected longitudes were not yet available for the maps produced by Nicolas Sanson of Abbeville, since 1627. The cartographical establishment founded by him in that year was carried on after his death in 1667 by his sons, his son-in-law, P. Duval (d. 1683) and his grandson Robert du Vaugondy (d. 1766). Among the cartographers whom he employed were M. Tavernier and Mariette, and in many instances he mentioned the authors whose maps he copied. By 1710 the maps published by the firm numbered 466. Nicolas de Fer, the great rival of Sanson, and his heirs, are stated to have published as many as 600 maps after 1700.
In no other country of Europe was there at the close of the 16th century a geographical establishment capable of competing with the Dutch towns or with Sanson, but the number of those who produced maps, in many instances based upon original surveys, was large. Germany is thus represented, among others, by C. Henneberger (map of Prussia, 1576), by M. Oeder, (survey of Saxony, 1586-1607), A. Rauh (fine hill features on a map of the environs of Wangen and Lindau, 1617), W. Schickhardt (survey of Württemberg, 1624-1635), and G. M. Vischer (map of Austria and Styrai, 1669-1786); Switzerland by H. C. Gyger (Canton of Zürich, a masterpiece, 1667); Italy by G. A. Magini (1558-1610), and V. Coronelli, appointed cosmographer of the Venetian Republic, 1685, and founder of the Ac. Cosmogr. dei Argonauti, the earliest geographical society, and Diogo Homem, a Portuguese settled at Venice (1558-1574); Denmark by J. Mejer of Husum (1650); Sweden by A. Buraeus, the “father of Swedish cartographers” (1650-1660); the British Islands by Ch. Saxton (County Atlas of England and Wales 1575), J. Speed (Theatrum of Great Britain, 1610), Timothy Pont and Robert Gordon of Strathloch (map of Scotland, 1608), and A. Moll. A Novus atlas sinensis, based upon Chinese surveys, was published in 1655 by Martin Martini, S.J., a missionary recently returned from China. Isaac Voss, in his work De Nili (1659), published a map of central Africa, in which he anticipated D’Anville by rejecting all the fanciful details which found a place upon Filippo Pigafetta’s map of that continent.
The first maps illustrating the variation of the compass were published by Chris. Burrus (d. 1632) and Athanasius Kircher (Magnes, Rome, 1643), and maps of the ocean and tidal currents by the latter in his Mundus subterraneus (1665). Edmund Halley, the astronomer, compiled the first variation chart of scientific value (1683), as also a chart of the winds (1686).
Globes manufactured for commercial purposes by Blaeu and others have already been mentioned, but several large globes, for show rather than for use, were produced in addition to these. Thus A. Busch, of Limburg (1656-1664), manufactured a globe for Duke Frederick of Holstein, formerly at Gottorp, but since 1713 at Tsarskoye Zelo. It has a diameter of 11 ft. (3.57 metres) and is hollow, the inner surface of the shell being covered with a star map, and the outer surface with a map of the world. Professor Erh. Weigel (1696) produced a hollow celestial globe in copper, having a small terrestrial globe in its centre. Its diameter is 3.25 metres. Lastly there is a pair of giant globes of artistic design, turned out by V. Coronelli (1623), and intended as presents to Louis XIV. Their diameter is nearly 5 metres. A pair of globes of 1592 by Emeric Molineux (diam. 610 mm.) is now in the Temple Library, and is referred to in Blundeville’s Exercises (1594).
The Eighteenth Century.—It was no mere accident which enabled France to enjoy a pre-eminence in cartographic work during the greater part of the 18th century. Not only had French men of science and scientific travellers done excellent work as explorers in different parts of the world, but France could also boast of two men, Guillaume Delisle and J. B. Bourguignon d’Anville, able to utilize in the compilation of their maps the information they acquired.
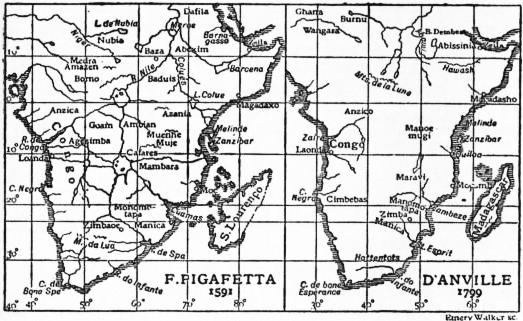
Fig. 32.
Delisle (1675-1726) published 98 maps, and although as works of art they were inferior to the maps of certain contemporaries, they were far superior to them in scientific value. On one of his earliest maps compiled under advice of his father Claude (1700), he gave the Mediterranean its true longitudinal extension of 41°. It was Delisle who assumed the meridian of Ferro, which had been imposed upon French navigators by royal order (1634), to lie exactly 20° to the west of Paris. The work of reform was carried further by B. D’Anville (1697-1782). Altogether he published 211 maps, of which 66 are included in his Atlas général (1737-1780); he swept away the fanciful lakes from off the face of Africa, thus forcibly bringing home to us the poverty of our knowledge (fig. 32), delineated the Chinese Empire in accordance with the map based on the surveys conducted during the reign of the emperor Kanghi, with the aid of Jesuit missionaries, and published in 1718; boldly refused to believe in the existence of an Antarctic continent covering half the southern hemisphere, and always brought a sound judgment to bear upon the materials which the ever-increasing number of travellers placed at his disposal. Among other French works of importance deserving notice are Le Neptune oriental of Mannevillette (1745) and more especially the Carte géometrique de la France, which is based upon surveys carried on (1744-1783) by César François Cassini de Thury and his son Dominique de Cassini. It is on a transversal cylindrical (rectangular) projection devised by Jacques Cassini (d. 1746). The hills are shown in rough hachures.
England, which had entered upon a career of naval conquest and scientific exploration, had reason to be proud of J. F. W. Desbarres, Atlantic Neptune (1774), a North-American Pilot (1779), which first made known the naval surveys of J. Cook and of others; and Tho. Jefferys’s West Indian and American Atlases (1775, 1778). James Rennell (1742-1830), who was surveyor-general of India, published the Bengal Atlas (1781), and sagaciously arranged the vast mass of information collected by British travellers and others in India and Africa, but it is chiefly with the name of Aaron Arrowsmith, who came to London in 1778, and his successors, with which the glory of the older school of cartographers is most intimately connected. His nephew John died in 1873. Among local cartographers may be mentioned H. Moll (d. 1732), J. Senex, whose atlas was published in 1725, and Dowet, whose atlas was brought out at the expense of the duke of Argyll.
In Germany J. B. Homann (d. 1724) founded a geographical establishment in 1702, which depended at first upon copies of British and French maps, but in course of time published also original maps such as J. M. Hase’s Africa (1727) and Tobias Meyer’s Mappa critica of Germany (1780), J. T. Güssfeld’s map of Brandenburg (1773), John Majer’s Württemburg (1710), and J. C. Müller’s Bavaria, both based on trigonometrical surveys. Colonel Schmettau’s excellent survey of the country to the west of the Weser (1767-1787) was never published, as Frederick the Great feared it might prove of use to his military enemies. Switzerland is represented by J. J. Scheuchzer (1712), J. Gessner (d. 1790), G. Walser (Atlas novus Helvetiae, 1769), and W. R. Meyer, Atlas der Schweiz (1786-1802). Of the Austrian Netherlands, Count Joseph de Ferrari published a chorographic map on the same scale as Cassini’s Carte de la France (1777). Of Denmark a fine map was published under the auspices of the Academy of Science of Copenhagen (1766-1825); of Spain and Portugal an atlas in 102 sheets by Thomas Lopez (1765-1802); of Russia a map by J. N. Delisle in 19 sheets (1730-1745); charts illustrating the variation of the compass and of magnetic “dip” by E. Dunn (1776), J. C. Wiffe (1768); a chart of the world by W. Dampier (1789). Map projections were dealt with by two eminent mathematicians, J. H. Lambert (1772) and Leonh. Euler (1777).
On the maps of Delisle and d’Anville the ground is still represented by “molehills.” Hachures of a rude nature first made their appearance on David Vivier’s map of the environs of Paris (1674), and on Cassini’s Carte de la France. Contour lines (isobaths) were introduced for the first time on a chart of the Merwede by M. S. Cruquius (1728), and on a chart of the English Channel by Phil. Buache (1737). Dupain-Triel, acting on a suggestion of Du Carla, compiled a contoured map of France (1791), and it only needed the introduction of graduated tints between these contours to secure a graphic picture of the features of the ground. It was J. G. Lehmann (1783) who based his method of hill-shading or hachuring upon these horizontal contours. More than 80 methods of showing the hills have found advocates since that time, but all methods must be based upon contours to be scientifically satisfactory.
Two relief maps of Central Switzerland deserve to be mentioned, the one by R. L. Pfyffer in wax, now in Lucerne, the other by J. R. Meyer of Aarau and Müller of Engelberg in papier mâché, now in Zurich. Globes of the usual commercial type were manufactured in France by Delisle (1700), Forbin (1710-1731), R. and J. de Vaugondy (1752), Lalande (1771); in England by E. and G. Adams (1710-1766); Germany by Homann and Seutter (1750). A hollow celestial globe 18 ft. in diameter was set up by Dr Roger Long at Cambridge; the terrestrial globe which Count Ch. Gravie of Vergennes presented to Louis XVI. in 1787 had a diameter of 26 metres, or 85 ft.
Modern Cartography.—The compiler of maps of the present day enjoys many advantages not enjoyed by men similarly occupied a hundred years ago. Topographical surveys are gradually extending, and explorers of recent years are better trained for their work than they were a generation ago, whilst technical processes of recent invention—such as lithography, photography and heliogravure—facilitate or expedite the completion of his task. This task, however, has grown more difficult and exacting. Mere outline maps, such as formerly satisfied the public, suffice no longer. He is called upon more especially to give a satisfactory delineation of the ground, he must meet the requirements of various classes of the public, and be prepared to record cartographically all the facts of physical or political geography which are capable of being recorded on his maps. The ingenuity of the compiler is frequently taxed when called upon to illustrate graphically the results of statistical information of every description.
Germany since the middle of the 19th century has become the headquarters of scientific cartography. This is due as much to the inspiriting teachings of Ritter and Humboldt as to the general culture and scientific training combined with technical skill commanded by the men who more especially devote themselves to this branch of geography, which elsewhere is too frequently allowed to fall into the hands of mere mechanics. Men like H. Berghaus (1797-1884), H. Kiepert (1818-1899), and A. Petermann (1822-1878) must always occupy a foremost place in the history of cartography. Among the geographical establishments of Germany, that founded by Justus Perthes (1785), at Gotha, occupies the highest rank. Among its publications are A. Stieler’s Hand-Atlas (1817-1832), K. von Spruner’s Historical Atlas (1438-1488), H. Berghaus’ Physical Atlas (1838-1842), E. von Sydow’s Wall Maps for Schools (1838-1840) and School Atlas (1847). The titles of these atlases survive, though the authors of the original editions are long dead, and the maps have been repeatedly superseded by others bringing the information up to the date of publication. To the same firm we are indebted for Petermann’s Mitteilungen, started in 1855 by A. Petermann, after whose death in 1902 they were successively edited by E. Behm, A. Supan and P. Langhans, as also the Geographisches Jahrbuch (since 1866), at first edited by E. Behm, afterwards by Professor H. Wagner. Among other geographical institutes in Germany which deserve mention are the Weimar Institut, founded in 1791 by F. J. Bertuch, and directed in 1845-1852 by H. Kiepert; Paul Fleming at Glogau (K. Sohr’s Handatlas, 1845), A. Ravenstein at Frankfort, D. Reimer at Berlin (H. Kiepert, Handatlas, 1860); R. Andree (Hand-Atlas, 1880), and E. Debes (Hand-Atlas, 1894) in Leipzig, and E. Hölzer in Vienna (Vincenz von Haardt’s maps). France is represented by the publishing firms of Ch. Delagrave (Levaseur’s maps), Hachette (Vivien de St Martin’s Atlas universel, in progress since 1875, F. Schrader’s Atlas de géographie moderne, 1880), and Armand Colin (Vidal de la Blache’s Atlas général, 1894). In Great Britain A. Arrowsmith established himself in London in 1770 (General Atlas, 1817), but the cartographical business ceased on the death of John Arrowsmith in 1873. John Walker, to whose initiative the charts published by the admiralty are indebted for the perspicuous, firm and yet artistic execution, which facilitate their use by the mariner, was also the author of the maps published by the Society for the Diffusion of Useful Knowledge (1820-1840). Among more recent firms are W. and A. K. Johnston (founded 1825; Royal Atlas, 1855); J. Bartholomew & Co., now carried on by J. G. Bartholomew (Reduced Survey maps, Atlas of the World’s Commerce, 1906); Philip & Sons (Imperial Atlas, 1890; Systematic Atlas by E. G. Ravenstein, 1894; Mercantile Marine Atlas, 1904, globes), and E. Stanford (London Atlas).
In 1890 Professor A. Penck proposed to prepare a map of the world, including the oceans, on a scale of 1 : 1,000,000, and his scheme was promised the support of a committee which met in London in 1909, and upon which were represented the leading powers of the world. Maps on that scale of a great part of Africa, Asia and America have been published by British, French, German and United States authorities. A bathymetrical chart of the oceans, by Professor J. Thoulet was published in 1904 at the expense of Prince Albert of Monaco.
Reliefs from printed maps were first produced by Bauerkeller of Darmstadt and Dondorf at Frankfort, from originals furnished by A. Ravenstein (1838-1844). The exaggeration in altitude, on these maps and on those of a later date and on a larger scale, was very considerable. No such exaggeration exists in the case of reliefs of parts of the Alps, on a large scale, by P. Keil and Pelikan (1890), X. Imfeld (1891), P. Oberlerchner (1891-1895), C. Perron (1893-1900), F. Becker (1900), A. Heim (1904) and others. A relief globe was first suggested in a letter of M. Maestlin to J. Kepler (1596). The first globe of this description for the use of the blind, was made by A. Zeune in 1810. H. Erben is the author of a rough relief on a convex surface (1842), but the finest example of this description is a relief of Italy, by César Pomba and H. Fritsche, on a scale of 1 : 1,000,000 and without exaggeration of heights (1880-1884). A map of Italy in the baptistery of St Peter at Rome has occasionally been described as a relief, though it is merely a rude outline map of Italy, by Carlo Fontana (1698), carved into a convex surface.
Several globes of unusual dimensions were produced in the course of last century. That which Colonel Langlois erected in the Champs Elysées (1824) had a diameter of 39 metres. James Wyld’s hollow globe, or “Georama,” diam. 18 metres, occupied Leicester Square until swept away as a nuisance. The giant globe proposed by Elisée Reclus in 1895 has never been erected; he has, however, produced maps on a concave surface, as suggested by J. D. Hauber in 1742.
Authorities.—The history of maps is dealt with ably in Vivien de Saint Martin’s Histoire de la géographie (Paris, 1875), and in Peschel’s Geschichte der Erdkunde (2nd ed. by Sophus Ruge, Berlin, 1877), as also by W. Wollkenhauer (Leitfaden zur Geschichte der Kartographie, Breslau, 1895), and H. Zondervan (Allgemeine Kartenkunde, Leipzig, 1901). J. Lelewel’s Geographie du moyen âge, with an atlas (Brussels, 1850-1857), has in part been superseded by more recent researches. There are, however, a number of works, beautifully illustrated, which deal fully with particular periods of the subject. Among these may be mentioned Konrad Miller’s Die ältesten Weltkarten (Stuttgart, 1895-1897), which only deals with maps not influenced by the ideas of Ptolemy. The contents of the following collections are more varied in their nature, viz. E. F. Jomard’s Monuments de la géographie (Paris, 1862), Santarem’s Atlas composé de mappemondes et de portulans, &c. (Paris, 1842-1853, 78 plates). A. E. Nordenskiöld’s Facsimile Atlas (Stockholm, 1889), Gabriel Marcell, Choix de cartes et de mappemondes XIVe et XVe siècles (Paris, 1896). C. H. Coote’s Remarkable Maps of the XVth, XVIth and XVIIth Centuries reproduced in their Original Size (Amsterdam, 1894-1897), and Bibliotheca lindesiana (London, 1898) with facsimiles of the Harleian and other Dieppese maps of the 16th century. Nautical charts are dealt with in A. E. Nordenskiöld’s Periplus (Stockholm, 1869), and Th. Fischer’s Sammlung mittelälterlicher Welt- und Seekarten (Vienna, 1886). The discovery and mapping of America are illustrated by F. Kunstmann’s Entdeckung Amerikas (Munich, 1859), K. Kretschmer’s Atlas zur Entdeckung Amerikas (Berlin, 1892), G. Marcel’s Reproductions de cartes et de globes relatives à la découverte de l’Amérique du XVIe au XVIIIe siècle (Paris, 1893) and E. L. Stevenson’s Maps Illustrating the early Discovery and Exploration of America, 1502-1530 (New Brunswick, N.J., 1906). In addition to these collections, numerous single maps have been published in geographical periodicals or separately. See also V. Hantzsch and L. Schmidt, Kartog. Denkmäler zur Entdeckungsgeschichte von Amerika, Asien, Australien und Afrika aus der k. Bibliothek zu Dresden (Leipzig, 1903), and the Crown Collection of photographs of American maps (1600-1800), selected and edited by A. B. Hulbert (Cleveland, 1904-1909).
For reports on the progress of cartography, see Geographisches Jahrbuch (Gotha, since 1866); for announcements of new publications, Bibliotheca geographica, published annually by the Berlin Geographical Society, and to the geographical Journal (London).
Topographical Surveys.
The year 1784 marks the beginning of the ordnance survey, for in that year Major-General Roy measured a base line of 27,404 ft. on Hounslow Heath. Six additional base lines were measured up to 1849, including the Lough United Kingdom. Foyle, in 1827-1828, and that on Salisbury Plain, in 1849. The primary triangulation was only completed in 1858, but in the meantime, in 1791, the detail survey had begun. At first it was merely intended to produce a map sufficiently accurate on a scale of 1 in. to a mile (1 : 63,360). Ireland having been surveyed (1824-1842) on a scale of 6 in. to a mile (1 : 10,560), it was determined in 1840, after the whole of England and Wales, with the exception of Lancashire and Yorkshire, had been completed on one-inch scales, to adopt that scale for the whole of the United Kingdom. Finally, in 1854, a cadastral survey of the whole of the United Kingdom, only excepting uncultivated districts, was resolved upon, on a scale of 1 : 2500, still larger scales (1 : 500 or 1 : 1000) being adopted for town plans. Parish boundaries are laid down with the help of local meresmen appointed by justices at quarter sessions. The horizontal contours are based upon instrumental measurement, and as a whole these ordnance maps were undoubtedly superior in accuracy, with rare exceptions, to similar maps published by foreign governments. Even though the hill hachures on the older one-inch maps are not quite satisfactory, this deficiency is in a large measure compensated for by the presence of absolutely trustworthy contours. Originally the maps were engraved on copper, and the progress of publication was slow; but since the introduction of modern processes, such as electrotyping (in 1840), photography (in 1855) and zincography (in 1859), it has been rapid. A plan, the engraving of which formerly took two years, can now be produced in two days.
The one-inch map for the whole of the United Kingdom was completed in 1890. It covers 697 sheets (or 488 of a “new series” in large sheets), and is published in three editions, viz. (a) in outline, with contours in black, (b) with hills hachured in brown or black, and (c) printed in five colours. Carefully revised editions of these and of the other maps are brought out at intervals of 15 years at most. Since 1898 the department has also published maps on a smaller scale, viz. a map of England and Wales, on a scale of 2 m. to 1 in., in two editions, both printed in colour, the one with hills stippled in brown, the other coloured on the “layer system” as a strata-relief map; a map of the United Kingdom on a scale of 4 m. to 1 in., also in two editions, the one in outline, showing five classes of roads and parish boundaries, the other in colours, with stippled hills; a map on a scale of 10 m. to 1 in., also in two editions, and finally a map of the United Kingdom on a scale of 1 : 1,000,000.
The geological surveys of Great Britain and Ireland were connected from 1832 to 1853 with the ordnance survey, but are now carried on independently. The ordnance survey, too, no longer depends on the war office but upon the board of agriculture and fisheries. A Bathymetrical Survey of the Freshwater Lochs of Scotland, under the direction of Sir John Murray and L. Pullar, was completed in 1908, and the results published by the Royal Geographical Society.
Proposals for a new map of France, to replace the famous Cassini map of 1744-1793 were made in 1802 and again by R. Bonne in 1808, but owing to the wars then devastating Europe no steps were taken until 1817, and France. the Carte de France de l’état major on a scale of 1 : 80,000 was only completed in 1880. It is engraved on copper. The hachured hills are based upon contours, and are of admirable commensurability. It has served as a basis for a Carte de la France, published by the Service Vicinal on a scale of 1 : 100,000, in 596 sheets, and of a general map prepared by the ministère des travaux publics on a scale of 1 : 200,000 in 80 sheets. On both these maps the hills are printed in grey chalk. A third topographical map of France is being published in accordance with the recommendation of a committee presided over by General de la Noix in 1897. The surveys for this map were begun in 1905. The maps are based upon the cadastral plans (1 : 1000), thoroughly revised and connected with the triangulation of France and furnished with contours at intervals of 5 m. by precise measurement. These minutes are published on a scale of 1 : 10,000 or 1 : 20,000 for mountain districts, while the scale of the general map is 1 : 50,000. Each sheet is bounded by parallels and meridians. The hills are shown in brown contours at intervals of 10 m. and grey shading in chalk (Berthaut, La Carte de France, 1750-1898; Paris, 1899). A geological map of France on a scale of 1 : 80,000 is nearly completed, there are also a map (1 : 500,000) by Carez and Vasseur, and an official Carte géologique (1 : 1,000,000; 1906).
By the middle of the 19th century topographical maps of the various German states had been completed, and in several instances surveys of a more exact nature had been completed or begun, when in 1878 the governments of Germany. Prussia, Saxony, Bavaria and Württemberg agreed to supersede local maps by publishing a map of the empire (Reichskarte) in 674 sheets on a scale of 1 : 100,000. The earlier sheets of this excellent map were lithographed, but these are gradually being superseded by maps engraved on copper. Colour-printing is employed since 1901. The hills are hachured and in some instances contours at intervals of 50 metres are introduced. The map was completed in 1909, but is continually undergoing renewal. The Messtischblätter, called Positionsblätter in Bavaria, are on a scale of 1 : 25,000. The older among them leave much to be desired, but those of a later date are satisfactory. This applies more especially to the maps of Saxony (since 1879) and Württemberg (since 1893). The features of the ground on most of these maps are shown by contours at intervals of 10 metres. The map produced on this large scale numbers over 5000 sheets, and is used as a basis for the geological surveys carried on in several of the states of Germany. A general map of the German Empire (Uebersichtskarte) on a scale of 1 : 200,000, in 196 sheets, is in progress since 1893. It is printed in three colours, and gives contours at intervals of 10 metres. In addition to these maps there are D. G. Reymann’s well-known Specialkarte von Mittel Europa (1 : 200,000), acquired by the Prussian government in 1874 (it will ultimately consist of 796 sheets), a government and Liebenow’s map of central Europe (1 : 300,000) and C. Vogel’s beautiful map of Germany (1 : 500,000).
The Specialkarte of Austria-Hungary on a scale of 1 : 75,000 (765 sheets), based upon a triangulation and cadastral surveys (1816-1867), was completed in 1889, and published in heliogravure. This map was repeatedly revised, Austria-Hungary. but as it no longer met modern requirements as to accuracy the director of the military geographical establishment at Vienna, Field Marshal Chr. von Steeb, in 1896, organized what practically amounts to a re-survey of the entire monarchy, to be completed in 75 years. At the same time the cadastral plans, reduced to a scale of 1 : 25,000, are being published in photo-lithography. A general map of central Europe in 283 sheets published by the Austrian government (1 : 200,000) includes nearly the whole of the Balkan Peninsula.
The famous map of Switzerland, with which is associated the name of General H. Dufour (d. 1875), is based upon a triangulation (1809-1833) and surveys on a scale of 1 : 25,000 for the lowlands, 1 : 50,000 for the alpine districts, and Switzerland. was published (1842-1865) on a scale of 1 : 100,000. The hills are hachured, the light, in the case of the loftier regions, being supposed to fall obliquely. The original surveys, carefully revised, have been published since 1870 as a Topographical Atlas of Switzerland—the so-called Siegfried Atlas, in 552 sheets. They are printed in three colours, contours at intervals of 10 and 20 metres being in brown, incidental features (ravines, cliffs, glaciers) in black or blue. To mountain-climbers these contour maps are invaluable, but for ordinary purposes “strata maps,” such as J. M. Ziegler’s hypsometric maps (1856) or so-called “relief maps,” which attempt to delineate the ground so as to give the impression of a relief, are generally preferred.
The new survey of Belgium was completed in 1872 and there have been published 527 plane-table sections or planchettes on Belgium. a scale of 1 : 20,000 (1866-1880), a “Carte topographique de la Belgique,” in 72 sheets, on a scale of 1 : 40,000 (1861-1883), and a more recent map in 26 sheets on a scale of 1 : 100,000 (1903-1912). The last is printed in five colours, the ground is shown in contours of 10 metres interval and grey stippling.
The new survey of the Netherlands, based upon General Krayenhoff’s primary triangulation (1802-1811) was completed Holland. in 1855. The results have been published on a scale of 1 : 25,000 (776 sheets, since 1866), 1 : 50,000 (Topographic and Military Map, 62 sheets, 1850-1864, and a Waterstaatskaart, 1864-1892), and 1 : 200,000 (Topographical Atlas, 21 sheets, 1868-1871).
In Denmark, on the proposal of the Academy of Science, a survey was carried out in 1766-1825, but the maps issued by the Danish general staff depend upon more Denmark. recent surveys. These include plane-table sections (Maalebordsblade), 1209 sheets on a scale of 1 : 20,000, with contours at intervals of 5 to 10 ft., published since 1830; Atlasblade of Jutland and of De Danske Öer, on a scale of 1 : 40,000, the former in 131 sheets, since 1870, the latter, on the same scale, in 94 sheets, since 1890, and still in progress, and a general staff map on a scale of 1 : 100,000, in 68 sheets, since 1890. Maps of the Faroer and of Iceland have likewise been issued.
Modern surveys in Sweden date from the organization of a corps of “Landemätare,” known since 1874 as a topographical department of the general staff. The maps issued Scandinavia. by this authority include one of southern Sweden, 1 : 100,000, another of northern Sweden, 1 : 200,000, and a general map on a scale of 1 : 1,000,000. In Norway a geographical survey (Opmaaling) has been in progress since 1783, but the topographical map of the kingdom on a scale of 1 : 100,000 in 340 sheets, has not yet been completed.
Of Russia in Europe only the more densely peopled governments have been surveyed, since 1816, in the manner of other European countries, while for most regions there are only so-called “military surveys.” The most Russia. readily available map of the whole country is the 10-verst map (1 : 420,000), known as General J. A. Strelbitzki’s, and published 1865-1880. A topographic map (1 : 126,000) embracing the whole of western Russia, with Poland and the country of the Don Cossacks, is designed to be extended over the whole empire. Certain governments—Moscow, Kief, Volhynia, Bessarabia, the Crimea, &c.—have been published on a scale of 1 : 24,000, while Finland, as far as 61° N., was re-surveyed in 1870-1895, and a map on a scale of 1 : 42,000 is approaching completion.
Surveys in Asiatic Russia are conducted by the topographical departments organized at Orenburg, Tashkent, Omsk, Irkutsk and Tiflis. To the latter we are indebted for a valuable map of Caucasia, 1 : 210,000, which since the first publication (1863-1885) has undergone careful revision. The Siberian departments have published a number of maps on a scale of 1 : 420,000. In addition to these the survey for the Trans-Siberian railway has been published on a scale of 1 : 630,000, as also maps of the Russo-Chinese frontier districts, 1 : 210,000 and 1 : 1,168,000. A map of Asiatic Russia, 1 : 420,000, by Bolshef, in 192 sheets, is in course of publication.
Passing to southern Europe we find that Portugal has completed a Charta chorographica (1 : 100,000) since 1856. In Portugal and Spain. Spain a plane-table survey on a scale of 1 : 20,000 has been in progress since 1870, but of the map of Spain in 1078 sheets on a scale of 1 : 50,000 only 150 had been issued by the depósito de la guerra up to 1910. Meanwhile reference may be made to B. F. Coello’s Atlas de la España (1848-1890), the maps of which are on a scale of 1 : 200,000.
In Italy Tavulette rilevata on a scale of 1 : 25,000 or 1 : 50,000, Italy. with contours, based on surveys made 1862-1890, are being published, and a Carta del regno d’Italia, 1 : 100,000, is practically complete. There are a Carta idrologica and a Carta geologica on the same scale, and a Carta orografica on a scale of 1 : 500,000.
Greece is still dependent upon foreigners for its maps, among which the Carte de Grèce (1 : 200,000) from rapid surveys made by General Palet in 1828, was published in a new edition in 1880. A similar map, mainly based upon Greece. surveys made by Austrian officers and revised by H. Kiepert (1 : 300,000), was published by the Military Geographical Institute of Vienna in 1885. Far superior to these maps is the Karte von Attika (1 : 100,000 and 1 : 25,000) based upon careful surveys made by Prussian officers and published by E. Curtius and J. H. Kaupert on behalf of the German Archaeological Institute in Athens (1878), or A. Philippson’s map of the Peloponnese (1 : 300,000; 1901).
For maps of the Balkan Peninsula we are still largely indebted to the rapid surveys carried on by Austrian and Russian officers. The Austrian map of central Europe embraces the whole of the Balkan Peninsula on a scale Balkan States. of 1 : 200,000; the Russian surveys (1877-1879) are embodied in a map of the eastern part of the Balkan on a scale 1 : 126,000, and a map of Bulgaria and southern Rumelia, on a scale 1 : 200,000, both published in 1883. A map of Turkey in Europe, scale 1 : 210,000, was published by the Turkish general staff (1899), and another map, scale 1 : 250,000, by the intelligence division of the British war office is in progress since 1906. Bosnia and Herzegovina are now included with the surveys of the Austrian Empire, the kingdom of Servia has been surveyed (1880-1891) and the results published on a scale of 1 : 75,000; in eastern Rumania surveys have been in progress since 1874 and the results have been published on a scale of 1 : 50,000; a general map of the entire kingdom, scale 1 : 200,000, was published in 1906-1907; a map of Montenegro (1 : 75,000), based on surveys by Austrian and Russian officers, was published at Vienna in 1894.
In Asiatic Turkey several districts of historical interest have been surveyed, and surveys have likewise been made in the interest of railways, or by boundary commissions, but there is no such thing as a general survey Asia. carried on under the direction of government. We are thus, to a large extent, still dependent upon compilations, such as R. Kiepert’s Asia Minor (1 : 400,000; 1904-1908), a map of eastern Turkey in Asia, Syria and western Persia (1 : 2,000,000; 1910), published by the Royal Geographical Society, or a Russian general map (1 : 630,000, published 1880-1885). Among maps based upon actual surveys those of Palestine, by Lieutenant G. R. Conder and H. H. (afterwards Lord) Kitchener (1 : 63,360, 1880), of the Sinai Peninsula by Sir C. W. Wilson and H. S. Palmer (1 : 126,730, 1870), of Arabia Petraea by Dr A. Musil (1 : 300,000, 1907) or of the Aden territory (1905) are among the more interesting. Of Cyprus an excellent map from surveys by Major (Lord) H. H. Kitchener was published in 1884 (1 : 63,360).
In the case of Persia and Afghanistan we are still dependent upon compilations such as a Russian staff map (1 : 840,000, published in 1886), Colonel Sir T. H. Holdich’s map of Persia (1 : 1,014,000, Simla, 1897-1899), or a smaller map (1 : 2,028,000 and 1 : 4,056,000), published by the geographical division of the general staff. The settlement of boundaries in northern Afghanistan (1883) and in Seistan (1870) has necessitated surveys of some interest.
A trigonometrical survey of British India was begun in 1800 and the country can now boast of a survey which in most respects is equal to those of most European states. The surveys are made on scales varying according to the necessities of the case or the nature of the country, and they have been extended since 1862 beyond the boundaries of India proper. Revenue surveys for land settlement are published on a scale of 1 : 4000, but the usual scale for topographical maps is 1 : 63,360. An Indian Atlas, on a scale of 1 : 255,660, includes also Ceylon and the Malay Peninsula, but although begun so long ago as 1827 many of its sheets are unpublished. There are in addition an official map of India (1 : 1,000,000), the first edition of which was published in 1903, as also maps of the great provinces of India, including Burma, all on a scale of 1 : 2,827,520, and a variety of physical and statistical maps. Ceylon and the Straits Settlements, with the Federal Malay States, have their own surveyors-general. The British North Borneo Company published a Map of British North Borneo, on a scale of 1 : 633,600 (1905).
In Siam a regular survey was organized by Mr J. McCarthy (1881-1883), a former official of the Indian survey, which did good work in connexion with the determination of the Franco-Siamese frontier (1906). The surveys are made on the scales of 1 : 4000, 1 : 31,680 and 1 : 63,360.
In French Indo-China surveys have been in progress since 1881. The Bureau of the Indo-Chinese general staff, has published a map of Indo-China, including Cambodia, in 45 sheets (1 : 200,000, 1895), while to the service géographique de l’Indo-Chine, organized in 1899, we owe a Carte de l’Indo-Chine (1 : 500,000).
For China we are still largely dependent upon careful compilations like Baron F. von Richthofen’s Atlas von China (1 : 750,000, Berlin, 1885-1890) or Bretschneider’s Map of China (1 : 4,600,000) a new edition of which appeared at St Petersburg in 1900. There are good survey maps of the British colony of Hong-Kong, of Wei-hai-Wei and of the country around Kiao-chou, and the establishment of topographical offices at Peking and Ngan-king holds out some promise of native surveys. In the meantime large scale maps prepared by European authorities are to be welcomed, such as maps of Chih-li and Shan-tung (1 : 200,000), from surveys by Prussian officers, 1901-1905, maps on East China (1 : 1,000,000) and of Yun-nan by British, German and Indian officers, of the Indo-Chinese frontier (1 : 200,000, Paris 1908), and of the upper Yangtsze-kiang by S. Chevalier (Shanghai, 1900).
Japan has a regular survey department originated by Europeans and successfully carried on by natives. The primary triangulation was completed in 1880, a topographical map coloured geologically (1 : 200,000) was published 1889-1897, and in addition to this there are being published an agronomical map on a scale of 1 : 100,000 (since 1887) and others. The Japanese government has likewise published a map of Korea (1 : 1,000,000; 1898).
The Philippine Islands are represented in a carefully compiled map by C. W. Hodgson (1 : 1,115,000, New York, 1908). Of Java we possess an excellent topographical map based upon surveys made 1850-1887 (1 : 100,000). A similar map has been in progress for Sumatra since 1883, while the maps for the remaining Dutch Indies are still based, almost exclusively, upon flying surveys. For general purposes the Atlas der Nederlandsche Bezittingen in Oost-Indie by J. N. Stemfoort and J. J. Ten Siethoff, of which a new edition has been published since 1900, may be consulted with confidence.
In Africa nearly all the international boundaries have been carefully surveyed and marked on the ground, since 1880, and yield a good basis as a guide for the map compiler. A general map of Africa, by Colonel Lannoy de Africa. Bissy, on a scale of 1 : 2,000,000 was first published in 1882-1888, but is carefully revised from time to time. The geographical section of the British general staff is publishing maps of all Africa on scales of 1 : 250,000 and 1 : 1,000,000. In Egypt excellent work has been done by a survey department organized and directed by Captain H. G. Lyons up to 1909. It has published a topographical map of the Nile valley (1 : 50,000), an irrigation map (1 : 100,000), a general map (1 : 250,000), numerous cadastral plans, &c. Work on similar lines is carried on in the Anglo-Egyptian Sudan. Algeria has been in course of survey since 1868, Tunis since 1878, and the results have been published on scales of 1 : 50,000 and 1 : 250,000. Of Morocco there are many maps, among which several compiled by the French service géographique de l’armée, including a Carte du Maroc (1 : 200,000), in progress since 1909. In the British colonies of tropical and of South Africa26 surveys for the most part are carried on actively. Of the Gambia Colony there is a map by Major E. L. Cowie (1 : 250,000, 1904-1905); the survey of the Gold Coast Colony is being published by Major F. G. Guggisberg since 1907 (1 : 125,000 and 1 : 200,000); southern and northern Nigeria are adequately represented on the maps of the general staff (1 : 250,000). The states of British South Africa have each their surveyor-general, and a reconnaissance survey has been in progress since 1903. It is based upon a careful triangulation, superintended by Sir D. Gill, and carried in 1907 within 70 m. of Lake Tanganyika. This survey is rapidly superseding other maps, such as the surveyor-general’s map of Cape Colony (1 : 127,000); A. Duncan’s map of the Orange River State (1 : 148,705; 1902-1904) and Jeppe’s map of the Transvaal (1 : 476,000; 1899). The results of a survey of southern Rhodesia are given on the map of the British general staff (1 : 500,000; 1909), while of north-eastern Rhodesia we have an excellent map compiled by C. L. Beringer in 1907 (1 : 1,000,000). Surveys in British Central Africa were taken up in 1894; a survey of Lake Nyasa, by Lieut. E. L. Rhoades and W. B. Phillips, was published in 1902. As regards British East Africa and Uganda, the surveys in the latter (on scales of 1 : 10,000 and 1 : 125,000) have made considerable progress. The Victoria Nyanza was surveyed by Captain B. Whitehouse (1898-1900), and the results have been published on a scale of 1 : 292,000. These British possessions, together with the whole of Somaliland and southern Abyssinia, are satisfactorily represented on the maps of the British general staff.
Maps of the French Africa Colonies have been published by the service géographique de l’Afrique occidental and the service géographique des colonies. A map of Senegal (1 : 100,000) is in progress since 1905. The official maps of the other colonies have been compiled by A. Meunier between 1902 and 1909. They include French West Africa, (1 : 2,000,000; 2nd ed., 1908), French Guinea (1 : 500,000; 1902) and the Ivory Coast and Dahomey (1 : 1,500,000; 1907-1908). A map of the French Congo by J. Hansen (1 : 1,500,000), was published in 1907. In Madagascar a topographical bureau was established by General J. S. Gallieni in 1896, and the surveys are being published since 1900 on a scale of 1 : 100,000.
As regards the German colonies we are dependent upon compilations by R. Kiepert, P. Sprigade and M. Moisel. Good maps of the Portuguese colonies are to be found in an Atlas colonial Portugues, a second edition of which was published by the Commissão de Cartographia in 1909. Of the Congo State we have an official map on a scale of 1 : 1,000,000, published in 1907. Of Italian Eritrea we have excellent maps on various scales of 1 : 100,000, 1 : 200,000 and 1 : 500,000, based upon surveys made between 1888 and 1900.
In the states of Australia cadastral surveys conducted by surveyors-general have been in progress for many years, as also trigonometrical surveys (Western Australia excepted), and the publication of parish and township or county Australia. maps keeps pace with the settlement of the country; but with the exception of Victoria none of these states is in possession of a topographical map equal in accuracy to similar maps published in Europe. In Victoria the so-called geodetic survey was begun in 1858; the maps are published on a scale of 1 : 126,730. There exists also a general map, on a scale of 1 : 506,930. Maps on the same scale are available of New South Wales, South Australia and Tasmania, on a scale of 1 : 560,000 for Western Australia, on a scale of 1 : 253,460 for Queensland. There are likewise maps on smaller scales, which undergo frequent revision. The map of British New Guinea is on a scale of 1 : 330,200 (1898). New Zealand has a good general map on a scale of 1 : 633,700. A trigonometrical survey was given up and only details of immediate practical use are required. The “Lands Department” of the Fiji Islands has published a map on a scale of 1 : 380,000 (1908).
The cadastral surveys in Canada are carried on by a commission of Crown-lands in the old provinces and by a Dominion land office, which lays out townships as in the United States, but with greater accuracy. A surveyor-general North America. is attached to the department of the interior, at Ottawa. He publishes the topographical maps (1 : 63,366) since 1906. They are based upon theodolite traverses 15 m. apart, and connected with the United States lake and coast surveys, the details being filled in by plane-table surveys on a scale of 1 : 31,680. The contours, 25 ft. apart, depend upon spirit-levelling. In the Rocky Mountains surveys photographic apparatus is successfully employed. The surveyor-general issues also “sectional maps” (1 : 190,000 and 1 : 40,000) and so-called “Standard” topographical maps for the thinly peopled west, on scales of 1 : 250,000 and 1 : 500,000. He is responsible likewise for maps of Yukon and of Labrador, supplied by the geological survey, the former on a scale of 1 : 380,200, the latter of 1 : 1,584,000. The intelligence branch of the Canadian department of military defence is publishing since 1904 topographical maps on scales of 1 : 63,366 and 1 : 126,730, with contours. A geodetic survey department, under Dr. W. F. King, chief astronomer of the Dominion, was established in 1909.
Maps of Newfoundland, orographical as well as geological, scale 1 : 1,584,200, have been published.
In the United States a “geological survey” was organized in 1879, under Clarence King as director, whose successor, Major J. W. Powell, rightly conceived that it was necessary to produce good topographical maps before a geological survey could be pursued with advantage. It is under his wise guidance that the survey has attained its present efficiency. It is based upon a triangulation by the U.S. Coast and Geodetic Survey. The maps of the more densely peopled parts of the Union are published on a scale of 1 : 62,500, and those of the remainder of the country on half or a quarter of that scale. The hills are shown by contours at intervals of 10 or 100 ft. The details given are considered sufficient to admit of the selection of general routes for railways or other public works. The survey progresses at the rate of about 40,000 sq. m. annually, and in course of time it will supersede the map of the separate states, based on older surveys. A “reconnaissance” map of Alaska (on a scale of 1 : 250,000) was published in 1908.
In Mexico the surveys are in charge of a comision geografica-exploradora attached to the secretaria de Fomento, but only about 140 sheets of a Carta general on a scale of Central America. 1 : 100,000 have been published. There are also a map of the state of S. Luis Potosi (1 : 250,000), of the environs of Puebla (1 : 50,000) and a Carta general de la republica mexicana (1 : 250,000).
A useful map of Central America has been published by the topographical section of the British general staff on a scale of 1 : 170,300. Of great value for cartographical work is a careful survey, carried out by American engineers (1897-1898), for a continental railway running along the west coast from Mexico to Chile. In South America, in proportion to the area of the country, only few surveys of a thoroughly scientific nature have been made, and it is therefore satisfactory that the service géographique of the French army should be publishing, since 1900, a map of the entire continent on a scale of 1 : 1,000,000.
Colombia is but inadequately represented by rough maps. For Colombia we have F. L. Vergara y Velasco’s Atlas de geografia colombiana (1906-1908); Ecuador is fairly well represented by Th. Wolf (1892) and Hans Meier (1907); in the case of Peru we still largely depend upon Paz Soldan’s Atlas geografica (1865-1867) and A. Raimondi’s Mapa del Peru (1 : 500,000) based upon surveys made before 1869. Sir Martin Conway’s “Map of the Andes of La Paz” (1 : 600,000; 1900) as well as Major P. H. Fawcett’s survey of the Brazilian boundary (1906-1907) are welcome additions to our knowledge of Bolivia. In Chile a comision topografica was appointed as long ago as 1848, but the map produced under its auspices by Professor F. Pissis (1 : 250,000, 1870-1877), leaves much to be desired. Since that time, however, valuable maps have been published by an Oficina de mensura de tierras, by a seccion de geografia y minas connected with the department of public works, by the Oficina hidrografica, and more especially in connexion with surveys necessitated by the boundary disputes with Argentina, which were settled by arbitration in 1899 and 1902. The surveys which led to the latter were conducted by Sir Thomas Holdich.
In Venezuela a commission for producing a plano militar or military map of the country was appointed by General Castro in 1904, but little progress seems to have been made, and meantime we are dependent upon a revised edition of A. Codazzi’s map of 1840 which was published in 1884. In Brazil little or nothing is done by the central government, but the progressive states of São Paulo and Mines Gerães have commissãos geographicos e geologicos engaged in the production of topographical maps. Valuable materials have likewise been acquired by several river surveys including those of the Amazonas by Azevedo and Pinto (1862-1864) and W. Chandless (1862-1869) and of the Rio Madeira by Colonel G. Earl Church and Keller-Leuzinger (1860-1875). The proposal of a committee presided over by the Marshal H. de Beaurepaire-Rohan (1876) to prepare a map of Brazil on a scale of 1 : 200,000 has never been acted upon, and in the meantime we are dependent upon works like the Atlas do imperio do Brazil by Mendes de Almeida (1868) or the maps in our general atlases.
In Argentina an official geographical institute was established in 1879, but neither A. Seelstrang’s Atlas (1886-1892) nor H. Hoskold’s Mapa topografica (1 : 2,000,000; London, 1895), which were published by it, nor any of the numerous provincial maps are based upon scientific surveys.
It need hardly be said that hydrographic surveys have been of great service to compilers of maps. There are few coast-lines, frequented by shipping, which have not yet been surveyed in a definite manner. In this work the British hydrographic office may justly claim the credit of having contributed the chief share. Great Britain has likewise taken the lead in those deep-sea explorations which reveal to us the configuration of the sea-bottom, and enable us to construct charts of the ocean bed corresponding to the contoured maps of dry land yielded by topographical surveys.
(E. G. R.)
Map Projections
In the construction of maps, one has to consider how a portion of spherical surface, or a configuration traced on a sphere, can be represented on a plane. If the area to be represented bear a very small ratio to the whole surface of the sphere, the matter is easy: thus, for instance, there is no difficulty in making a map of a parish, for in such cases the curvature of the surface does not make itself evident. If the district is larger and reaches the size of a county, as Yorkshire for instance, then the curvature begins to be sensible, and one requires to consider how it is to be dealt with. The sphere cannot be opened out into a plane like the cone or cylinder; consequently in a plane representation of configurations on a sphere it is impossible to retain the desired proportions of lines or areas or equality of angles. But though one cannot fulfil all the requirements of the case, we may fulfil some by sacrificing others; we may, for instance, have in the representation exact similarity to all very small portions of the original, but at the expense of the areas, which will be quite misrepresented. Or we may retain equality of areas if we give up the idea of similarity. It is therefore usual, excepting in special cases, to steer a middle course, and, by making compromises, endeavour to obtain a representation which shall not involve large errors of scale.
A globe gives a perfect representation of the surface of the earth; but, practically, the necessary limits to its size make it impossible to represent in this manner the details of countries. A globe of the ordinary dimensions serves scarcely any other purpose than to convey a clear conception of the earth’s surface as a whole, exhibiting the figure, extent, position and general features of the continents and islands, with the intervening oceans and seas; and for this purpose it is indeed absolutely essential and cannot be replaced by any kind of map.
The construction of a map virtually resolves itself into the drawing of two sets of lines, one set to represent meridians, the other to represent parallels. These being drawn, the filling in of the outlines of countries presents no difficulty. The first and most natural idea that occurs to one as to the manner of drawing the circles of latitude and longitude is to draw them according to the laws of perspective. Perhaps the next idea which would occur would be to derive the meridians and parallels in some other simple geometrical way.
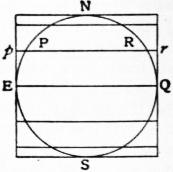
Fig. 1.
Cylindrical Equal Area Projection.—Let us suppose a model of the earth to be enveloped by a cylinder in such a way that the cylinder touches the equator, and let the plane of each parallel such as PR be prolonged to intersect the cylinder in the circle pr. Now unroll the cylinder and the projection will appear as in fig. 2. The whole world is now represented as a rectangle, each parallel is a straight line, and its total length is the same as that of the equator, the distance of each parallel from the equator is sin l (where l is the latitude and the radius of the model earth is taken as unity). The meridians are parallel straight lines spaced at equal distances.
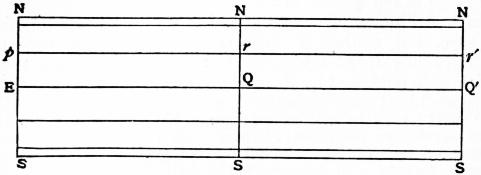
Fig. 2.
This projection possesses an important property. From the elementary geometry of sphere and cylinder it is clear that each strip of the projection is equal in area to the zone on the model which it represents, and that each portion of a strip is equal in area to the corresponding portion of a zone. Thus, each small four-sided figure (on the model) bounded by meridians and parallels is represented on the projection by a rectangle which is of exactly the same area, and this applies to any such figure however small. It therefore follows that any figure, of any shape on the model, is correctly represented as regards area by its corresponding figure on the projection. Projections having this property are said to be equal-area projections or equivalent projections; the name of the projection just described is “the cylindrical equal-area projection.” This projection will serve to exemplify the remark made in the first paragraph that it is possible to select certain qualities of the model which shall be represented truthfully, but only at the expense of other qualities. For instance, it is clear that in this case all meridian lengths are too small and all lengths along the parallels, except the equator, are too large. Thus although the areas are preserved the shapes are, especially away from the equator, much distorted.


The property of preserving areas is, however, a valuable one when the purpose of the map is to exhibit areas. If, for example, it is desired to give an idea of the area and distribution of the various states comprising the British Empire, this is a fairly good projection. Mercator’s, which is commonly used in atlases, preserves local shape at the expense of area, and is valueless for the purpose of showing areas.
Many other projections can be and have been devised, which depend for their construction on a purely geometrical relationship between the imaginary model and the plane. Thus projections may be drawn which are derived from cones which touch or cut the sphere, the parallels being formed by the intersection with the cones of planes parallel to the equator, or by lines drawn radially from the centre. It is convenient to describe all projections which are derived from the model by a simple and direct geometrical construction as “geometrical projections.” All other projections may be known as “non-geometrical projections.” Geometrical projections, which include perspective projections, are generally speaking of small practical value. They have loomed much more largely on the map-maker’s horizon than their importance warrants. It is not going too far to say that the expression “map projection” conveys to most well-informed persons the notion of a geometrical projection; and yet by far the greater number of useful projections are non-geometrical. The notion referred to is no doubt due to the very term “projection,” which unfortunately appears to indicate an arrangement of the terrestrial parallels and meridians which can be arrived at by direct geometrical construction. Especially has harm been caused by this idea when dealing with the group of conical projections. The most useful conical projections have nothing to do with the secant cones, but are simply projections in which the meridians are straight lines which converge to a point which is the centre of the circular parallels. The number of really useful geometrical projections may be said to be four: the equal-area cylindrical just described, and the following perspective projections—the central, the stereographic and Clarke’s external.
Perspective Projections.
In perspective drawings of the sphere, the plane on which the representation is actually made may generally be any plane perpendicular to the line joining the centre of the sphere and the point of vision. If V be the point of vision, P any point on the spherical surface, then p, the point in which the straight line VP intersects the plane of the representation, is the projection of P.
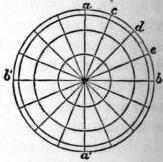
Fig. 3.
Orthographic Projection.—In this projection the point of vision is at an infinite distance and the rays consequently parallel; in this case the plane of the drawing may be supposed to pass through the centre of the sphere. Let the circle (fig. 3) represent the plane of the equator on which we propose to make an orthographic representation of meridians and parallels. The centre of this circle is clearly the projection of the pole, and the parallels are projected into circles having the pole for a common centre. The diameters aa′, bb′ being at right angles, let the semicircle bab′ be divided into the required number of equal parts; the diameters drawn through these points are the projections of meridians. The distances of c, of d and of e from the diameter aa′ are the radii of the successive circles representing the parallels. It is clear that, when the points of division are very close, the parallels will be very much crowded towards the outside of the map; so much so, that this projection is not much used.
For an orthographic projection of the globe on a meridian plane let qnrs (fig. 4) be the meridian, ns the axis of rotation, then qr is the projection of the equator. The parallels will be represented by straight lines passing through the points of equal division; these lines are, like the equator, perpendicular to ns. The meridians will in this case be ellipses described on ns as a common major axis, the distances of c, of d and of e from ns being the minor semiaxes.
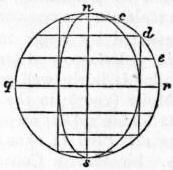
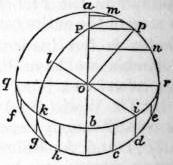
Fig. 4. Fig. 5.
Let us next construct an orthographic projection of the sphere on the horizon of any place.
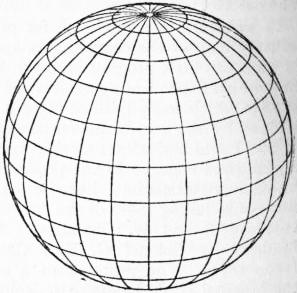
Fig. 6.—Orthographic Projection.
Set off the angle aop (fig. 5) from the radius oa, equal to the latitude. Drop the perpendicular pP on oa, then P is the projection of the pole. On ao produced take ob = pP, then ob is the minor semiaxis of the ellipse representing the equator, its major axis being qr at right angles to ao. The points in which the meridians meet this elliptic equator are determined by lines drawn parallel to aob through the points of equal subdivision cdefgh. Take two points, as d and g, which are 90° apart, and let ik be their projections on the equator; then i is the pole of the meridian which passes through k. This meridian is of course an ellipse, and is described with reference to i exactly as the equator was described with reference to P. Produce io to l, and make lo equal to half the shortest chord that can be drawn through i; then lo is the semiaxis of the elliptic meridian, and the major axis is the diameter perpendicular to iol.
For the parallels: let it be required to describe the parallel whose co-latitude is u; take pm = pn = u, and let m′n′ be the projections of m and n on oPa; then m′n′ is the minor axis of the ellipse representing the parallel. Its centre is of course midway between m′ and n′, and the greater axis is equal to mn. Thus the construction is obvious. When pm is less than pa the whole of the ellipse is to be drawn. When pm is greater than pa the ellipse touches the circle in two points; these points divide the ellipse into two parts, one of which, being on the other side of the meridian plane aqr, is invisible. Fig. 6 shows the complete orthographic projection.
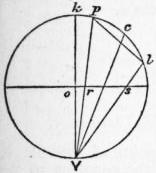
Fig. 7.
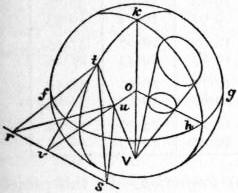
Fig. 8.
Stereographic Projection.—In this case the point of vision is on the surface, and the projection is made on the plane of the great circle whose pole is V. Let kplV (fig. 7) be a great circle through the point of vision, and ors the trace of the plane of projection. Let c be the centre of a small circle whose radius is cp = cl; the straight line pl represents this small circle in orthographic projection.
We have first to show that the stereographic projection of the small circle pl is itself a circle; that is to say, a straight line through V, moving along the circumference of pl, traces a circle on the plane of projection ors. This line generates an oblique cone standing on a circular base, its axis being cV (since the angle pVc = angle cVl); this cone is divided symmetrically by the plane of the great circle kpl, and also by the plane which passes through the axis Vc, perpendicular to the plane kpl. Now Vr·Vp, being = Vo sec kVp·Vk cos kVp = Vo·Vk, is equal to Vs·Vl; therefore the triangles Vrs, Vlp are similar, and it follows that the section of the cone by the plane rs is similar to the section by the plane pl. But the latter is a circle, hence also the projection is a circle; and since the representation of every infinitely small circle on the surface is itself a circle, it follows that in this projection the representation of small parts is strictly similar. Another inference is that the angle in which two lines on the sphere intersect is represented by the same angle in the projection. This may otherwise be proved by means of fig. 8, where Vok is the diameter of the sphere passing through the point of vision, fgh the plane of projection, kt a great circle, passing of course through V, and ouv the line of intersection of these two planes. A tangent plane to the surface at t cuts the plane of projection in the line rvs perpendicular to ov; tv is a tangent to the circle kt at t, tr and ts are any two tangents to the surface at t. Now the angle vtu (u being the projection of t) is 90° − otV = 90° − oVt = ouV = tuv, therefore tv is equal to uv; and since tvs and uvs are right angles, it follows that the angles vts and vus are equal. Hence the angle rts also is equal to its projection rus; that is, any angle formed by two intersecting lines on the surface is truly represented in the stereographic projection.
In this projection, therefore, angles are correctly represented and every small triangle is represented by a similar triangle. Projections having this property of similar representation of small parts are called orthomorphic, conform or conformable. The word orthomorphic, which was introduced by Germain27 and adopted by Craig,28 is perhaps the best to use.
Since in orthomorphic projections very small figures are correctly represented, it follows that the scale is the same in all directions round a point in its immediate neighbourhood, and orthomorphic projections may be defined as possessing this property. There are many other orthomorphic projections, of which the best known is Mercator’s. These are described below.
We have seen that the stereographic projection of any circle of the sphere is itself a circle. But in the case in which the circle to be projected passes through V, the projection becomes, for a great circle, a line through the centre of the sphere; otherwise, a line anywhere. It follows that meridians and parallels are represented in a projection on the horizon of any place by two systems of orthogonally cutting circles, one system passing through two fixed points, namely, the poles; and the projected meridians as they pass through the poles show the proper differences of longitude.
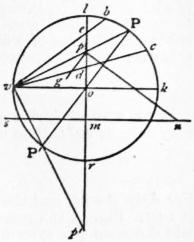
Fig. 9.
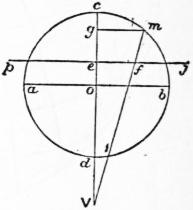
Fig. 10.
To construct a stereographic projection of the sphere on the horizon of a given place. Draw the circle vlkr (fig. 9) with the diameters kv, lr at right angles; the latter is to represent the central meridian. Take koP equal to the co-latitude of the given place, say u; draw the diameter PoP′, and vP, vP′ cutting lr in pp′: these are the projections of the poles, through which all the circles representing meridians have to pass. All their centres then will be in a line smn which crosses pp′ at right angles through its middle point m. Now to describe the meridian whose west longitude is ω, draw pn making the angle opn = 90° − ω, then n is the centre of the required circle, whose direction as it passes through p will make an angle opg = ω with pp′. The lengths of the several lines are
op = tan 1⁄2u; op′ = cot 1⁄2u; om = cot u; mn = cosec u cot ω.
Again, for the parallels, take Pb = Pc equal to the co-latitude, say c, of the parallel to be projected; join vb, vc cutting lr in e, d. Then ed is the diameter of the circle which is the required projection; its centre is of course the middle point of ed, and the lengths of the lines are
od = tan 1⁄2(u − c); oe = tan 1⁄2(u + c).
The line sn itself is the projection of a parallel, namely, that of which the co-latitude c = 180° − u, a parallel which passes through the point of vision.
Notwithstanding the facility of construction, the stereographic projection is not much used in map-making. It is sometimes used for maps of the hemispheres in atlases, and for star charts.
External Perspective Projection.—We now come to the general case in which the point of vision has any position outside the sphere. Let abcd (fig. 10) be the great circle section of the sphere by a plane passing through c, the central point of the portion of surface to be represented, and V the point of vision. Let pj perpendicular to Vc be the plane of representation, join mV cutting pj in f, then f is the projection of any point m in the circle abc, and ef is the representation of cm.
Let the angle com = u, Ve = k, Vo = h, ef = ρ; then, since ef: eV = mg : gV, we have ρ = k sin u/(h + cos u), which gives the law connecting a spherical distance u with its rectilinear representation ρ. The relative scale at any point in this system of projection is given by
σ = dρ / du, σ′ = ρ / sin u,
σ = k (1 + h cos u) / (h + cos u)2; σ′ = k / (h + cos u),
the former applying to measurements made in a direction which passes through the centre of the map, the latter to the transverse direction. The product σσ′ gives the exaggeration of areas. With respect to the alteration of angles we have Σ = (h + cos u) / (l + k cos u), and the greatest alteration of angle is
sin−1 ( h − 1 tan2 u ).
h + 1 2
This vanishes when h = 1, that is if the projection be stereographic; or for u = 0, that is at the centre of the map. At a distance of 90° from the centre, the greatest alteration is 90° − 2 cot−1 √h. (See Phil. Mag. 1862.)
Clarke’s Projection.—The constants h and k can be determined, so that the total misrepresentation, viz.:
M = ∫β0 { (σ − 1)2 + (σ′ − 1)2 } sin u du,
shall be a minimum, β being the greatest value of u, or the spherical radius of the map. On substituting the expressions for σ and σ′ the integration is effected without difficulty. Put
λ = (1 − cos β) / (h + cos β); ν = (h − 1) λ,
H = ν − (h + 1) loge (λ + 1), H′ = λ (2 − ν + 1⁄3ν2) / (h + 1).
Then the value of M is
M = 4 sin2 1⁄2β + 2kH + k2H′.
When this is a minimum,
dM / dh = 0; dM / dk = 0 ∴ kH′ + H = 0; 2 dH / dh + k dh H′ / dh = 0.
Therefore M = 4 sin2 1⁄2β − H2/H1, and h must be determined so as to make H2 : H′ a maximum. In any particular case this maximum can only be ascertained by trial, that is to say, log H2 − log H′ must be calculated for certain equidistant values of h, and then the particular value of h which corresponds to the required maximum can be obtained by interpolation. Thus we find that if it be required to make the best possible perspective representation of a hemisphere, the values of h and k are h = 1.47 and k = 2.034; so that in this case
ρ = 2.034 sin u .
1.47 + cos u
For a map of Africa or South America, the limiting radius β we may take as 40°; then in this case
ρ = 2.543 sin u .
1.625 + cos u
For Asia, β = 54, and the distance h of the point of sight in this case is 1.61. Fig. 11 is a map of Asia having the meridians and parallels laid down on this system.
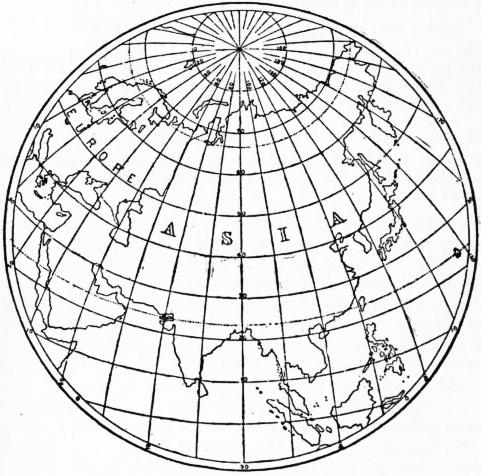
Fig. 11.
Fig. 12 is a perspective representation of more than a hemisphere, the radius β being 108°, and the distance h of the point of vision, 1.40.
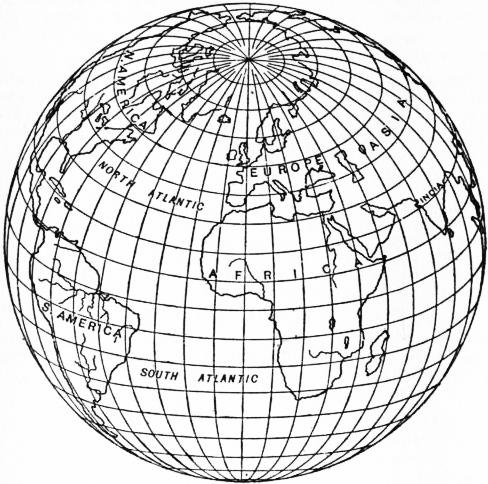
Fig. 12.—Twilight Projection. Clarke’s Perspective Projection for a Spherical Radius of 108°.
The co-ordinates xy of any point in this perspective may be expressed in terms of latitude and longitude of the corresponding point on the sphere in the following manner. The co-ordinates originating at the centre take the central meridian for the axis of y and a line perpendicular to it for the axis of x. Let the latitude of the point G, which is to occupy the centre of the map, be γ; if φ, ω be the latitude and longitude of any point P (the longitude being reckoned from the meridian of G), u the distance PG, and μ the azimuth of P at G, then the spherical triangle whose sides are 90° − γ, 90° − φ, and u gives these relations—
sin u sin μ = cos φ sin ω,
sin u cos μ = cos γ sin φ − sin γ cos φ cos ω,
cos u = sin γ sin φ + cos γ cos φ cos ω.
Now x = ρ sin μ, y = ρ cos μ, that is,
x = cos φ sin ω ,
k h + sin γ sin φ + cos γ cos φ cos ω
y = cos γ sin φ − sin γ cos φ cos ω ,
k h + sin γ sin φ + cos γ cos φ cos ω
by which x and y can be computed for any point of the sphere. If from these equations we eliminate ω, we get the equation to the parallel whose latitude is φ; it is an ellipse whose centre is in the central meridian, and its greater axis perpendicular to the same. The radius of curvature of this ellipse at its intersection with the centre meridian is k cos φ / (h sin γ + sin φ).
The elimination of φ between x and y gives the equation of the meridian whose longitude is ω, which also is an ellipse whose centre and axes may be determined.
The following table contains the computed co-ordinates for a map of Africa, which is included between latitudes 40° north and 40° south and 40° of longitude east and west of a central meridian.
φ Values of x and y.
ω = 0° ω = 10° ω = 20° ω = 30° ω = 40°
0° x = 0.00 9.69 19.43 29.25 39.17
y = 0.00 0.00 0.00 0.00 0.00
10° x = 0.00 9.60 19.24 28.95 38.76
y = 9.69 9.75 9.92 10.21 10.63
20° x = 0.00 9.32 18.67 28.07 37.53
y = 19.43 19.54 19.87 20.43 21.25
30° x = 0.00 8.84 17.70 26.56 35.44
y = 29.25 29.40 29.87 30.67 31.83
40° x = 0.00 8.15 16.28 24.39 32.44
y = 39.17 39.36 39.94 40.93 42.34
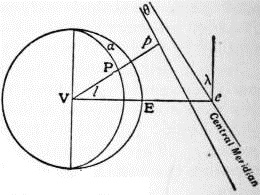
Fig. 13.
Central or Gnomonic (Perspective) Projection.—In this projection the eye is imagined to be at the centre of the sphere. It is evident that, since the planes of all great circles of the sphere pass through the centre, the representations of all great circles on this projection will be straight lines, and this is the special property of the central projection, that any great circle (i.e. shortest line on the spherical surface) is represented by a straight line. The plane of projection may be either parallel to the plane of the equator, in which case the parallels are represented by concentric circles and the meridians by straight lines radiating from the common centre; or the plane of projection may be parallel to the plane of some meridian, in which case the meridians are parallel straight lines and the parallels are hyperbolas; or the plane of projection may be inclined to the axis of the sphere at any angle λ.
In the latter case, which is the most general, if θ is the angle any meridian makes (on paper) with the central meridian, α the longitude of any point P with reference to the central meridian, l the latitude of P, then it is clear that the central meridian is a straight line at right angles to the equator, which is also a straight line, also tan θ = sin λ tan α, and the distance of p, the projection of P, from the equator along its meridian is (on paper) m sec α sin l / sin (l + x), where tan x = cot λ cos α, and m is a constant which defines the scale.
The three varieties of the central projection are, as is the case with other perspective projections, known as polar, meridian or horizontal, according to the inclination of the plane of projection.
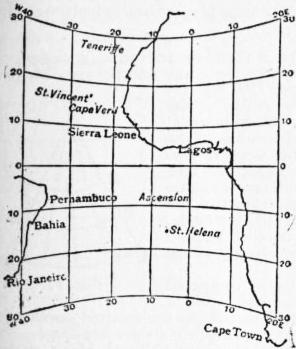
(From Text Book of Topographical Surveying, by permission of the Controller of H. M. Stationery Office.)
Fig. 14.—Part of the Atlantic Ocean on a Meridian Central Projection. The shortest path between any two points is shown on this projection by a straight line.
Fig. 14 is an example of a meridian central projection of part of the Atlantic Ocean. The term “gnomonic” was applied to this projection because the projection of the meridians is a similar problem to that of the graduation of a sun-dial. It is, however, better to use the term “central,” which explains itself. The central projection is useful for the study of direct routes by sea and land. The United States Hydrographic Department has published some charts on this projection. False notions of the direction of shortest lines, which are engendered by a study of maps on Mercator’s projection, may be corrected by an inspection of maps drawn on the central projection.
There is no projection which accurately possesses the property of showing shortest paths by straight lines when applied to the spheroid; one which very nearly does so is that which results from the intersection of terrestrial normals with a plane.
We have briefly reviewed the most important projections which are derived from the sphere by direct geometrical construction, and we pass to that more important branch of the subject which deals with projections which are not subject to this limitation.
Conical Projections.
Conical projections are those in which the parallels are represented by concentric circles and the meridians by equally spaced radii. There is no necessary connexion between a conical projection and any touching or secant cone. Projections for instance which are derived by geometrical construction from secant cones are very poor projections, exhibiting large errors, and they will not be discussed. The name conical is given to the group embraced by the above definition, because, as is obvious, a projection so drawn can be bent round to form a cone. The simplest and, at the same time, one of the most useful forms of conical projection is the following:
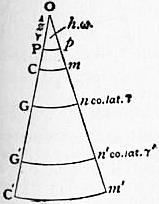
Fig. 15.
Conical Projection with Rectified Meridians and Two Standard Parallels.—In some books this has been, most unfortunately, termed the “secant conical,” on account of the fact that there are two parallels of the correct length. The use of this term in the past has caused much confusion. Two selected parallels are represented by concentric circular arcs of their true lengths; the meridians are their radii. The degrees along the meridians are represented by their true lengths; and the other parallels are circular arcs through points so determined and are concentric with the chosen parallels.
Thus in fig. 15 two parallels Gn and G′n′ are represented by their true lengths on the sphere; all the distances along the meridian PGG′, pnn′ are the true spherical lengths rectified.
Let γ be the co-latitude of Gn; γ′ that of Gn′; ω be the true difference of longitude of PGG′ and pnn′; hω be the angle at O; and OP = z, where Pp is the representation of the pole. Then the true length of parallel Gn on the sphere is ω sin γ, and this is equal to the length on the projection, i.e. ω sin γ = hω (z + γ); similarly ω sin γ′ = hω (z + γ′).
The radius of the sphere is assumed to be unity, and z and γ are expressed in circular measure. Hence h = sin γ/(z + γ) = sin γ′ (z + γ′); from this h and z are easily found.
In the above description it has been assumed that the two errorless parallels have been selected. But it is usually desirable to impose some condition which itself will fix the errorless parallels. There are many conditions, any one of which may be imposed. In fig. 15 let Cm and C′m′ represent the extreme parallels of the map, and let the co-latitudes of these parallels be c and c′, then any one of the following conditions may be fulfilled:—
(a) The errors of scale of the extreme parallels may be made equal and may be equated to the error of scale of the parallel of maximum error (which is near the mean parallel).
(b) Or the errors of scale of the extreme parallels may be equated to that of the mean parallel. This is not so good a projection as (a).
(c) Or the absolute errors of the extreme and mean parallels may be equated.
(d) Or in the last the parallel of maximum error may be considered instead of the mean parallel.
(e) Or the mean length of all the parallels may be made correct. This is equivalent to making the total area between the extreme parallels correct, and must be combined with another condition, for example, that the errors of scale on the extreme parallels shall be equal.
We will now discuss (a) above, viz. a conical projection with rectified meridians and two standard parallels, the scale errors of the extreme parallels and parallel of maximum error being equated.
Since the scale errors of the extreme parallels are to be equal,
h (z + c) − 1 = h (z + c′) − 1, whence z = c′ sin c − c sin c′ .
sin c sin c′ sin c′ − sin c
(i.)
The error of scale along any parallel (near the centre), of which the co-latitude is b is
1 − { h (z + b) / sin b }.
(ii.)
This is a maximum when
tan b − b = z, whence b is found.
Also
1 − h (z + b) = h (z + c) − 1 whence h is found.
sin b sin c
(iii.)
For the errorless parallels of co-latitudes γ and γ′ we have
h = (z + γ) / sin γ = (z + γ′) / sin γ′.
If this is applied to the case of a map of South Africa between the limits 15° S. and 35° S. (see fig. 16) it will be found that the parallel of maximum error is 25° 20′; the errorless parallels, to the nearest degree, are those of 18° and 32°. The greatest scale error in this case is about 0.7%.
In the above account the earth has been treated as a sphere. Of course its real shape is approximately a spheroid of revolution, and the values of the axes most commonly employed are those of Clarke or of Bessel. For the spheroid, formulae arrived at by the same principles but more cumbrous in shape must be used. But it will usually be sufficient for the selection of the errorless parallels to use the simple spherical formulae given above; then, having made the selection of these parallels, the true spheroidal lengths along the meridians between them can be taken out of the ordinary tables (such as those published by the Ordnance Survey or by the U.S. Coast and Geodetic Survey). Thus, if a1, a2, are the lengths of 1° of the errorless parallels (taken from the tables), d the true rectified length of the meridian arc between them (taken from the tables),
h = { (a2 − a1) / d} 180 / π,
and the radius on paper of parallel, a1 is a1d/(a2 − a1), and the radius of any other parallel = radius of a1 ± the true meridian distance between the parallels.
This class of projection was used for the 1/1,000,000 Ordnance map of the British Isles. The three maximum scale errors in this case work out to 0.23%, the range of the projection being from 50° N. to 61° N., and the errorless parallels are 59° 31′ and 51°44′.
Where no great refinement is required it will be sufficient to take the errorless parallels as those distant from the extreme parallels about one-sixth of the total range in latitude. Thus suppose it is required to plot a projection for India between latitudes 8° and 40° N. By this rough rule the errorless parallels should be distant from the extreme parallels about 32°/6, i.e. 5° 20′; they should therefore, to the nearest degree, be 13° and 35° N. The maximum scale errors will be about 2%.
The scale errors vary approximately as the square of the range of latitude; a rough rule is, largest scale error = L2/50,000, where L is the range in the latitude in degrees. Thus a country with a range of 7° in latitude (nearly 500 m.) can be plotted on this projection with a maximum linear scale error (along a parallel) of about 0.1%;29 there is no error along any meridian. It is immaterial with this projection (or with any conical projection) what the extent in longitude is. It is clear that this class of projection is accurate, simple and useful.
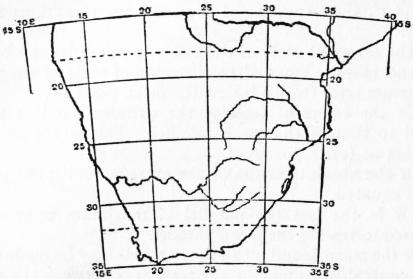
(From Text Book of Topographical Surveying, by permission of the Controller of H. M. Stationery Office.)
Fig. 16.—South Africa on a conical projection with rectified meridians and two standard parallels. Scale 800 m. to 1 in.
In the projections designated by (c) and (d) above, absolute errors of length are considered in the place of errors of scale, i.e. between any two meridians (c) the absolute errors of length of the extreme parallels are equated to the absolute error of length of the middle parallel. Using the same notation
h (z + c) − sin c = h (z + c′) − sin c′ = −h (z + 1⁄2c + 1⁄2c′) − sin 1⁄2 (c + c′).
L. Euler, in the Acta Acad. Imp. Petrop. (1778), first discussed this projection.
If a map of Asia between parallels 10° N. and 70° N. is constructed on this system, we have c = 20°, c′ = 80°, whence from the above equations z = 66.7° and h = .6138. The absolute errors of length along parallels 10°, 40° and 70° between any two meridians are equal but the scale errors are respectively 5, 6.7, and 15%.
The modification (d) of this projection was selected for the 1 : 1,000,000 map of India and Adjacent Countries under publication by the Survey of India. An account of this is given in a pamphlet produced by that department in 1903. The limiting parallels are 8° and 40° N., and the parallel of greatest error is 23° 40′ 51″. The errors of scale are 1.8, 2.3, and 1.9%.
It is not as a rule desirable to select this form of the projection. If the surface of the map is everywhere equally valuable it is clear that an arrangement by which errors of scale are larger towards the pole than towards the equator is unsound, and it is to be noted that in the case quoted the great bulk of the land is in the north of the map. Projection (a) would for the same region have three equal maximum scale errors of 2%. It may be admitted that the practical difference between the two forms is in this case insignificant, but linear scale errors should be reduced as much as possible in maps intended for general use.
f. In the fifth form of the projection, the total area of the projection between the extreme parallels and any two meridians is equated to the area of the portion of the sphere which it represents, and the errors of scale of the extreme parallels are equated. Then it is easy to show that
z = (c′ sin c − c sin c′) / (sin c′ − sin c);