PART I. BUILD, ITS DEFINITION AND ITS ONTOGENY.
Reading edition
A. GENERAL CONSIDERATIONS.
If a hundred men of about the same stature be compared, it is seen that they vary greatly in weight. At the same time they vary in form, and especially in bulk. This variation is popularly recognized by the variety of terms applied to build. It may be of interest to pause a moment to consider popular terminology relating to build. We have, first, terms expressing a marked deviation below the normal build. We speak of persons as “slender,” “thin,” “gaunt,” “slim,” “slight,” “spare,” “lank,” and “spindling.” These terms are not exactly synonyms. “Lank” implies angularity; “gaunt” connotes the ravage of disease; “thin” connotes a loss of weight; “slight” connotes lightness and smallness of bone; “spindling” is used especially of youth in the period of rapid growth preceding adolescence; “slim” has a faint connotation of insufficiency; “slender” best expresses the idea which we shall want to use in this work where we have a relatively small interest in stature and where we wish to avoid connotation of disease, developmental changes, etc. In other languages there exists a series of terms which similarly differ slightly in connotation. Thus, in French, there is “maigre,” in German “mager,” which often connote a loss of weight through disease, “dünn,” which connotes loss of a former more nearly average weight, and “schlank,” which is close to the English “slender.” On the other hand, the English language contains a variety of terms applicable to deviation in build above the average. Thus we have the words “stout,” “portly,” “fleshy,” “corpulent,” “thick-set,” “obese,” “chubby,” and “fat.” The word “stout” usually carries a connotation of vigor. The term “portly” connotes large size with a tendency to excessively great circumference. “Fleshy” is nearly synonymous with “portly” but has less connotation of majesty of size. “Corpulent” usually carries a connotation of abdominal enlargement. “Thick-set” implies a large bony frame. “Obese” frequently connotes excessive, strictly pathological, increase of build. “Chubby” is applied especially to infants. “Fat” connotes excessive production of fat in the body, as opposed to an unusually large muscular development. Perhaps of all of these terms “fleshy” is as satisfactory as any as an expression for build without connotation in respect to degree or source of great weight, whether due to fat, muscle, or bone. In the German language there are the terms, “plump,” and “schwerfällig,” which serve to express large build. In the French language there are the terms, “gros,” “obese,” and “embonpoint,” which is near to the English equivalent “stout” or “fleshy.” In the present work the term “fleshy” is used, despite its slight suggestion of muscular development merely, largely because it begins with a different letter from slender. The word “slender” will be used for the other extreme of build. It has been found convenient to indicate those terms by their initial letters “S” and “F” respectively.
Our main problem is, in how far does this difference in build between slender and fleshy persons depend on constitutional factors?
Types of Variation in Build.
Two types of variation in build have to be distinguished: (a) the ontogenetic change in normal build during development with increasing stature, and (b) the change in weight in adults of relatively invariable stature. In type a, stature and other proportions are rapidly changing, but in type b, stature remains constant, and, throughout the race, stature does not differ as much in mature persons as it does from birth to maturity. These two types follow different laws and must be studied by different methods. Consequently they are considered in distinct parts of the present paper.
The Measurement of Build.
It is now necessary to consider how build may best be expressed quantitatively. The subject of the best index of build has been much discussed, but without sufficiently differentiating between the two types of variation in build, the ontogenetic and the adult. One of the latest authors to consider the matter is Bardeen (1920, p. 486), who mentions the desirability of recording the volume of the body as a whole, notes its impracticability, and concludes that we may estimate volume from weight. It may, however, be doubted if volume is really involved in the popular notion of build. At least, it is equally probable that the idea of build, as popularly conceived, is a relation of transverse to vertical diameters. When I look at a man, or a photograph of one as in plate 1, and think, “he is slender,” it is because I make a mental comparison of his breadth (of shoulders or chest) with his height and find that his breadth in comparison with that of most men I know of that height is small; or if he is stout the diameter of the chest is large in relation to stature (plate 2). It seems probable that breadth in relation to height gives the best expression of the popular idea of build. By the use of this relation, build can be easily expressed for any age, since chest circumference (which bears a nearly constant relation to chest diameter) has been recorded for many persons of all ages.
Ontogenetic.—Since in so many children and young people the stature and chest circumference have been measured, it is possible to use these data in finding the law of normal ontogenetic changes in build from birth to maturity. This ratio, chest-girth ÷ stature, has thus been used in discussing this law, as more fully described in section B. This relation can be used for tracing the change in build of the same developing child or for tracing the average change of build.
Adult.—In the study of adult changes of build we start with the condition that in the individual the stature is fixed. Consequently, in an individual whose weight is changing, the relation of the build at a years is to that at another period n years later as chest-girth at a years : chest-girth at a + n years. Thus, in the adult period, changes of build are proportional to chest-girth. In different persons, of differing stature, the stature has to be taken into account, and the differences in build are measured by the relation of relative chest-girth as in children. Unfortunately, in our study of heredity in adult build, we usually do not know the chest-girth of the different members of the family, but only their stature and weight. Our problem is, then, to find a relation between chest-girth and weight that will enable us to infer the one from the other. This problem will be further considered in a later section (p. 24).
Sexual Differences in Build.
Sex influences the body so profoundly that we have, first of all, to consider its influence on build, either in early or in adult stages. At birth there is, on the average, a difference between the sexes in weight. The male is about 2.5 per cent heavier than the female (3,310 : 3,230 grams in German children, Daffner, 1902, p. 125, quoting Hecker; 3,606 : 3,485 grams in American children, Benedict and Talbot, 1915). But this does not imply that the boy baby is the chubbier, since the boy baby is longer by about 1.7 per cent than the girl baby. There is no obvious difference in the chubbiness of the sexes at birth. Likewise, in later infancy no obvious difference has been detected, though no thoroughgoing studies have been made on this subject. In childhood and youth children of different sex differ in build on the average, but this is because the form of the ontogenetic curve of build is very different. After maturity and cessation of growth, there is a marked difference in form between the sexes. The female has more subcutaneous fat and appears plumper. If the criterion of weight be applied, the complication arises that the specific gravity of the female seems to be less than that of the male (Bardeen, 1920, p. 488, following Meeh, 1895). As found by Medico-Actuarial Mortality investigations of the Associated Life Insurance Medical Directors of the Actuarial Society of America, 1912, volume I, p. 251: “The difference in weight between men and women of the same height is slight under the age of 20, but above that age young men are distinctly heavier than young women, the difference becoming less marked as they grow older. The tall women are markedly lighter than men of the same height.” The main reason for the greater weight of young men is their relatively much greater chest circumference.
Table 1.—The distribution of frequencies of the various classes of build of offspring derived from the various types of matings.
Summation Table, Males only. Based on Table 11.
Type of mating. No. of matings. No. of children. Build of male offspring. Total No. of male and female children.
VS S M F VF
VS×S 4 5 1 2 1 1 0 11
VS×M 8 11 0 2 7 2 0 28
VS×F 5 12 0 1 4 6 1 25
S×S 23 29 1 21 7 0 0 47
S×M 101 172 0 12 116 38 6 306
S×F 49 88 1 5 51 30 1 155
S×VF 11 23 0 3 8 10 2 34
M×M 92 178 0 18 117 40 3 327
M×F 114 194 0 9 118 58 9 340
M×VF 30 59 1 3 21 24 10 112
F×F 33 77 3 30 34 6 4 156
F×VF 30 57 0 0 22 28 7 100
VF×VF 7 21 0 0 9 3 9 30
Total 507 926 7 106 515 246 52 1,671
Average build 25.00 29.03 33.64 39.15 49.09
Table 2.—The distribution of frequencies of the various classes of build of offspring derived from the various types of matings.
Summation Table, Females only. Based on Table 11a.
Type of mating. No. of matings. No. of children. Build of female offspring.
VS S M F VF
VS×S 4 6 1 4 1 0 0
VS×M 8 17 1 5 10 0 0
VS×F 5 13 1 4 6 1 1
S×S 23 18 4 11 3 0 0
S×M 101 134 0 36 78 15 5
S×F 49 67 2 16 29 19 1
S×VF 11 11 0 1 6 4 0
M×M 92 149 2 21 81 41 4
M×F 114 146 0 19 90 30 7
M×VF 30 53 1 4 29 12 7
F×F 33 79 0 12 30 27 10
F×VF 30 43 0 3 16 14 10
VF×VF 7 9 0 0 5 3 1
Total 507 745 12 136 384 167 46
Average build 24.17 28.69 33.41 39.23 46.76
Average female index of build, 34.54 ± .13. Standard deviation, 5.13 ± .09.
Proceeding by a method to be developed later, I have divided adult build into five classes, and counted for the various matings the number of children falling into each. (See tables 1 and 2.) The average index of build, obtained from the individual indices of build, is 2.52 (metric system) or 35.81 ± 0.12 (English system) for males, and 2.43 (34.54 ± 0.13) for females, a difference of only 3.7 per cent in favor of the males, a difference that for our purposes can be neglected. A separation of the sexes in our studies will therefore be, ordinarily, not attempted, and this has the advantage in giving us larger frequencies in our tables.
Racial Differences in Build.
That there are marked racial differences in build is notorious. The slender Scotchman (plate 1, fig. 3) is in striking contrast with the South Italian, Greek, or Russian Jew (plate 2, fig. 3). The Eskimo are noted for their fleshiness, but Arctic conditions seem to favor large build. (See Davenport and Love, 1921, p. 165.) Martin (1914, p. 248) gives an average body-build of 1.42 (2.3 our system) for South Russian Jews and 1.07 (1.7 our system) for Bushmen. Probably the Nilotic negroes are the slenderest race on earth (Martin, 191, p. 254; for photograph see Martin, p. 263, or Davenport, 1917, p. 347). The racial differences in body-build are so great that, when feasible, race should be taken into account in studies on body-build.
Geographical Differences in Build.
Apart from race, it seems probable that climate influences build. The races that live in the north polar region are of stout build, but this may be a racial trait. On the other hand, the whites who come to live near the pole are heavier than those who live near the equator. This may be due to relative freedom in the subpolar area from certain diseases which reduce weight. There may, however, be a physiological response of the body to the long, cold winters. Whatever the explanation, men from Alaska were found, at mobilization of the United States Army in 1917-18, to have a much higher index of build than those from any other region, i. e., 2.28 (32.41);[1] North Dakota and South Dakota came next, with indices of 2.24 (31.85) and 2.23 (31.73) respectively. These were followed by Montana, Minnesota, and Wisconsin. Contrariwise, the recruits from the Gulf States had a low index of build. Whatever the determining causes, geographical differences in build do exist. Consequently, in studies of build, it is desirable to consider the residences of the persons studied.
B. THE ONTOGENY OF BUILD.
From the time of fertilization of the egg it proceeds on its course of development directed by its “hereditary factors,” but modifiable by the conditions offered by the environment. Thus is determined the weight of the baby at birth, and thus the build of the later stages to maturity are directed. It has seemed useful to measure the changes in build from birth to maturity, using the method of measuring build during development described in an earlier section (p. 4).
Materials and Methods.
The materials available for such a study are considerable and may be drawn from a large number of different nationalities. A selection had to be made from this material; there were chosen the best available series from those nationalities most representative of the population of the United States, considering the diversity of its European origin. Two sets of data were utilized: first, collections of measurements made on males from 1 year to 21 years; second, some collections from children of both sexes from birth to 1 year of age.
The first collection of data is gathered from nine sources, listed below. The data used are given in detail in table 3, which shows the number of individuals measured by each observer at each age, the average relative chest-girth at that age, and the average, for each age, of the different averages of the relative chest-girths formed by each observer. These averages are not weighted, since the racial stocks measured by the different observers differed. The average of each observer has therefore to be considered as a unit of nearly equal value with that of any other (table 3).
1. Quetelet (1870) data. As Quetelet’s original book was not available, the data reprinted in Bardeen (1920, p. 544) were used. Quetelet measured 10 persons at each age from 1 to 20 years (and older). He selected his subjects with good judgment and the resulting curve of varying build is remarkably smooth. The subjects were doubtless Belgians.
2. Weissenberg (1911) data. These were gathered by observations on South Russian Jews. The numbers observed ranged from 15 males at birth to about 40 to 100 at later ages. This series is of especial value because such large numbers of individuals of each age were measured and because in it are considered only children as near as possible to their birthdays; that is, as 2 or 3 year old children were taken those of exactly 2 or 3 years ± 2 months; as 4, 5, and 6 year olds, 4, 5, and 6 years ± 3 months; as 7 and 8 years, 7 or 8 years ± 4 months. For older children the even year ± 5 months was taken. The measurement was taken at the line of the nipples and below the lower apex of the scapulæ; chest apparently at rest.
3. Benedict and Talbot (1920) data. These were gathered from healthy children of Boston, Massachusetts. Girth was taken at the nipples, in a quiescent condition. The number of individuals considered at each age is small (1 to 9), but the data are precious, because so few have been published for the period 2 to 5 years.
4. Masters Day Nursery data. Original, from measurements made upon healthy children in New York City. The chest was measured at the line of the nipples in a quiescent condition. The numbers are small, 2 per year.
5. Town (1922) data. A special study of 5 and 6 year old children of Cedar Rapids, Iowa. There were 31 and 11 children respectively.
6. Reitz (1904) data. A study of school children of Berlin, Germany. Chest-girth measured “at rest.” From 23 to 209 at the respective ages from 6 to 19 years, inclusive.
7. Baldwin (1921) data. A group of 60 boys of the well-to-do class at the Horace Mann School, New York City, were measured repeatedly in successive years from 7 to 17 years of age inclusive. Chest at “normal” condition.
8. Godin (1903) data. Measurements taken annually on the same 100 boys in a French military school at St. Hippolyte-du-Fort, Gard. Chest-girth below pectoralis in repose. Ages 13½ to 17 years inclusive.
9. Hitchcock, Seeley, and Phillips (1900) data. Measurements made on about 40 to 600 students at Amherst College at each age from 16 to 26 years inclusive. The chest-girth is made at the level of the nipples and embraces the scapulæ.
Table 3.—Average relative chest-girth (chest girth + stature) at different ages from birth to maturity, males.
[According to the observations of 9 sets of observers. The main entries of the table are given in 4 places of decimals (points omitted). Immediately to the left of each main entry is given the number of persons measured to obtain that average. The column on the extreme right gives the (unweighted) average of the averages standing on the same line.]
Time. 1. Quetelet. 2. Weissenberg. 3. Benedict and Talbot. 4. Masters Day Nursery 5. Town. 6. Reitz. 7. Baldwin. 8. Godin. 9. Hitchcock. Unweighted averages.
No. Avg. No. Avg. No. Avg. No. Avg. No. Avg. No. Avg. No. Avg. No. Avg. No. Avg.
Birth 10 5900 5511 3 6600 6004
1 year 10 6300 3 6300 6300
2 years 10 5850 38 6005 6 6060 5972
3 years 10 5600 38 5803 1 5760 5721
4 years 10 5430 38 5567 2 5600 5532
5 years 10 5300 55 5353 4 5340 2 5263 31 5082 5268
6 years 10 5200 55 5208 4 5040 2 5136 11 4990 5115
7 years 10 5110 81 5058 7 5190 2 5072 60 4852 5056
8 years 10 5040 95 5030 7 5100 60 4821 4998
9 years 10 4990 112 5016 7 5060 168 4573 60 4805 4889
10 years 10 4950 132 4952 5 5150 181 4569 60 4793 4883
11 years 10 4920 117 4911 9 4950 209 4595 60 4740 4823
12 years 10 4910 103 4780 6 4810 189 4546 60 4731 4755
13 years 10 4900 115 4850 143 4542 60 4762 100 4966 4804
14 years 10 4900 109 4866 158 4506 60 4745 100 5071 4818
15 years 10 4910 102 4923 140 4550 60 4813 100 5166 4872
16 years 10 4930 103 4888 117 4626 60 4870 100 5295 40 5000 4935
17 years 10 4970 108 4929 70 4598 60 4974 100 5296 250 4968 4956
18 years 10 5040 115 5046 40 4684 600 5003 4943
19 years 10 5110 116 5076 23 4833 600 5089 5027
20 years 10 5180 129 5040 600 5136 5119
21 years 600 5205 5205
25 years 5250 5291 5271
Owing to the complex nature of the curve of build during the first year of development, special collections of data were made for this portion of the curve (table 4). They are listed as follows:
1. Original data contributed by Dr. Bret Ratner, pediatrician, of New York, being measurements made in May and June, 1922, of weight, length, and chest circumference on 11 babies at the Manhattan Maternity Hospital during each of the first 10 days after birth. There were 9 boys and 2 girls. Judging alone by the surnames, there were apparently of British stock 6, of German stock 2, of Italian stock 2, and of Spanish stock 1. It is very difficult to measure length and chest-girth of infants. Length “on birthday” was generally taken with the child suspended by its feet, chest-girth with the chest as quiet as possible. The first measurement was taken as soon as the baby was born, and each morning thereafter at 8ʰ30ᵐ a.m. The later lengths were measured on a graduated board.
2. New York Milk Station data collected by Miss Louise A. Nelson and Miss Margaret R. Babcock, of the Eugenics Record Office staff. They were made during May and June 1922, on healthy babies, without clothing. The length was measured with the aid of a graduated board. Boys and girls were both included, as at this age their build is not very different, on the average. The numbers ranged from 4 to 52 for the various months from 0.5 month to 13 months by 0.5-month intervals.
3. Ratner advanced data. Original data secured by Dr. Bret Ratner (at Manhattan Maternity Hospital, New York City, on healthy children whose parents brought them repeatedly to the hospital) and kindly given to the writer for this study. In this series, observations are especially abundant at 1, 1.5, and 2 months (47, 170, and 30 cases respectively).
4. Grover (1915) data. Boys only among out-patients of the Children’s Hospital, Boston, and visitors at milk stations. No clothing. Chest measured at level of nipples, midway between inspiration and expiration. Length measured on graduated board. From 2 to 5 at each month of age.
5. Benedict and Talbot (1920) data. (See No. 3, p. 9.) One to 6 individuals at the various months.
6. Schmid-Monnard (1892) data. Copied from Bardeen (1920, page 542). Boys and girls measured at Frankfort am Main, Germany. 8 to 67 in respective months. Ages 1 to 13 months and up to 30 months.
7. Crum (1915) data. Average measurements of babies without regard to sex, 193 to 264 per month, mostly baby-show babies and hence strongly selected. Various parts of the United States.
From the foregoing collections of data, tables 3, 4, and 5 were drawn up, giving for each age the mean relative chest-girth found by each observer. Also, the number of individuals upon which the measurement is based, necessary for weighting the mean. The mean of all measurements was weighted in table 4, but not in table 3 for the reasons stated on page 8.
Table 4.—Average relative chest-girth of infants from birth to 13 months.
[Obtained from 6 series of observations, described on pages 12, 13. The main entries of the table are given in 4 places of decimals (point omitted). Immediately to the left of each main entry is given the number of persons measured to obtain that average. The column at the extreme right gives the weighted averages of the averages standing in the same line.]
Time. 3. Ratner. 2. N. Y. Milk (♂ and ♀.) 4. Grover. 5. Benedict and Talbot. 6. Schmid and Monnard. 7. Crum. Aver.
No. Avg. No. Avg. No. Avg. No. Avg. No. Avg. No. Avg.
2 weeks 32 6641 4 6533 3 6599 6627
1 month 47 6602 26 6504 2 5861 2 6249 67 6280 6419
1.5 months 170 6772 36 6639 4 6574 6745
2 months 30 6670 52 6623 4 6661 3 6765 44 6470 6512
3 months 11 6700 49 6566 3 6220 4 6529 37 6040 6382
4 months 12 6542 39 6542 3 6157 4 6304 30 6510 6507
5 months 10 6492 26 6522 3 6278 3 6455 37 6230 6368
6 months 8 6500 39 6542 5 6278 6 6117 27 6540 259 6556 6540
7 months 10 6720 27 6424 3 6203 3 6500 19 6240 256 6468 6456
8 months 3 6267 23 6317 4 6464 1 6308 16 6400 232 6470 6450
9 months 3 6550 26 6364 3 6060 4 6352 29 6160 211 6355 6333
10 months 2 6200 18 6431 2 6237 2 6110 17 6400 209 6404 6400
11 months 1 6600 13 6354 2 5868 1 6174 15 6120 193 6336 6318
12 months 1 5800 8 6271 1 5691 1 6383 22 6090 289 6298 6280
13 months 11 6186 1 6026 19 6080 264 6235 6222
It will be observed that the means of build differ, for the constant age, more than do the differences between successive ages. That is to say, the absolute difference between races at any given age is greater than the average differences between one year and the next.
The mean relative chest circumferences for the different ages are plotted in figure 2.
The Ontogenetic Curve of Build.
The resulting curve of build from birth to maturity is given in figure 1. This curve shows that build in males is greatest at birth, or at about 1 month, and that it then steadily diminishes to 12 years of age. It then slowly increases to maturity, and indeed to 30 years, after which it increases with extreme slowness, probably to 55 years.
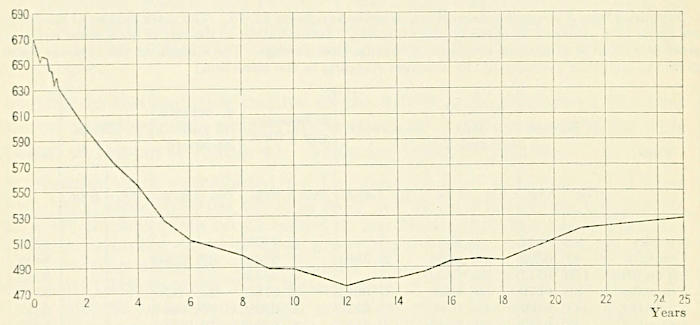
Fig. 1.—Polygon of development of relative chest-girth, male.
Abscissæ: Age in years. Ordinates (chest ÷ girth/stature) × 1000. Based on averages of the measurements of Quetelet (Belgians), Weissenberg (Russian Jews), Benedict and Talbot (U.S.A.), Masters Day Nursery, N. Y. City, Town (Iowa children), Gray and Jacobs (school boys, well-to-do), Reitz (Germans), Godin (French), Hitchcock (U.S.A. college men), Baldwin (N. Y. City schools).
From table 4a and the curve of build, figure 2, we see that the infant at birth has a chest-girth which is somewhat over two-thirds of stature (0.6685). It falls rapidly to one month after birth, and then begins to rise. This minimum is connected with the loss of weight which follows birth, and is due to the difficulty of making adjustments to the new conditions which the organism has to meet. This adjustment is soon thereafter completed and within 2 months chest-girth and weight are not only recovered, but have caught up with increasing length of body. At 6 weeks the body has reached its maximum post-natal chubbiness. Another temporary loss in chubbiness occurs at about 8 months, due perhaps to the cutting of the incisors. The decline which subsequently ensues is prevailingly due to the rapid growth of the legs without corresponding increase in transverse diameter (plates 3 and 4). At about 12 years the boy enters the awkward age when, his legs and arms having grown from 5 to 10 cm. in a single year, he has not yet acquired muscular control of them (plate 7, fig. 2). At the same time his trunk retains childish proportions (plate 5, fig. 12). A little earlier than the boy, the girl enters the “Backfisch” stage of similar slenderness and awkwardness (plate 7, fig. 3, from Stratz, 1922, p. 258). It is commonly believed that this rapid growth of the appendages and their long bones is controlled by the secretions of the pituitary gland. Gradually in the boy, at 14 years, as the gonads begin to ripen, the growth of the legs is retarded and the transverse chest diameter begins to increase rapidly; the lad is quickly transformed into a broad-shouldered, broad-chested, stocky man (plate 3, fig. 3, plate 5, fig. 8) and accordingly the curve of build rises much more in the young man than in the young woman (plate 7, figs. 4 and 5). Consequently the adult female build, as measured by relative chest circumference, is relatively small. At about 19 or 20 years’ growth in stature has usually practically ceased. Meanwhile chest-girth increases slowly by the enlargement of trunk muscles and deposition of fat. Weight is, indeed, stated to increase, on the average, until the age of 55 years (tables 6 and 7).
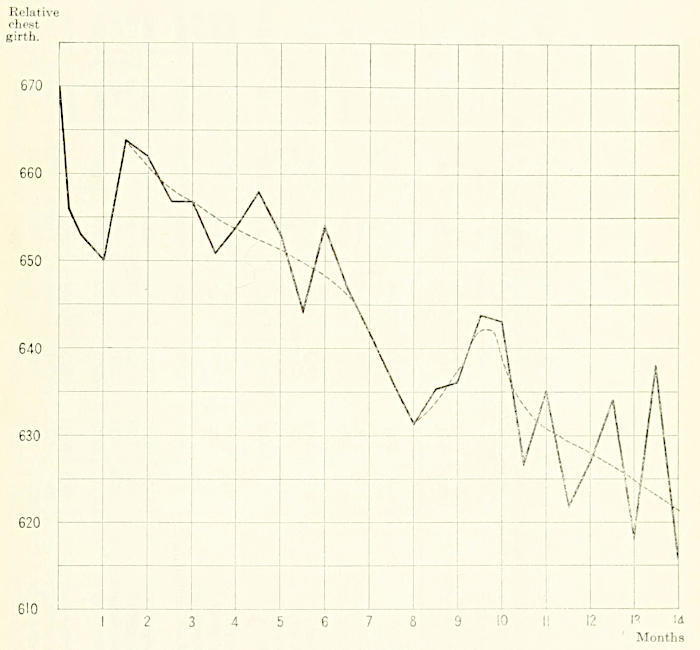
Fig. 2.—Polygon of relative chest-girth in infants, from birth to fourteen months, with smoothed curve of build (dotted line). Data from New York Milk Stations and Dr. B. Ratner.
Table 4a.—Weight, chest-girth, length of body, and relative chest-girth at birth and daily thereafter at 8ʰ30ᵐ for 10 days for 11 babies.
[Data furnished by Bret Ratner, M.D., from Manhattan Maternity Hospital and Dispensary, New York City. Weight in grams; chest-girth and length in millimeters. Relative chest-girth in ten-thousandths. Final average relative chest girth is multiplied by 1.037 to adjust to Table 4.]
Measurements, etc. At birth. 1st day. 2nd day. 3d day. 4th day. 5th day. 6th day. 7th day. 8th day. 9th day. 10th day.
No. 1, male. Time of birth, V 30, 2ʰ00ᵐ { Weight 2126 2084 1970 1899 1885 1821 1871 1899 1899 1899 1928
{ Ch. girth 28 28 28 27.75 27 26.5 27.5 27.5 28 27.5 27.5
{ Body-length 45 43.75 43.13 42.75 43 43 42 42.25 42.25 43 43.75
{ Rel. ch. girth 6400 6493 6491 6279 6163 6548 6509 6627 6395 6286
No. 2, male. Time of birth, V 30, 2ʰ25ᵐ { Weight 3472 3494 3423 3366 3430 3466 3529 3508 3515 3529 3572
{ Ch. girth 35 35 34.25 33 33.5 34 33.5 33 33.5 33.5 33.5
{ Body-length 52 52.25 51.5 50.75 51.5 52.25 52.25 52.25 52.5 52.5 52.5
{ Rel. ch. girth 6699 6651 6503 6505 6507 6412 6416 6381 6381 6381
No. 3, male. Time of birth, V 30, 19ʰ35ᵐ { Weight 2963 2927 2842 2729 2736 2835 2821 2849 2835 2913 2927
{ Ch. girth 33 32.25 31 31 32 32.5 32 31 31 32.5 32.5
{ Body-length 50 50.5 49 49 49.25 49.5 49.5 50 50 50 50.25
{ Rel. ch. girth 6386 6327 6327 6498 6566 6465 6200 6200 6500 6468
No. 4, male. Time of birth, V 30, 13ʰ00ᵐ { Weight 3558 3487 3303 3154 3204 3303 3359 3409 3416 3473 3494
{ Ch. girth 34 34 33.5 33.25 34 33.5 34 34 34 34 34.5
{ Body-length 52 51 50 50 51.75 51.5 51.5 51.25 51.25 51.5 51.5
{ Rel. ch. girth 6667 6701 6650 6570 6505 6602 6634 6634 6602 6699
No. 5, male. Time of birth, VI 1, 3ʰ00ᵐ { Weight 3005 3305 2913 2856 2892 2906 2991 3069 3104 3125 3147
{ Ch. girth 32 31 31 31 32 32 31 32 33 33 32
{ Body-length 52 51 51 50.75 51 51 51.25 51.5 52 52 51.25
{ Rel. ch. girth 6078 6078 6108 6275 6275 6079 6214 6346 6346 6244
No. 6, male. Time of birth, VI 1, 12ʰ45ᵐ { Weight 3019 2913 2877 2750 2863 2828 2927 2849 2906 2962 2977
{ Ch. girth 32.5 31.75 31.25 31.75 31.75 32 32 32 32 31.5 32
{ Body-length 49 49 49.25 49.25 49.25 48.75 49 50 50 50.5 50.5
{ Rel. ch. girth 6480 6345 6447 6414 6564 6530 6400 6400 6238 6337
No. 7, male. Time of birth, VI 1, 23ʰ00ᵐ { Weight 3175 3147 3005 2962 2892 2906 2941 2984 2969 3012 3026
{ Ch. girth 33 32.5 32 32 31 31.5 32 32 32 32 32
{ Body-length 50 51.25 50.75 50.75 51 51 51 51.75 51.75 51.75 52.75
{ Rel. ch. girth 6342 6305 6305 6078 6177 6275 6184 6184 6184 6184
No. 8, female. Time of birth, VI 3, 22ʰ00ᵐ { Weight 2835 2750 2679 2587 2587 2629 2651 2672 2693 2750 2722
{ Ch. girth 31.5 32.5 31 31 31 31 31 30 31 31 31
{ Body-length 50 48.75 48.75 49 49 49.5 49.5 49.5 49.5 50 49.5
{ Rel. ch. girth 6667 6359 6327 6327 6263 6263 6060 6263 6200 6263
No. 9, male. Time of birth, VI 5, 23ʰ00ᵐ { Weight 3657 3657 3572 3381 3366 3473 3487 3544 3544 3565 3536
{ Ch. girth 33 33.5 33 33 33.5 33.5 33.5 33 33 33.5 33.5
{ Body-length 53 53 52.5 53.5 53.5 53.5 53.5 54 54 54.5 53.75
{ Rel. ch. girth 6321 6286 6168 6262 6262 6262 6111 6111 6147 6233
No. 10, male. Time of birth, VI 6. 7ʰ00ᵐ { Weight 3232 3118 2948 2821 2814 2835 2849 2870 2877 2948 2941
{ Ch. girth 32 34 31 31 31 31 31.5 31.5 31.5 31.5 31.5
{ Body-length 52 51.25 50 51.5 51.5 51.5 51.5 51.5 51.5 52 52
{ Rel. ch. girth 6244 6800 6019 6019 6019 6019 6117 6117 6058 6058
No. 11, female. Time of birth, VI 5, 17ʰ00ᵐ { Weight 3303 3175 3076 2962 2934 2955 2962 3033 3059 3033 2984
{ Ch. girth 34 34 34 33 33 32.5 32.5 32.5 32.5 32.5 33
{ Body-length 52 50.25 50 50 50 50 50 50.25 50.25 50.25 50.75
{ Rel. ch. girth 6766 6800 6600 6600 6500 6500 6467 6467 6467 6503
Total relative chest-girth 710483 711435 699448 698260 697994 699232 692119 697300 695178 696529
Average relative chest-girth × 1.037 661 670 671 659 658 658 659 652 657 655 655
It may be well to consider briefly, necessarily somewhat speculatively, the significance of this ontogenetic change in build. First of all, the high relative chest circumference of infancy is due chiefly to the extremely short legs of the infant. Leg-length constitutes only about 40 per cent of stature at birth, whereas it comes to constitute 53 to 55 per cent at maturity. Consequently, the relative leg-length at infancy is only a trifle more than 70 per cent of the adult relative leg-length. Likewise the leg-length of the gorilla is about 70 per cent that of a European man (German, cf. Martin, 1914, p. 308). Consequently the relative leg-length of the infant, at birth, is to that of the adult as the relative leg-length of an anthropoid ape is to the relative leg-length of man. Incidentally, it may be added that the relative length of the arm of the infant is only slightly (8 per cent) less than that of the adult, while in the chimpanzee the relative arm-length is 18 per cent greater than that of man.
We have seen that the relative leg-length of the boy increases to about 12 years and thereafter diminishes to the period of completed growth. The white man has his greatest leg-length shortly before adolescence. We find that among the races of mankind it is the long-legged negro tribes of East Africa, especially the upper Nile (Johnston, 1906. II, p. 932), which are among the lowest races of mankind, and which seem to represent in the adult the physical stage through which the white boy passes at 12 years. Other African tribes have, indeed, relatively shorter legs and thus show a persisting adult stage that is either slightly younger or slightly older than that of the 12-year-old white boy.
Figure 1 (to return to it after this digression) seems thus adequately to measure the varying build of humans from birth to past maturity. It may, indeed, be regarded as composed of two parts: first, that from birth to the cessation of growth in stature, and second, that beyond cessation of growth in stature.
The curve of build thus obtained is, apart from the first period of adjustment that follows birth, a smoothly flowing one, that might indeed be expressed by a formula
y = ax + bx² + cx³ + dx⁴, etc.
The curve of build of figure 1 seems to be new in this form. It is, however, of the same general shape as the curve of varying “Körperfülle” drawn by Martin (1914, p. 246) from Quetelet’s data and based on the relation of weight ÷ stature³. The numbers of children considered in Martin’s figure are inadequate and there is hardly sufficient justification for the use of this formula to express changes of build during ontogeny.
The ontogenetic curve of build may serve as a graphic representation of the stages of development as listed by Stratz (1922). These stages are shown in table 5.
Table 5.—Growth-periods in children.
[Modified from C. W. Stratz, 1922, p. 87.]
Year of age. First (neutral) child age.
0 to 1 Infancy. Lactation.
1 to 2 } First period of filling out.
2 3 }
3 4 }
4 5 } First stretching.
5 6 }
6 7 }
Second (bisexual) child age. Youth.
Boys. Girls.
7 to 8 } Second period of filling out. Second period of filling out (rounding of hips and legs).
8 9 }
9 10 }
10 11 } Second stretching (shooting up in stature). Change of voice. Second stretching (shooting up in stature). Menstruation; beginning breast development.
11 12 }
12 13 }
13 14 }
14 15 }
15 16 } Third period of filling out (broadening of chest; rapid increase in weight). Maturity. Third period of fullness (rapid increase in weight). Maturity.
16 17 }
17 18 }
18 19 }
19 20 }
Later Ontogenetic Changes in Individual Build.
Any investigation of the heredity of build is apt to meet with the difficulty that only the present weights and statures of children, parents, and grandparents are known; that the persons are of different ages and hence the data concerning them are not precisely comparable. Even if we exclude from consideration children of the rapid developmental period, under 18 years of age, still we have the problem of individual change of build in mature life. Since stature is practically immutable at this period, change in build may be measured by change in weight. That change in weight does occur is notorious. Figures 3 to 6 illustrate graphically the changes in weight in various individuals from records taken almost at random. In figure 3 the curves of increasing weight run rapidly upward; in figure 4 they go up and then fall again; in figure 6 they are more nearly horizontal.
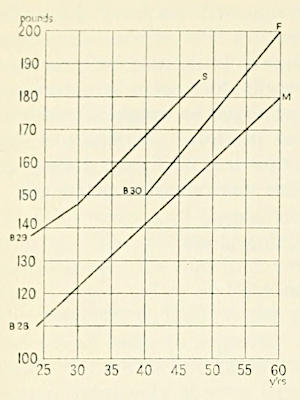
Fig. 3.—Changes in weight from 25 to 50 or 60 years of father (F), mother (M), and son (S) in D: Bol-1 family, showing a consistent history of rapid increase of build with age.
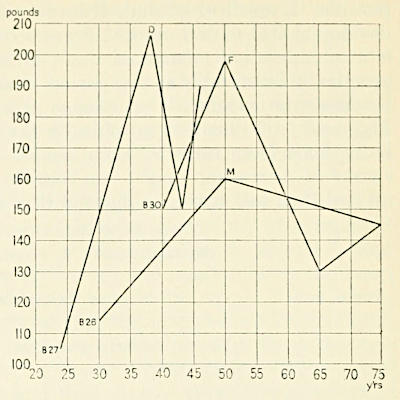
Fig. 4.—Changes in weight from 25 (or 40) years to 45 (or 75) years of father (F), mother (M), and daughter (D) in D: Bol-1a family, showing a history of fluctuating build.
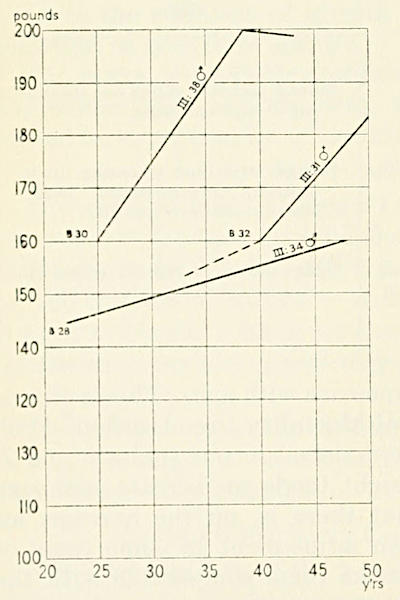
Fig. 5.—Changes in weight from 25 to 45 years of 3 sibs belonging to the D: Hay-1 family, showing a slight tendency to increase with age.
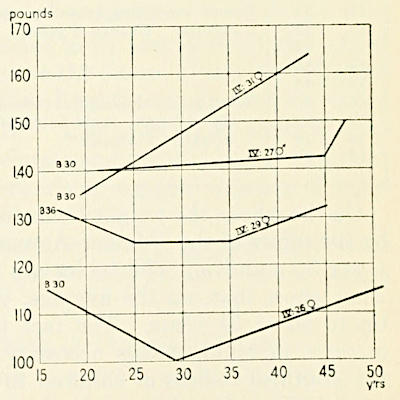
Fig. 6.—Changes in weight from 15 to 50 years in 4 sibs of the D: Ban-1 family, showing no great tendency to change of build during life.
On the whole, the weight tends to increase with age. This is shown by the tables of the “Medico-Actuarial Mortality Investigation” (vol. 1, pp. 38 and 67). The tables are reproduced in our tables 6 and 7. They show that, on the average, weight tends to increase with age up to 50 or 51 years. The fact that there is, on the average, an increase in build, makes necessary an adjustment in some cases of the youthful indices of children to make them comparable with the adult indices of their parents.
The adjustment was made to the weight of the child by finding in the appropriate column of stature and line of age the expected weight and adding the difference between this weight and the weight in the same column opposite the mid-parental age to the given weight of the child.
Table 6.—Graded average weight of men of different statures at various ages.
[Copied from Table IV of “Medico-actuarial mortality investigations.”]
Age, years. 5 feet. 5 feet 1 inch. 5 feet 2 inches. 5 feet 3 inches. 5 feet 4 inches. 5 feet 5 inches. 5 feet 6 inches. 5 feet 7 inches. 5 feet 8 inches. 5 feet 9 inches. 5 feet 10 inches. 5 feet 11 inches. 6 feet. 6 feet 1 inch. 6 feet 2 inches. 6 feet 3 inches. 6 feet 4 inches. 6 feet 5 inches.
15 107 109 112 115 118 122 126 130 134 138 142 147 152 157 162 167 172 177
16 109 111 114 117 120 124 128 132 136 140 144 149 154 159 164 169 174 179
17 111 113 116 119 122 126 130 134 138 142 146 151 156 161 166 171 176 181
18 113 115 118 121 124 128 132 136 140 144 148 153 158 163 168 173 178 183
19 115 117 120 123 126 130 134 138 142 146 150 155 160 165 170 175 180 185
20 117 119 122 125 128 132 136 140 144 148 152 156 161 166 171 176 181 186
21 118 120 123 126 130 134 138 141 145 149 153 157 162 167 172 177 182 187
22 119 121 124 127 131 135 139 142 146 150 154 158 163 168 173 178 183 188
23 120 122 125 128 132 136 140 143 147 151 155 159 164 169 175 180 185 190
24 121 123 126 129 133 137 141 144 148 152 156 160 165 171 177 182 187 192
25 122 124 126 129 133 137 141 145 149 153 157 162 167 173 179 184 189 194
26 123 125 127 130 134 138 142 146 150 154 158 163 168 174 180 186 191 196
27 124 126 128 131 134 138 142 146 150 154 158 163 169 175 181 187 192 197
28 125 127 129 132 135 139 143 147 151 155 159 164 170 176 182 188 193 198
29 126 128 130 133 136 140 144 148 152 156 160 165 171 177 183 189 194 199
30 126 128 130 133 136 140 144 148 152 156 161 166 172 178 184 190 196 201
31 127 129 131 134 137 141 145 149 153 157 162 167 173 179 185 191 197 202
32 127 129 131 134 137 141 145 149 154 158 163 168 174 180 185 192 198 203
33 127 129 131 134 137 141 145 149 154 159 164 169 175 181 187 193 199 204
34 128 130 132 135 138 142 146 150 155 160 165 170 176 182 188 194 200 206
35 128 130 132 135 138 142 146 150 155 160 165 170 176 182 189 195 201 207
36 129 131 133 136 139 143 147 151 156 161 166 171 177 183 190 196 202 208
37 129 131 133 136 140 144 148 152 157 162 167 172 178 184 191 197 203 209
38 130 132 134 137 140 144 148 152 157 162 167 173 179 185 192 198 204 210
39 130 132 134 137 140 144 148 152 157 162 167 173 179 185 192 199 205 211
40 131 133 135 138 141 145 149 153 158 163 168 174 180 186 193 200 206 212
41 131 133 135 138 141 145 149 153 158 163 168 174 180 186 193 200 207 213
42 132 134 136 139 142 146 150 154 159 164 169 175 181 187 194 201 208 214
43 132 134 136 139 142 146 150 154 159 164 169 175 181 187 194 201 208 214
44 133 135 137 140 143 147 151 155 160 165 170 176 182 188 195 202 209 215
45 133 135 137 140 143 147 151 155 160 165 170 176 182 188 195 202 209 215
46 134 136 138 141 144 148 152 156 161 166 171 177 183 189 196 203 210 216
47 134 136 138 141 144 148 152 156 161 166 171 177 183 190 197 204 211 217
48 134 136 138 141 144 148 152 156 161 166 171 177 183 190 197 204 211 217
49 134 136 138 141 144 148 152 156 161 166 171 177 183 190 197 204 211 217
50 134 136 138 141 144 148 152 156 161 166 171 177 183 190 197 204 211 217
51 135 137 139 142 145 149 153 157 162 167 172 178 184 191 198 205 212 218
52 135 137 139 142 145 149 153 157 162 167 172 178 184 191 198 205 212 218
53 135 137 139 142 145 149 153 157 162 167 172 178 184 191 198 205 212 218
54 135 137 139 142 145 149 153 158 163 168 173 178 184 191 198 205 212 219
55 and up 135 137 139 142 145 149 153 158 163 168 173 178 184 191 198 205 212 219
Table 7.—-Graded average weight of women of different statures at various ages.
[Copied from Table IX of “Medico-actuarial mortality investigations.”]
Age, years. 4 feet 8 inches. 4 feet 9 inches. 4 feet 10 inches. 4 feet 11 inches. 5 feet. 5 feet 1 inch. 5 feet 2 inches. 5 feet 3 inches. 5 feet 4 inches. 5 feet 5 inches. 5 feet 6 inches. 5 feet 7 inches. 5 feet 8 inches. 5 feet 9 inches. 5 feet 10 inches. 5 feet 11 inches. 6 feet.
15 101 103 105 106 107 109 112 115 118 122 126 130 134 138 142 147 152
16 102 104 106 117 120 124 128 132 136 140 144 149 154 159 164 174 179
17 103 105 107 109 111 113 116 119 122 125 129 133 137 140 144 149 154
18 104 106 108 110 112 114 117 120 123 126 130 134 138 142 145 150 155
19 105 107 109 111 113 115 118 121 124 127 131 135 139 142 146 151 155
20 106 108 110 112 114 116 119 122 125 128 132 136 140 143 147 151 156
21 107 109 111 113 115 117 120 123 126 129 133 137 141 144 148 152 156
22 107 109 111 113 115 117 120 123 126 129 133 137 141 145 149 153 157
23 108 110 112 114 116 118 121 124 127 130 134 138 142 146 150 153 157
24 109 111 113 115 117 119 121 124 127 130 134 138 142 146 150 154 158
25 109 111 113 115 117 119 121 124 128 131 135 139 143 147 151 154 158
26 110 112 114 116 118 120 122 125 128 131 135 139 143 147 151 155 159
27 110 112 114 116 118 120 122 125 129 132 136 140 144 148 152 155 159
28 111 113 115 117 119 121 123 126 130 133 137 141 145 149 153 156 160
29 111 113 115 117 119 121 123 126 130 133 137 141 145 149 153 156 160
30 112 114 116 118 120 122 124 127 131 134 138 142 146 150 154 157 161
31 113 115 117 119 121 123 125 128 132 135 139 143 147 151 154 157 161
32 113 115 117 119 121 123 125 128 132 136 140 144 148 152 155 158 162
33 114 116 118 120 122 124 126 129 133 137 141 145 149 153 156 159 162
34 115 117 119 121 123 125 127 130 134 138 142 146 150 154 157 160 163
35 115 117 119 121 123 125 127 130 134 138 142 146 150 154 157 160 163
36 116 118 120 122 124 126 128 131 135 139 143 147 151 155 158 161 164
37 116 118 120 122 124 126 129 132 136 140 144 148 152 156 159 162 165
38 117 119 121 123 125 127 130 133 137 141 145 149 153 157 160 163 166
39 118 120 122 124 126 128 131 134 138 142 146 150 154 158 161 164 167
40 119 121 123 125 127 129 132 135 138 142 146 150 154 158 161 164 167
41 120 122 124 126 128 130 133 136 139 143 147 151 155 159 162 165 168
42 120 122 124 126 128 130 133 136 139 143 147 151 155 159 162 166 169
43 121 123 125 127 129 131 134 137 140 144 148 152 156 160 163 167 170
44 122 124 126 128 130 132 133 138 141 145 149 153 157 161 164 168 171
45 122 124 126 128 130 132 135 138 141 145 149 153 157 161 164 168 171
46 123 125 127 129 131 133 136 139 142 146 150 154 158 162 165 169 172
47 123 125 127 129 131 133 136 139 142 146 151 155 159 163 166 170 173
48 124 126 128 130 132 134 137 140 143 147 152 156 160 164 187 171 174
49 124 126 128 130 132 134 137 140 143 147 152 156 161 165 168 172 175
50 125 127 129 131 133 135 138 141 149 148 152 156 161 165 169 173 176
51 125 127 129 131 133 135 138 141 144 148 152 157 162 166 170 174 177
52 125 127 129 131 133 135 138 141 144 148 152 157 162 166 170 174 177
53 125 127 129 131 133 135 138 141 144 148 152 157 162 166 170 174 177
54 125 127 129 131 133 135 138 141 144 148 153 158 163 167 171 174 177
55 125 127 129 131 133 135 138 141 144 148 153 158 163 167 171 174 177
Relation of Juvenile to Adult Build.
This adjustment was not always necessary, first, because in not a few cases the children were of an adult age and the data for the build of the parents, now dead, were given for the same age; second, examination of such developmental curves as are shown in figure 6 strongly indicates that when the parents are of slender build, and the children are of slender build at the age of 25 years younger than the parents, the increase in weight of the children will not usually follow the actuarial tables. The actuarial tables, indeed, represent only the average increase, and this average is made of a population that does not increase its weight at all when it grows older (fig. 6) and a population that increases its weight at a much faster rate than indicated in the actuarial tables (fig. 3). Consequently, no adjustment is made to the given weights of the children whose parents are slender. In the case where one parent was slender and one fat, the adjustment is still made in the build of all the children. This procedure, undoubtedly, introduces an error which, so far as I see, can not be avoided. Baldwin (1921, p. 74) states that “as a general rule heavy children remain relatively heavy during the period studied”; and his developmental curves of individual children show that the same persistence of the juvenile build is commonly true for children of slight weight. It is striking how often the children of heavy parents will be heavy even in youth, and conversely, children of exceptionally great weight are apt to retain, and add to, their build.
Chambers (1850, pp. 139-143) cites the following cases of early familial obesity: A boy of 3 years weighs 39.5 kg. (87 pounds); his 6 sisters and brothers are obese. A girl of 5 years 5 months weighs 89 kg. (196 pounds); obesity on both sides of the house. A boy of 16 weighs 114 kg. (252 pounds); there is collateral heredity.
A striking case of early obesity persisting to maturity is that of Miss Allen (plate 8).
On the other hand, it is often strikingly true that in families with a tendency to fleshy build some of the children will remain slender until 20 or 25 years and then begin to grow fat. The metabolic changes that induce fatness first appear in later life.