Chapter I · Exploring the Sky
Reading edition
We have seen how man, after inhabiting the earth for 300,000 years, has within the last 300 years—the last one-thousandth part of his life on earth—become possessed of an optical means of studying the outer universe. In the present chapter we shall try to describe the impressions he has formed with his newly-awakened eyes. The description will be arranged in a very rough chronological order. This is also an order of increasing telescopic power, or again of seeing further and further into space, so that our order of arrangement might equally be described as one of increasing distance from the sun. We shall not attempt any sort of continuous record, but shall merely mention a few landmarks so as to shew in broad outline the order in which territory was won and consolidated in man’s survey of the universe.
THE SOLAR SYSTEM
We may conveniently start with the solar system, the structure of which was unravelled by Galileo and his successors.
The sun’s family of planets falls naturally into distinct groups. Near to the sun are the four small planets, Mercury, Venus, the Earth and Mars. At much greater distances are the four great planets, Jupiter, Saturn, Uranus and Neptune. Beyond all these is the newly discovered planet Pluto, the outermost member of our system so far known.
Mercury is nearest of all to the sun; next comes Venus. The orbits of these two planets lie between the earth’s orbit and the sun. As seen from the earth, these planets appear to describe relatively small circles round the sun, and so must necessarily appear near to the sun in the sky. As a consequence, they can only be seen either in the early morning, if they happen to rise just before the sun, or in the evening if they set after the sun. The ancients not altogether recognising that the same planets could appear both as morning and evening stars, gave them different names according as they figured as the one or the other. As a morning star Venus was called Phosphoros by the Greeks and Lucifer by the Romans; as an evening star it was called Hesperus by both.
Next beyond the earth, proceeding outward from the sun into space, comes Mars, completing the group of small planets. Mars, Venus and Mercury are all smaller than the earth in size, although Venus is only slightly so.
There is a wide gap between the orbit of Mars, the last of the small planets, and that of Jupiter, the first of the great planets. This is not empty; it is occupied by the orbits of thousands of tiny planets known as asteroids. None of these approaches the earth in size; Ceres, the largest, is only 480 miles in diameter, and only four are known with diameters of more than 100 miles. The planets Mercury, Venus and Mars have all been known from remote antiquity, but the asteroids only entered astronomy with the nineteenth-century, Ceres, the first and largest, having been discovered by Piazzi on January 1, 1801.
Beyond the asteroids come the four great planets Jupiter, Saturn, Uranus and Neptune, all of which are far larger than the earth. Jupiter, the largest, has, according to Sampson, a diameter of 88,640 miles, or more than eleven times the diameter of the earth; fourteen hundred bodies of the size of the earth could be packed inside Jupiter, and leave room to spare. Saturn, which comes next in order, is second only to Jupiter in size, having a diameter of about 70,000 miles. These two are by far the largest of the planets.
Uranus and Neptune have each about four times the diameter, and so about sixty-four times the volume, of the earth. The size of Pluto is not yet known with accuracy, but it can hardly be larger than the earth and is probably considerably smaller.
Jupiter and Saturn form such conspicuous objects in the sky that they have necessarily been known from the earliest times, but Uranus and Neptune are comparatively recent discoveries. Sir William Herschel discovered Uranus quite accidentally in 1781, while looking through his telescope with no motive other than the hope of finding something interesting in the sky. By contrast, Neptune was discovered in 1846 as the result of intricate mathematical calculations, which many at the time regarded as the greatest triumph of the human mind, at any rate since the time of Newton. It was a triumph of youth. The honour must be apportioned in approximately equal shares between an Englishman, John Couch Adams, then only 27 years old, who was afterwards Professor of Astronomy at Cambridge, and a young French astronomer, Urbain J. J. Leverrier, who was only eight years his senior. Both attributed certain vagaries in the observed motion of Uranus to the gravitational pull of an exterior planet, and both set to work to calculate the orbit in which this supposed outer planet must move to explain these vagaries.
Adams finished his calculations first, and informed observers at Cambridge as to the part of the sky in which the new planet ought to lie. As a result, Neptune was observed twice, although without being immediately identified as the wanted planet. Before this identification had been established at Cambridge, Leverrier had finished his computations and communicated his results to Galle, an assistant at Berlin, who was able to identify the planet at once, Berlin possessing better star-charts of the region of the sky in question than were accessible at Cambridge.
Gradually it emerged that the gravitational pull of Neptune was inadequate to account for all the vagaries in the motions of Uranus, while similar vagaries began to appear in Neptune’s own motion. This pointed to the existence of yet another planet, further out even than Neptune. Just as Adams and Leverrier had done on the former occasion, so Dr Percival Lowell, of Flagstaff Observatory, Arizona, computed the orbit in which the conjectured new planet, “Planet X,” ought to move, but it was only recently (March 1930), after many years of careful search, that the Flagstaff observers discovered the planet Pluto, moving in almost precisely the orbit which Lowell had predicted fifteen years previously.
As far back as 1772, Bode had pointed out a simple numerical relation connecting the distances of the various planets from the sun. This is obtained as follows: Write first the series of numbers
0 1 2 4 8 16 32 64 128 256
in which each number after the first two is double the preceding. Multiply each by three, thus obtaining
0 3 6 12 24 48 96 192 384 768
and add four to each, giving
4 7 10 16 28 52 100 196 388 772
These numbers are very approximately proportional to the actual distances of the planets from the sun, which are (taking the earth’s distance to be 10):
Mercury 3·9
Venus 7·2
Earth 10·0
Mars 15·2
Asteroids 26·5
Jupiter 52·0
Saturn 95·4
Uranus 191·9
Neptune 300·7
Pluto 400
The law was enunciated before Uranus and the asteroids had been discovered, so that it is somewhat remarkable that these fit so well into their predicted places. On the other hand, the law fails completely for Neptune and the newly discovered Pluto, so that it seems more than likely that it is a mere coincidence with no underlying rational explanation.
The outermost planets are at enormous distances from the sun. An inhabitant of Pluto, if such existed, would receive only a sixteen-hundredth part as much light and heat from the sun as an inhabitant of the earth receives. It can be calculated that if Pluto’s surface were warmed only by the heat of the sun, it would be at a very low temperature indeed, somewhere in the neighbourhood of -230° Centigrade, or more than 400 degrees of frost on the Fahrenheit scale.
A telescope collects heat as well as light. Not only is the heat-gathering power of a large telescope tremendous, but extremely sensitive instruments have been designed to measure this heat. The 100-inch telescope at Mount Wilson is said to be capable of detecting the heat received from a single candle on the banks of the Mississippi, 2000 miles away. This great sensitiveness has made it possible to measure the infinitesimal amounts of heat received from single stars and planets, and so to estimate the temperatures of their surfaces. Recent measurements indicate that the surface of Jupiter is at a temperature of about -150° Centigrade, which is just about that at which it would be maintained by the sun’s heat alone. On the other hand similar measurements assign temperatures of -150° and -170° respectively to Saturn and Uranus, both of which are rather higher than would be expected if these planets had no source of heat beyond the sun’s radiation. But it seems clear that any sources of internal heat must be quite small, and that all the major planets are very cold indeed. There can be neither seas nor rivers on their surfaces, since all water must be frozen into ice, neither can there be rain or water-vapour in their atmospheres. It has been suggested that the clouds which obscure our view of Jupiter’s surface may be condensed particles of carbon-dioxide, or some other gas which boils at temperatures far below the freezing point of water.
The physical conditions of the smaller planets are much more like those with which we are familiar on earth. Owing to its greater distance from the sun, Mars is somewhat, but not enormously, colder than the earth. Its day of 24 hours 37 minutes is only slightly longer than our own, so that its surface must experience alternations of warmth by day and cold by night similar to those we find on earth. In the equatorial regions the temperature rises well above the freezing point at noon, occasionally reaching 50° Fahrenheit or even more. But even here it falls below freezing some time before sunset, and from then until well on in the next day, the climate must be very cold. The polar regions are of course colder still, the temperature of the snowcap which covers the poles being somewhere about -70° Centigrade or -94° Fahrenheit—126 degrees of frost!
Venus, being nearer the sun, must have a higher average temperature than the earth. But as each of its days and nights is several days of our terrestrial time, the difference between the temperatures of day and night must be far greater than with us, so that its surface must experience great extremes of heat by day and of cold by night. The night temperature appears to be fairly uniformly equal to about -25° Centigrade or -13° Fahrenheit. At any point on the planet’s surface weeks of this bitterly cold night temperature must alternate with weeks of a roasting day temperature.
Mercury is so near the sun that its average temperature is necessarily far higher than that of the earth. It reflects only a tiny fraction—about a fourteenth—of the light and heat it receives from the sun. All the rest goes to heating up its surface. A number of considerations make it likely that the planet always turns the same face to the sun, just as the moon always turns the same face to the earth. If so the unwarmed half of its surface must be intensely cold, and the warmed half intensely hot. It can be calculated that in this case the warmed hemisphere ought to have a temperature of about 357° Centigrade; if however the planet was in fairly rapid rotation, its whole surface would have a temperature of only about 170° Centigrade. Quite recently Pettit and Nicholson have measured the amount of heat received on earth from the warmed hemisphere, and find that its temperature must be about 350° Centigrade or 662° Fahrenheit, thus confirming that the planet always turns the same face to the sun. Its warm hemisphere is at a temperature which melts lead; the other hemisphere, eternally dark and unwarmed, is probably colder than anything we can imagine.
PLATE I
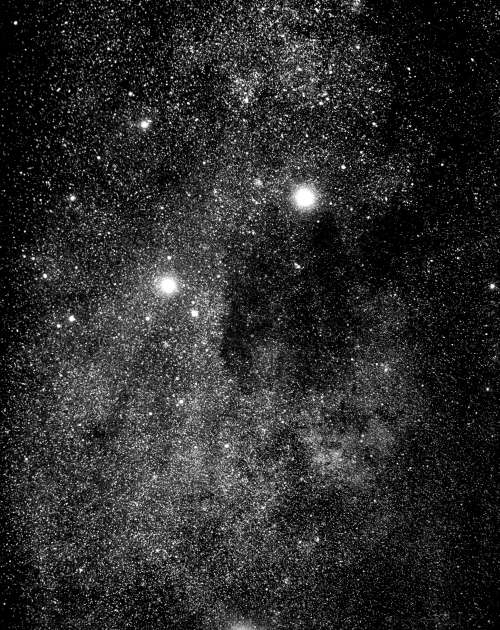
Franklin-Adams Chart
The Milky Way in the neighbourhood of the Southern Cross
Galileo’s discovery of the four satellites of Jupiter was followed in time by the discovery that every planet was attended by satellites, except the two whose orbits lay inside the earth’s. In 1655 Huyghens discovered Titan, the largest of Saturn’s satellites, and by 1684 Cassini had discovered four more. Then, after the lapse of a full century, Sir William Herschel discovered two satellites of Uranus in 1787 and two more satellites of Saturn in 1789. We shall discuss the full system of planetary satellites and also the smaller bodies of the solar system—comets, meteors and shooting-stars—in a later chapter, when we come to deal with the way they came into being.
THE GALACTIC SYSTEM
Our next landmark is the survey of the stars by the two Herschels, Sir William Herschel, the father (1738-1822) and Sir John Herschel, the son (1792-1871). What Galileo had done for the solar system, the two Herschels set out to do for the huge family of stars—the “galactic” system, bounded by the Milky Way—of which our sun is a member.
On a clear moonless night the Milky Way is seen to stretch, like a great arch of faint light, from horizon to horizon. It is found to be only part of a full circle of light—the galactic circle—which stretches completely round the earth and divides the sky into two equal halves, forming a sort of celestial “equator,” with reference to which astronomers are accustomed to measure latitude and longitude in the sky. Galileo’s telescope had shewn that it consists of a crowd of faint stars, each too dim to be seen individually without telescopic aid (see Plate I). And, as might be expected, the proper interpretation of this great belt of faint stars has proved to be fundamental in understanding the architecture of the universe.
If stars were scattered uniformly through infinite space, we should at last come to a star in whatever direction we looked, so that the sky would appear as a uniform blaze of intolerable light. It is true that this would not be the case if light were dimmed or blotted out after travelling a certain distance, but even then, the sky would appear the same in all directions, for there would be no reason why one part of the sky should be more lavishly spangled with stars than another. Thus the existence of the Milky Way shews that the system of the stars does not extend uniformly to infinity. It must have a definite structure, and it was the architecture of this that Sir William Herschel set himself to unravel. The work he did for the northern half of the sky was subsequently extended to the southern hemisphere by his son, Sir John Herschel.
We shall best understand the method employed by the Herschels if we first imagine all the stars in the sky to be intrinsically similar objects. Each would then emit the same amount of light, so that the nearer stars would appear bright, and the further stars faint, merely as an effect of distance. The way in which apparent brightness decreases with distance is of course well known; the law is that of the “inverse square of the distance,” which means that the apparent brightness decreases just as rapidly as the square of its distance increases; a star which is twice as distant as a second similar star appears only a quarter as bright, and so on. Thus if all stars emitted the same amount of light, we could estimate the relative distances of any two stars in the sky from their relative brightnesses. By cutting wires of lengths proportional to the distances of various stars, and pointing these in the directions of the stars to which they referred, we could form a model of the arrangement of the stars in the sky. We should, in fact, know the whole structure of the system of stars except for its scale. To represent the faint stars of the Milky Way, a great number of very long wires would be needed. In the model these would all point towards different parts of the Milky Way, forming a flat wheel-like structure.
The problem which confronted Sir William Herschel was more intricate because he knew that the stars were of different intrinsic brightness as well as at different distances, and both factors combined to produce differences of apparent brightness. One of the main difficulties of astronomy, both to the Herschels and to the astronomer of to-day, is that these two factors have to be disentangled before any definite conclusions are reached.
Herschel found that the number of stars visible in his telescope-field varied enormously with different directions in space. It was of course greatest when the telescope was pointed at the Milky Way, and fell off, steadily and rapidly, as the telescope was moved away from the Milky Way. Generally speaking, two telescope-fields which were at equal distances from the Milky Way contained about the same number of stars. In the technical language of astronomy, the richness of the star-field depended mainly on the galactic latitude, just as the earth’s climate depends mainly on the geographic latitude, and not to any great extent on the longitude.
Fields at different distances from the Milky Way were found to differ in quality as well as in number of stars. The brightest stars of all occurred about equally in all fields, the difference in the fields resulting mainly from faint stars, and particularly the faintest stars of all, becoming enormously more abundant as the Milky Way was approached.
Sir William Herschel rightly interpreted this as shewing that the system of stars surrounding the sun began to thin out within distances reached by his telescope, and that they began to thin out soonest in directions furthest away from the Milky Way. He supposed the general shape of the galactic system of stars to be that of a bun or a biscuit or a watch, the stars being most thickly scattered near the centre, and occurring more sparsely in the outer regions. The plane of the Milky Way of course formed the central plane of the structure. The fact that the Milky Way divides the sky into two almost exactly equal halves suggested to him that the sun must be very nearly in this central plane, and this is confirmed by the recent very refined investigations of Seares and van Rhijn, and others. From the fact that parts of the sky which were equidistant from the Milky Way appeared about equally bright, Herschel inferred that the sun not only lay in the central plane of the system, but was very near to its actual centre. This view has prevailed until quite recently, but the researches of Shapley and others now shew it to be untenable (see p. 65 below).
Fig. 1 shews a cross-section of the general kind of structure which Sir William Herschel assigned to the galactic system, although the detailed distribution of stars shewn in the diagram is that given at a much later date (1922) by Kapteyn. It is easy to see how a structure of this type would account for the general appearance of the sky. Those stars which appear brightest of all are, generally speaking, the nearest; they are so near that no appreciable thinning out of stars occurs within this distance. For this reason the very bright stars occur in about equal numbers in all directions. The stars which appear very faint are mostly very distant, so distant that the great depth of the system in directions in or near to the galactic plane is brought into play. In such directions, layer after layer of stars, ranged almost endlessly one behind the other, give rise to the apparent concentration of faint stars which we call the Milky Way.
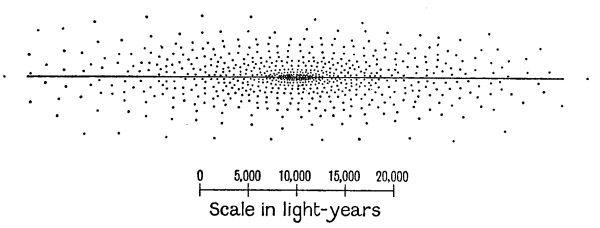
Fig. 1. The Structure of the Galactic System according to Herschel and Kapteyn.
The final acceptance of the Copernican view of the structure of the solar system was in a large measure due to Galileo’s discovery of the similar system of Jupiter, which was so situated in space that a terrestrial observer could obtain a bird’s-eye view of it as a whole. We can never obtain a bird’s-eye view of the solar system as a whole because we can only see it from inside, so that optical proof that such systems could exist, could come only from the discovery of other similar systems, which we could see from outside.
Sir William Herschel believed he had confirmed his own view of the structure of the galactic system in the same way, by discovering similar systems, of which he could obtain a bird’s-eye view because they were entirely extraneous to the galaxy. He spoke of these objects as “island universes” and believed them to be clouds of stars. They were of hazy nebular appearance, and although it was impossible to distinguish the separate stars in them, he believed that sufficient telescopic power would make this possible, just as it had enabled Galileo to see the separate stars in the Milky Way. These objects, which we shall describe almost immediately, are generally known as “extra-galactic nebulae“ from their position, although we shall frequently find it convenient to use the briefer term “great nebulae,” to which their immense size fully entitles them.
NEBULAE
A telescope exhibits a planet as a disc of appreciable size, and an eye-piece which magnifies 60 times will make Jupiter look as large as the moon. Yet an eye-piece which magnifies 60 times, or any greater number of times, can never make a star look as large as the moon. No magnification within our command causes any star to appear as anything other than a mere point of light. The stars are of course enormously larger than Jupiter, but they are also enormously more distant, and it is the distance that wins.
PLATE II
N.G.C. 2022
N.G.C. 6720
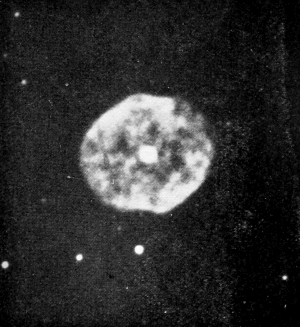
N.G.C. 1501
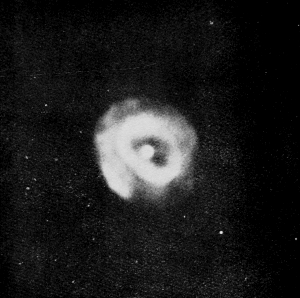
N.G.C. 7662
Mt Wilson Observatory
Planetary Nebulae
PLATE III
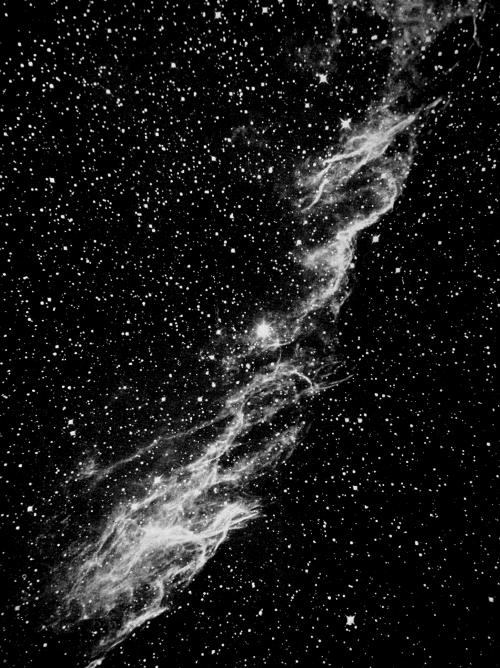
Mt Wilson Observatory
The Nebula in Cygnus
The telescope nevertheless shews a number of objects which appear bigger than mere points of light. They are generally of a faint, hazy appearance, and so have received the general name of “nebulae.” Detailed investigation has shewn that these fall into three distinct classes.
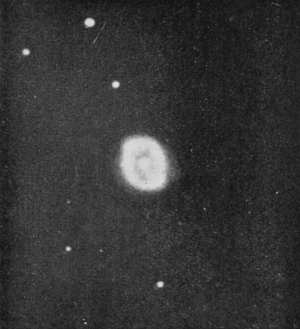
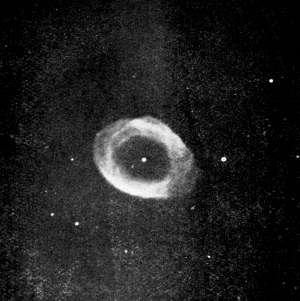
PLANETARY NEBULAE. The first class are generally described as “Planetary Nebulae.” There is nothing of a planetary nature about them beyond the fact that, like the planets, they shew as finite discs in a telescope. A few hundreds only of these objects are known, four typical examples being illustrated in Plate II. They all lie within the galactic system. We shall discuss their physical structure below (p. 321). For the moment, it is enough to say that they are probably of the nature of stars which have in some way become surrounded by luminous atmospheres of enormous extent. If so they of course disprove our general statement that no star ever appears as anything but a point of light in a telescope; we must make an exception in favour of the planetary nebulae.
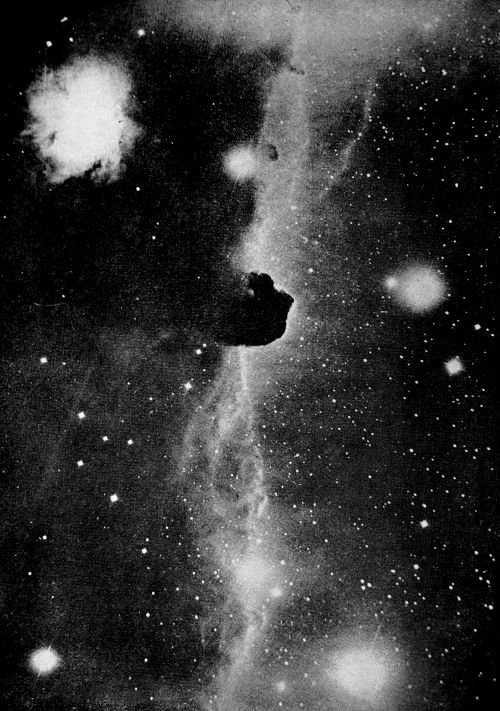
GALACTIC NEBULAE. The second class are generally described as “Galactic Nebulae,” examples being shewn in Plates III, VI (p. 37) and VII (p. 44). These are completely irregular in shape. Their general appearance is that of huge glowing wisps of gas stretching from star to star, and in effect this is pretty much what they are. Like the planetary nebulae, they lie entirely within the galactic system. Even a cursory glance shews that each irregular nebula contains several stars enmeshed with it; minute telescopic examination often extends the dimensions of the nebula almost indefinitely, so that we may have almost the whole of a constellation wrapped up in a single nebula.
There is but little doubt as to the physical nature of these nebulae. The space between the stars is not utterly void of matter, but is occupied by a thin cloud of gas of a tenuity which is generally almost beyond description. Here and there this cloud may be denser than usual; here and there again it may be lighted up and made to incandesce by the radiation of the stars within it. In other places it may be entirely opaque to light, lying like a black curtain across the sky. The variations of density, opacity and luminosity in combination produce all the fantastic shapes and varied degrees of light and shade we see in the galactic nebulae.
This same opacity is responsible for the dark patches which occur in the general arrangement of the stars. A conspicuous example occurs in the part of the Milky Way shewn in Plate I (p. 23). The dark patch, which looks at first like a hole in the system of stars, is graphically described as “The Coal Sack.” These black patches in the sky cannot represent actual holes, because it is inconceivable that there should be so many empty tunnels through the stars all pointing exactly earthward, so that we are compelled to interpret them as veils of obscuring matter which dim or extinguish the light of the stars behind them.
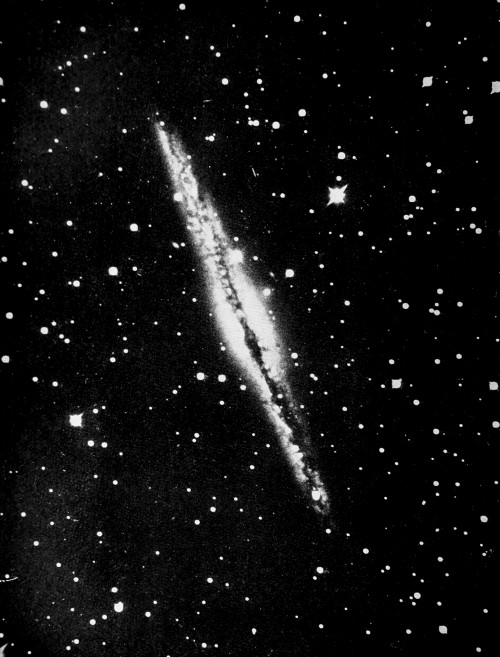
EXTRA-GALACTIC NEBULAE. The third class of nebula is of an altogether different nature. Its members are for the most part of definite and regular shape, and shew various other characteristics which make them easy of identification. They used to be called “white nebulae” from the quality of the light they emitted. Later Lord Rosse’s giant 6-foot telescope revealed that many of them had a spiral structure; these were called “spiral nebulae.” The most conspicuous of all the spiral nebulae is the Great Nebula M 31 in Andromeda, shewn in Plate IV, which is just, and only just, visible to the naked eye. Marius, observing it telescopically in 1612, described it as looking “like a candle-light seen through horn.” Plate V shews a second example, probably of very similar structure, which is viewed from another angle, so as to appear almost exactly edge-on.
PLATE IV
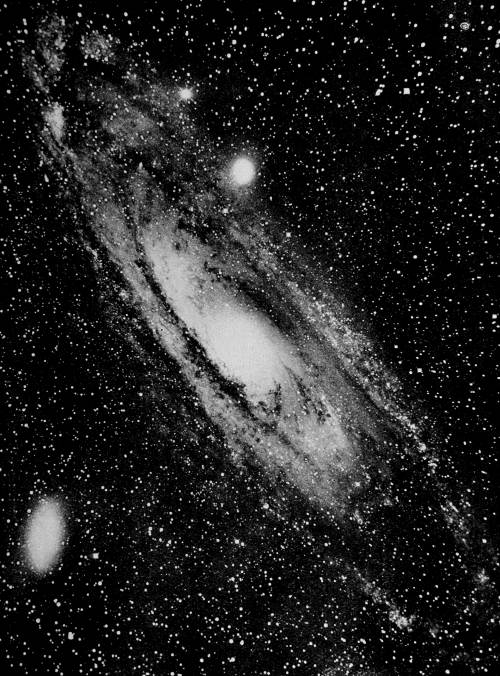
Yerkes Observatory
The Great Nebula M 31 in Andromeda
PLATE V
Mt Wilson Observatory
The Nebula N.G.C. 891 in Andromeda seen edge-on
It is now abundantly proved that nebulae of this type all lie outside the galactic system, so that the term “extra-galactic nebulae” adequately describes them. Their size is colossal. Either of the photographs shewn in Plates IV and V would have to be enlarged to the size of the whole of Europe before a body of the size of the earth became visible in it, even under a powerful microscope. Their general shape is similar to that which Sir William Herschel assigned to the galactic system, and it was this that originally led him to regard them as “island universes” similar to the galactic system. We shall see later how far his conjecture has been confirmed by recent research.
THE DISTANCES OF THE STARS
The year 1838 provides our next landmark; it is the year in which the distance of a star was first measured.
In the second century after Christ, Ptolemy had argued that if the earth moved in space, its position relative to the surrounding stars must continually change. As the earth swung round the sun, its inhabitants would be in the position of a child in a swing. And, just as the swinging child sees the nearer trees, persons and houses oscillating rhythmically against a remote background of distant hills and clouds, so the inhabitants of the earth ought to see the nearer stars continually changing their position against their background of more distant stars. Yet night after night the constellations remained the same, or so Ptolemy argued; the same stars circled eternally in the same relative positions around the pole, and conspicuous groups of stars such as the seven stars of the Great Bear, the Pleiades or the constellation of Orion shewed no signs of change. For aught the unaided human eye could tell, the stars might be spots of luminous paint on a canvas background, with the earth as the unmoving pivot around which the whole structure swung.
In opposition to this, the Copernican theory of course required that the nearer stars should be seen to move against the background of the more distant stars, as the earth performed its yearly journey round the sun. Yet year after year, and even century after century, passed without any such motion being detected. The old Ptolemaic contention that the earth formed the fixed centre of the universe might almost have regained its former position, had it not been that various lines of evidence had begun to shew that even the nearest stars were necessarily very distant, so distant, indeed, that their apparent want of motion need cause no surprise. The child in a swing cannot expect to have optical evidence of its motion if the nearest object it can see is twenty miles away.
Very few stars appear brighter than Saturn at its brightest; it looks about as bright as Altair, the eleventh brightest star in the sky. Yet Saturn shines only by the light it reflects from the sun, and its distance from the sun is such that it receives only about one part in 2500 million of the total light emitted by the sun. And, as the surface of Saturn only reflects back about two-fifths of the light it receives, it follows that Saturn shines with only a 6000 millionth part of the light of the sun. If, as Kepler and others had maintained, Altair was essentially similar to the sun, it would probably be of about the same candle-power as the sun, and so would give out about 6000 million times as much light as Saturn. The fact that Altair and Saturn appear about equally bright in the sky can only mean that Altair is 80,000 times as distant as Saturn[1]. This argument is essentially identical with one which Newton gave in his System of the World to shew that even the brightest stars, such as Altair, must be very distant indeed.
And such has proved to be the case. All efforts to discover the apparent swinging motion of the stars—“parallactic motion,” as it is technically called—which results from the earth’s orbital motion failed until 1838, when three astronomers, Bessel, Henderson, and Struve, almost simultaneously detected the parallactic motions of the three stars, 61 Cygni, α Centauri and α Lyrae respectively. The amount of their parallactic motion made it possible to calculate the distances of the stars, so that the inhabitants of the earth were not only placed in possession of definite ocular proof that they were swinging round the sun, but from the visible effects of this swing they were able to compute the distances of the nearer stars. The calculated values were not accurate when judged by modern standards, but they provided the first definite estimates of the scale on which the universe is built.
Let us pause for a minute to consider how this scale is built up. The first step is to select a convenient base-line a few miles in length on the surface of the earth, and to measure this in terms of standard yards or metres. Starting out from this base-line, a geodetic survey maps out a long narrow strip of the earth’s surface, preferably running due north and south. The difference of latitude at the two ends is then measured by astronomical methods, as for instance by noticing the difference in the altitude of the pole-star at the two places. As the length of the strip is already known in miles, this immediately gives the dimensions of the earth. According to Hayford (1909), the earth’s equatorial radius is 6378·388 kilometres, or 3963·34 miles, its polar radius being 6356·909 kilometres or 3949·99 miles.
The next step is to determine the size of the solar system in terms of that of the earth. When the sun is eclipsed by the moon, the time at which the moon first begins to cover the sun’s disc is different for different stations on the earth’s surface, and the observed differences of time enable us to measure the moon’s distance in terms of known distances on the surface of the earth. In this way the mean distance of the moon is found to be 384,403 kilometres or 238,857 miles. In the same way the transit of the planet Venus across the disc of the sun provides an opportunity for determining the scale of the solar system in terms of the dimensions of the earth. The asteroid Eros provides still better opportunities. The Paris Conference (1911) adopted 149,450,000 kilometres, or 92,870,000 miles, as the most likely value for the mean distance of the earth from the sun. The next and final step, which the year 1838 saw accomplished, is that of using the diameter of the earth’s orbit as base-line, and determining the distances of the stars.
The first step, from the standard yard or metre to the measured base-line on the earth’s surface, involves an increase of several thousand-fold in length. The increase involved in the next step, from the base-line to the earth’s diameter, is again one of thousands. And again the next step, from the diameter of the earth to that of the earth’s orbit, involves an increase of thousands. But the last step of all, from the earth’s orbit to stellar distances, involves a million-fold increase.
Recent measurements shew that the nearest stars are at almost exactly a million times the distances of the nearest planets. At its nearest approach to the earth, Venus is 26 million miles distant, while the nearest star, Proxima Centauri, is 25,000,000 million miles away; this latter star is a faint companion of the well-known bright star α Centauri in the southern hemisphere. The distances of the planets when at their nearest, and of the nearest stars, are shewn in the following table:
Planets Stars
Name Distance (miles) Name Distance (miles) Distance (light-years)
Venus 26,000,000 Proxima Centauri 25,000,000 million 4·27
α Centauri 4·31
Mars 35,000,000 Munich 15040 36,000,000 ” 6·06
Mercury 47,000,000 Wolf 359 47,000,000 ” 8·07
Lalande 21185 49,000,000 ” 8·33
Sirius 51,000,000 ” 8·65
As it is almost impossible to visualise a million, the mere statement that the stars are a million times as remote as the planets gives only a feeble indication of the immensity of the gap that divides the solar system from its nearest neighbours in space. Perhaps the apparent fixity of the stars gives a more vivid impression.
The earth performs its yearly journey round the sun at a speed of about 18½ miles a second, which is about 1200 times the speed of an express train. The sun moves through the stars at nearly the same rate—to be precise, at about 800 times the speed of an express train. And, broadly speaking, the nearer planets and the majority of the stars move with similar speeds. We shall not obtain a bad approximation to the truth if we imagine that all astronomical bodies move with exactly equal speeds, let us say, to fix our thoughts, a speed equal to 1000 times the speed of an express train. The distances of astronomical objects are now betrayed by the speed with which they appear to move across the sky—the slower their apparent motion the greater their distances, and vice versa. Now the planets move across the sky so rapidly that it is quite easy to detect their motion from night to night and even from hour to hour; the stars move so slowly that, except with telescopic aid, no motion can be detected from generation to generation, or even from age to age. Even the conspicuous constellations in the sky, which on the whole are formed of the nearer stars, have retained their present appearance throughout the whole of historic times. The contrast between the planets which change their positions every hour, and the stars which fail to shew any appreciable change in a century, gives a vivid impression of the extent to which the stars are more distant than the planets.
It is far more difficult to visualise the actual distances of the stars. The statement that even the nearest of them is 25,000,000 million miles away hardly conveys a definite picture to the mind, but we may fare better with the alternative statement that the distance is 4·27 light-years—that is to say the distance that light, travelling at 186,000 miles a second, takes in 4·27 years to traverse.
PLATE VI
Mt Wilson Observatory
The “Horse’s Head” in the Great Nebula in Orion
Light travels with the same speed as wireless signals because both are waves of electric disturbance. Incidentally this speed is just about a million times that of sound. The enormous disparity in the speeds of sound and of electric waves is vividly brought out in the ordinary process of broadcasting. When a speaker broadcasts from London his voice takes longer to travel 3 feet from his mouth to the microphone as a sound wave, than it does to travel a further 560 miles to Berlin or Milan as an electric wave. Wireless listeners in Australia hear the music of a broadcast concert sooner than an ordinary listener at the back of the concert hall who relies on sound alone; they hear it a fifteenth of a second after it is played. Yet light, or wireless waves travelling with the same speed as light, takes 4·27 years to reach the nearest star, so that the inhabitants of Proxima Centauri would be over four and a quarter years late in hearing a terrestrial concert. And in time we shall have to consider other and even more distant stars which terrestrial music would not yet have reached had it started on its journey before the Norman Conquest, before the Pyramids were built, even before man appeared on earth.
THE PHOTOGRAPHIC EPOCH
If we were only allowed to select one more landmark in the progress of astronomy, we might well choose the application of photography to astronomy in the closing years of the nineteenth-century; this opened the floodgates of progress more thoroughly than anything else had done since the invention of the telescope. Hitherto the telescope, after collecting and bending rays of light from the sky, had projected the concentrated beam of light through the pupil of the human eye on to the retina; in future it was to project it on to the incomparably more sensitive photographic plate. The eye can retain an impression only for a fraction of a second; the photographic plate adds up all the impressions it receives for hours or even days, and records them practically for ever. The eye can only measure distances between astronomical objects by the help of an intricate machinery of cross-wires, screws and verniers; the photographic plate records distances automatically. The eye, betrayed by preconceived ideas, impatience or hope, can and does make every conceivable type of error; the camera cannot lie.
And so it comes about that if we try to pick out landmarks in twentieth-century astronomy we find that, in a sense, it consists of nothing but landmarks; the slow, arduous methods of conquest of the nineteenth century have given place to a sort of gold-rush in which claims are staked out, the surface scratched, the more conspicuous nuggets collected, and the excavation abandoned for something more promising, all with such rapidity that any attempt to describe the position is out of date almost before it can be printed. We can only attempt a general impression of the new territory, and with this will be inextricably mixed a discussion of old territory seen in the light of new knowledge.
GROUPS OF STARS AND BINARY SYSTEMS
A glance at the sky, or, better, at a photograph of a fragment of the sky, suggests that, in the main, the stars are scattered at random over the sky, except for the concentration of faint stars in and towards the Milky Way, which we have already considered. Any small bit of the sky does not look very different from what it would if bright and faint stars had been sprinkled haphazard out of a celestial pepperpot.
Yet this is not quite the whole story. Here and there groups of conspicuous stars are to be seen, which can hardly have come together purely by accident. Orion’s belt, the Pleiades, Berenice’s hair, even the Great Bear itself, do not look like accidents, and in point of fact are not. It is the existence of these natural groups of stars that lies at the root of, and justifies, the division of the stars into constellations. We shall explain later how the physical properties of the stars are studied; for the present it is enough to remark that physical study confirms the suspicion that groups such as those just mentioned are, generally speaking, true families, and not mere accidental concourses, of stars. The stars of any one group, such as the Pleiades, not only shew the same physical properties, but also have identical motions through space, thus journeying perpetually through the sky in one another’s society. As such a group of stars are both physically similar, and travel in company, they might appropriately be described as a family of stars. The astronomer, however, prefers to call them a “moving cluster.”
These families are of almost all sizes, the smallest and commonest type consisting of only two members. After this the next commonest type consists of three members; our nearest three neighbours in space, Proxima Centauri and the two stars of α Centauri, form such a triple system. Then come systems of four, five and six members, and so on indefinitely.
Let us first turn our attention to families consisting of only two members—“binary systems,” as they are generally called. Even if the stars had been sprinkled on to the sky at random out of a pepperpot, the laws of chance would require that in a certain number of cases, pairs of stars should appear very close together. And a study of a photograph of any star-field shews that a large number of such close pairs actually exist. The number is, however, greater than can be explained by the laws of chance alone. Some pairs of stars may be close together by accident, but a physical cause is needed to account for the remainder. We can unravel the mystery by photographing the field at intervals of a few years and comparing the various results obtained. Some of the stars which originally appeared as close pairs will be found to move steadily apart. These are the pairs of stars which, although they appeared close together in the sky, were not so in space; one star merely happened to be almost exactly in line with the other as seen from the earth. Other pairs do not break up with the passage of time; the two components change their relative positions but never become completely separated. In the simplest case of all one star may be found to describe an approximately circular orbit about the other, just as the earth does round the sun, and the moon round the earth, and for precisely the same reason: gravitation keeps them together.
THE LAW OF GRAVITATION. Drop a cricket ball from your hand and it falls to the ground. We say that the cause of its fall is the gravitational pull of the earth. In the same way, a cricket ball thrown into the air does not move on for ever in the direction in which it is thrown; if it did it would leave the earth for good, and voyage off into space. It is saved from this fate by the earth’s gravitational pull which drags it gradually down, so that it falls back to earth. The faster we throw it, the further it travels before this occurs; a similar ball projected from a gun would travel for many miles before being pulled back to earth.
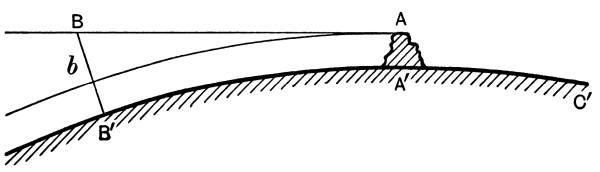
Fig. 2.
The law governing all these phenomena is quite simple. It is that the earth’s gravitational pull causes all bodies to fall 16 feet earthward in a second. This is true of all bodies which are free to fall, no matter how they are moving; every body which is not in some way held up against gravitation is 16 feet lower at the end of any second than it would have been if gravitation had not acted through that second.
To illustrate what this means, let the big circular curve BʹAʹCʹ in fig. 2 represent the earth’s surface, and imagine that a shot is fired horizontally from A, the top of an elevation AAʹ. If the shot were not pulled earthwards by gravitation, it would travel indefinitely along the line AB out into space. If AB is the distance it would travel in a second under these imaginary conditions, the end of a second’s actual flight does not find it at B, but at a point 16 feet nearer the earth, gravitation having pulled it down this 16 feet during its flight. For instance, if BB′ in fig. 2 should happen to be 16 feet, the shot would strike the earth at Bʹ after a flight of precisely one second.
As another example, let us suppose that the 16-foot fall below B does not drag the shot down to earth but only to a point b, which is at precisely the same height above the earth’s surface as the point A at which the shot started. If gravitation were not acting, so that the shot travelled along the line AB, its height above the earth would continually increase. Actually in the case we are now considering, gravitation pulls the shot down at just such a rate as to neutralise the increase of height which would otherwise occur, so that the height of the shot neither increases nor decreases; it neither flies off into space nor drops to earth, but continues to describe circles round the earth indefinitely.
A simple geometrical calculation shews that for the distance Bb to be 16 feet, the distance AB travelled in one second must be 25,880 feet or 4·90 miles[2]. Thus if we could fire a shot horizontally with a speed of 4·90 miles a second, it would describe endless circles round the earth, the earth’s gravitational pull exactly neutralising the natural tendency of the shot to fly away along the straight line AB.
In 1665 Newton began to suspect that this same gravitational pull might be the cause of the moon describing a circular orbit around the earth instead of running away at a tangent into space. The moon’s distance from the earth’s centre is 238,857 miles, or 60·27 times the radius of the earth. As the moon describes a circle of this size every month (27 days, 4 hours, 43 minutes, 11·5 seconds), we can calculate that its speed in its orbit is 2287 miles an hour. After one second it will have travelled 3350 feet, and if it kept to a strictly rectilinear course this would carry it 0·0044 feet further away from the earth. Thus, to keep in an exact circular orbit around the earth, it must fall 0·0044 feet in a second. This is far less than a body falls in a second at the earth’s surface, but Newton conjectured that the force of gravity must weaken as we recede from the earth’s surface. Actually a body at the earth’s surface falls 3632 times as fast as the moon’s earthward fall in its orbit. Now 3632 is the square of 60·27 (or 3632 = 60·27 × 60·27), whence Newton saw that the moon’s fall would be of exactly the right amount if the force of gravity fell off as the inverse square of the distance—that is to say, if it decreased just as rapidly as the square of the distance increased. As we shall see later, astronomical observation confirms the truth of this law in innumerable ways. This led Newton to put forward his famous law of gravitation according to which the gravitational pull of any body, such as the earth, falls off inversely as the square of the distance from the body.
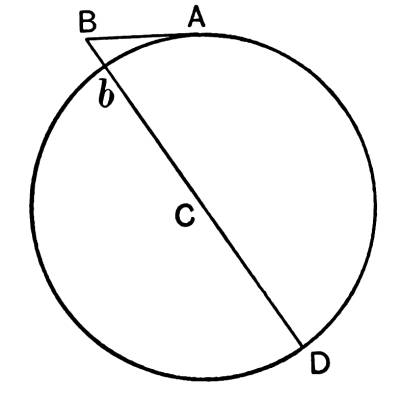
Fig. 3.
Professor C. V. Boys and others have measured the gravitational pull which a few tons of lead exert in the laboratory, and, with this knowledge, it is easy to calculate how many tons the earth must contain so as to exert its observed gravitational pull on bodies outside it. It is found that the earth’s weight must be just under six thousand million million million tons[3], or, as we shall write it, 6 × 10²¹ tons[4].
PLATE VII
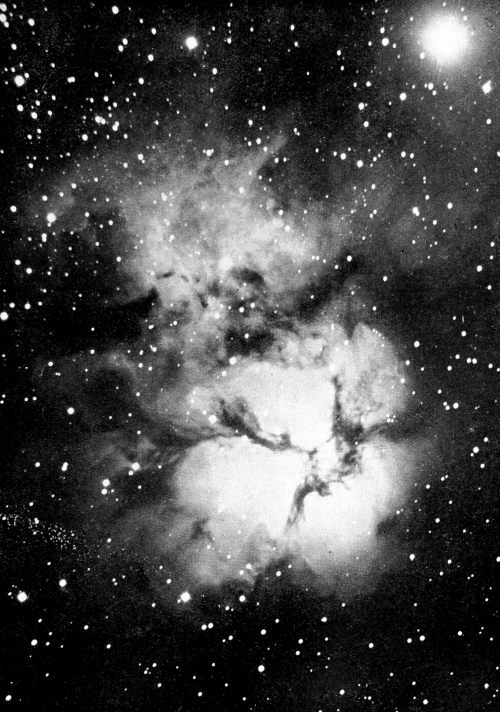
Mt Wilson Observatory
The Trifid Nebula M 20 in Sagittarius
Just as the earth’s gravitational pull keeps the moon perpetually describing circles around it, so the sun’s gravitational pull keeps the earth and all the other planets describing circles around the sun. Knowing the distance of any planet from the sun, and also its speed in its orbit, we can calculate the distance this planet falls towards the sun in a second. This tells us the amount of the sun’s gravitational pull, and from this we can calculate that the sun’s weight must be about 332,000 times the weight of the earth, or almost exactly 2 × 10²⁷ tons. Whichever of the planets we use, we obtain exactly the same weight for the sun. This not only gives us confidence in our result, but incidentally it also provides striking confirmation of the truth of Newton’s law of gravitation, for if this law were inexact or untrue, the different planets would not all tell exactly the same story as to the sun’s weight. Einstein has recently shewn that the law is not absolutely exact, but the amount of inexactness is inappreciable except for the nearest planet, Mercury, and even here it is so exceedingly small that we need not trouble about it for our present purpose.
Just as we can weigh the sun and earth by studying the motion of a body gripped by their gravitational pull—or “in their gravitational fields,” as the mathematician would say—so we can weigh any other body which keeps a second small body moving round it by its gravitational attraction. The motions of Jupiter’s satellites make it possible to weigh Jupiter; its weight is found to be about 1·92 × 10²⁴ tons, which is 317 times that of the earth, although only ¹/₁₀₄₇ of that of the sun. Similarly the weight of Saturn is found to be 5·71 × 10²³ tons or about 94·9 times that of the earth.
WEIGHING THE STARS. And now we come to a striking application of the principles just explained—when we observe two stars in the sky describing orbits about one another, we can weigh the stars from a study of their orbits. Generally the problem is not quite so simple as those we have just discussed. For its adequate treatment, we must once again levy toll on the mathematical work of Newton.
We have seen that a projectile fired horizontally with a speed of 4·90 miles a second, would describe endless circles round the earth. What would happen if it were fired in some other direction and with some other speed?
The answer was provided by Newton. He shewed that when a small body is allowed to move freely under the gravitational pull of a big body, it will run away altogether if its speed exceeds a certain critical amount, in which case its orbit is the curve called a hyperbola. But if its speed is less than this critical amount, its orbit will always be an ellipse—a sort of pulled out circle or oval curve[5] (fig. 4, p. 47). Previous to this Kepler had found that the actual paths of the planets round the sun were not exact circles but ellipses, although for the most part ellipses which did not differ greatly from circles; they are what the mathematician calls “ellipses of small eccentricity.” This provides still further confirmation of Newton’s law of gravitation, for it can be proved that if the force of gravitation falls off in any way other than according to Newton’s law of the inverse square of the distance, the orbits of the planets will not be elliptical.
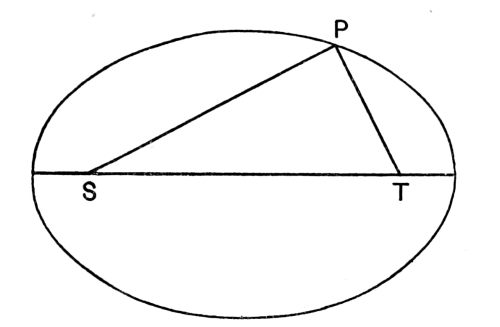
Fig. 4. The oval curve is an ellipse; the points S, T are its “foci.”
When the astronomer studies the motions of a binary star in the sky, he generally finds that the two components do not move in circles about one another but in ellipses[6]. Once again, Newton’s law is confirmed, and we are entitled to assume that the forces which keep binary stars together are the same gravitational forces as keep the moon from running away from the earth, or the planets from the sun. By a study of these ellipses it becomes possible to weigh the stars. If one of the component masses were enormously heavier than the other, the former would stand still while the lighter component described an ellipse around it, the motion being essentially similar to that of a planet around the sun. Such cases are not observed in actual binary stars because the two components are generally comparable in weight, and this brings new complications into the question. There is no need to enter into mathematical details here. Suffice it to say that neither star stands still; the two components describe ellipses of different sizes, and from a study of these two ellipses the weights of both the components can be determined.
The following table shews the result of weighing the four binary systems nearest the sun in this way, the sun’s weight being taken as unity:
Stellar Weights
Binary systems near the sun.
Star Distance in light-years from the sun Weights of components in terms of sun’s weight Luminosity (see p. 49)
α Centauri A 4·31 1·14 1·12
” B 0·97 0·32
Sirius A 8·65 2·45 26·3
” B 0·85 0·0026
Procyon A 10·5 1·24 5·5
” B 0·39 0·00003
Kruger 60 A 12·7 0·25 0·0026
” B 0·20 0·0007
We see that the weights of these stars do not differ greatly from that of the sun, although naturally the whole of space provides a greater range than the four stars of our table which happen to be near the sun. But even in the whole of space, no star whose weight is known with any accuracy has a weight less than Kruger 60 B, although at the other end of the scale there are many stars with far greater weights than any in our table. Of stars whose weights are known with fair accuracy, the star H.D. 1337 (Pearce’s star) is the weightiest, its two components being respectively 36·3 and 33·8 times as heavy as the sun. Plaskett’s star B.D. 6° 1309 is certainly heavier still, its components weighing at least 75 and 63 times as much as the sun, and probably more; the exact weights are not known (see p. 55 below). The system 27 Canis Majoris consists of four stars, whose combined weight, according to the evidence at present available, appears to be at least 940 times that of the sun, but we may properly exercise a certain amount of caution before accepting a figure so far outside the usual run of stellar weights.
The average constituent star in the above very short table has 0·94 times the weight of the sun, so that our sun appears to be of rather more than average weight, and this is confirmed by a more extensive study of stellar weights.
We might have expected a priori that the stars would prove to have all sorts of weights, for there is no obvious reason why stars should not exist with weights millions of times that of the sun, or again with weights only equal to that of the earth or less. Actually we find that the weights of the stars are mostly fairly equal, very few stars having weights greatly dissimilar from that of the sun. This seems to indicate that a star is a definite species of astronomical product, not a mere random chunk of luminous matter.
LUMINOSITY. The last column of the table on p. 48 gives the “luminosities” of the stars, which means their candle-power as lights, that of the sun being taken as unity. For instance the entry of 26·3 for Sirius means that Sirius, regarded as a lighthouse in space, has 26·3 times the candle-power of the sun. The luminosities of the stars shew an enormously greater range than their weights. In a general way the heaviest stars are found to be the most luminous, as we should naturally expect, but their luminosity is out of all proportion to their weight. The heavier component of Sirius has only 2·9 times the weight of the lighter component, but 10,000 times its luminosity. Again, in the system of Procyon the heavier component has 3·2 times the weight, but 180,000 times the luminosity, of the lighter component. It appears to be an almost universal law that the candle-power per ton is far greater in heavy stars than in light. This is one of the central and, at first sight, one of the most perplexing facts of physical astronomy: it is so fundamental and so pervading that no view of stellar mechanism can be accepted which fails to explain it.
SPECTROSCOPIC VELOCITIES. When a star’s distance is known, its motion across the sky tells us its speed in a direction at right angles to the line along which we look at it—i.e. across the line of sight—but provides no means of discovering its speed along this line. We cannot see the motion of a body which is coming straight towards us, and a star moving at a million miles a second in a direction exactly along the line of sight would yet appear to be standing still in the sky. To evaluate velocities along the line of sight, the astronomer calls in the aid of the spectroscope.
All light is a blend of lights of different colours, and just as Newton, with his famous prism, analysed sunlight into all the colours of the rainbow, so the spectroscope analyses the light from a star, or indeed from any source whatever, into its various constituent colours. The instrument spreads out the analysed light into a strip of light of continuously graduated colour, which is described as a “spectrum.” In this the colours are the same, and are found to be arranged in the same order, as in the rainbow, running from violet through green and orange to red. There is a physical reason for this. We shall see later (p. 114) that light consists of trains of waves—like the ripples which the wind blows up on a pond—and that the different colours of light result from waves of different lengths, red light being produced by the longest waves, and violet light by the shortest. The colours in the spectrum occur in the order of their wave-lengths, from the longest (red) to the shortest (violet). In the typical stellar spectrum certain short ranges of colour or wave-length are generally missing, for reasons we shall discuss later (p. 126), so that the spectrum appears to be crossed by a number of dark lines or bands, thus forming a pattern rather than a continuous gradation of colours. Examples of stellar spectra are shewn in Plate VIII.
PLATE VIII

B 0 ε Orionis

A 0 Sirius

F0 δ Geminorum

G 0 Capella

K 0Arcturus

M 0Betelgeux
Stellar Spectra
(The spectral types are indicated on the left
It is frequently convenient to classify stars by the type of spectra they emit. It is now known that a star’s spectrum depends primarily upon the temperature of its surface. As a consequence, stellar spectra can, in the main, be arranged in a single continuous sequence, and their usual classification is by a sequence of letters, O, B, A, F, G, K, M with decimal subdivisions, the temperature falling as we pass along the sequence, so that O-type stars have the highest surface-temperatures and M-type stars the lowest. Spectral types are indicated on the left in Plate VIII.
When the light received from a star is analysed in a spectroscope, the pattern of lines or bands may be found to be shifted bodily in one direction or the other. If the shift is towards the red end of the spectrum, the light emitted by the star is reaching us in a redder state than that in which it ought normally to be, and as red light has the longest wave-length, this means that every wave of light is longer—more drawn out—than normal. We conclude that the star is receding from us. In the same way, if the spectral pattern is shifted toward the violet end of the spectrum, we know that the star must be approaching us. The shift of a spectrum resulting from the motion of the body which emits it is generally described as the “Doppler Effect.” From its amount we can calculate a star’s actual speed along the line of sight, and the calculation is surprisingly simple. If each line or band in a spectrum is found to represent a wave-length a hundredth of one per cent. longer than that usually associated with it, then the star’s speed of recession is a hundredth of one per cent. of the velocity of light, or 18·6 miles a second—and similarly for all other displacements.
SPECTROSCOPIC BINARIES. As the two components of a binary system are generally moving with different speeds, the normal spectrum of a binary system consists of two distinct superposed spectra, the two spectra shewing different shifts which correspond to the speeds of the two components. From the observed orbits of the two components of a binary system, an astronomer might proceed to calculate with what speeds these components would move in the direction of the line of sight, and could then predict to what extent the two spectra ought to be displaced if the light from the system were analysed in a spectroscope; the spectroscope would of course confirm his prediction.
It is more instructive to imagine the reverse process. Suppose that on analysing the light from a star, the astronomer obtains a composite spectrum in which two distinct spectra shift rhythmically backwards and forwards about their normal position. The fact that there are two spectra tells him that he is dealing with a binary system; if the rhythmic shift repeats itself every two years, he knows that its orbit takes two years to complete. He studies the star by direct vision and finds it is a binary system in which the constituents revolve about one another every two years.
He examines another spectrum, and finds that it shifts rhythmically every two days. On looking directly at this star he can only see a single point of light. There must, of course, be two stars, but the mere fact that they get around one another in so short a time as two days proves that they must be very close to one another, and he need feel no surprise that his telescope has failed to separate the image into two distinct points of light. Systems of this kind, which the spectroscope shews to be binary, but the telescope usually shews as a single point of light, are called “spectroscopic binaries.” Over a thousand such systems are known.
If the astronomer tries to construct the orbit of such a system from the spectroscopic observations alone, he finds himself in difficulties. His observations only tell him the velocities along the line of sight, and these depend both on the actual speed and on the degree of foreshortening; the same velocity may arise either from a big orbit in a plane nearly at right angles to the line of sight, or from a much foreshortened little orbit. It is impossible to calculate the actual orbit or the weights of the stars from spectroscopic observation alone.
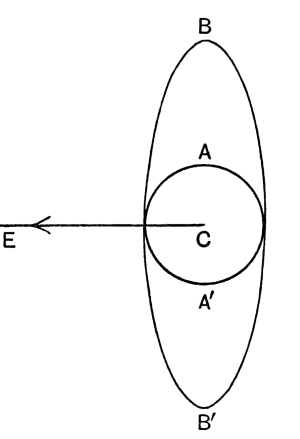
Fig. 5. The little orbit AA′ and the big orbit BB′ give the same velocities along the line of sight CE.
ECLIPSING BINARIES. There is one exception. Suppose that a star’s light is seen to diminish in amount at regular intervals and subsequently to return to its original strength. The obvious interpretation of the diminution of light is that one component of the system is eclipsing the other, and this can only happen if the orbit is so completely foreshortened that its plane passes through, or at least very close to, the earth. In such a case it is possible to reconstruct the whole orbit, and thence to calculate the weights of the two components. Not only so, but the length of time during which the eclipses last tells us the actual sizes of the two components, so that it is possible to draw a complete picture of the system. Diagrams of the dimensions and orbits of two typical eclipsing binaries are shewn in fig. 6; these are drawn to the same scale, this being indicated by the small circle representing the sun.
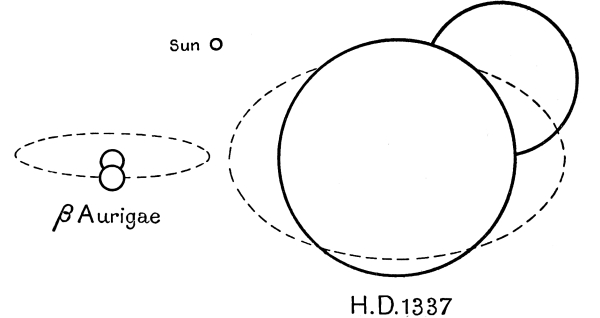
Fig. 6. Components and orbits of Eclipsing Binaries.
When no eclipse occurs in a spectroscopic binary, we do not know how much foreshortening to allow for, but we can obtain a general idea of the weights of the components by assuming an average degree of foreshortening. If we assume different degrees of foreshortening in turn, we shall find that the computed weights come out least when the plane of the orbit is assumed to pass through the earth—i.e. when the orbits are computed as though the system were an eclipsing one. Thus although we cannot discover the actual weights of the components of a non-eclipsing binary, we can always state limits above which they must lie, namely the weights computed as though the system were an eclipsing one. In this way, we know that the two components of Plaskett’s star must have more than 75 and 63 times the weight of the sun.
VARIABLE STARS
The majority of stars shine with a perfectly steady light, so that we can say that a star is of so many candle-power. The sun, for instance, emits a light of 3·23 × 10²⁷ candle-power.
Yet there are classes of exceptional stars in which the light flickers up and down. In some, as in the eclipsing binaries just described, the light-fluctuations are quite regular, repeating themselves with such precision that the stars might well be used as time-keepers. In others the fluctuations, though not perfectly regular, are nearly so, while still others exist in which the fluctuations appear at present to be completely irregular, although no doubt the changes in these will be reduced to law and order in due course. For our present discussion, the various types of irregular variables are not of great importance.
CEPHEID VARIABLES. The really interesting stars are those of a certain class of regular variable, generally called “Cepheid variables,” after their prototype δ Cephei. The physical nature of these stars and the mechanism of their light-fluctuation is still far from being understood; competing theories are in the field which we need not discuss at this stage (see p. 223 below).
Whatever their mechanism may be, observation shews that these stars possess a certain definite property, which proves to be of the utmost value. This being so, we may accept it gratefully without troubling as to its why and wherefore. The perfectly regular light-fluctuations of the eclipsing binaries would make them suitable for time-keepers even though we did not understand the mechanism behind these fluctuations. In the same way the fluctuations of Cepheid variables have a quality which makes them valuable as measuring-rods with which to survey the distant parts of the universe. In brief, this property is that we can deduce the intrinsic brightness of these stars, and so their distances, from their observed light-fluctuations.
The light-fluctuations are so distinctive as to make the stars easy of detection. There is a rapid increase of light, followed by a slow gradual decline; then again the same rapid increase and slow decline as before. It is as though someone were throwing armfuls of fuel on to a bonfire at perfectly regular intervals.
One other class of variable stars, generally known as “long-period variables,” shews somewhat similar light-fluctuations, but the two classes are easily distinguished by their very different periods of light-fluctuation. The Cepheid variable completes its cycle in a time which may be a few hours, or may be days or weeks, but is never more than about a month, whereas the long-period variable generally requires about a year.
Fig. 7 shews the light curves of typical variable stars of the different classes. In each diagram the progress of time is represented by motion across the page from left to right; the higher the fluctuating curve is above the horizontal line at any instant, the brighter the star at that instant.
Out near the boundary of the galactic system is a cluster of stars known as the Lesser Magellanic Cloud (Plate XXI, p. 214), in which Cepheid variables occur in great profusion. In 1912, Miss Leavitt of Harvard found that the light of the brighter Cepheids in this cloud fluctuated more slowly than the light of the fainter ones. Whatever was responsible for turning the stellar lights up and down, acted more rapidly for feeble than for brilliant lights. The apparent brightnesses of a number of Cepheids at varying distances would of course depend only in part on their intrinsic brightness or candle-power, but the stars in the Magellanic Cloud are all, nearly enough, at the same distance from the earth. Thus differences in the apparent brightnesses of stars in this cloud must represent real differences of intrinsic brightness, and Miss Leavitt’s discovery could be stated in the form that the period of light-fluctuation of a Cepheid depended on its candle-power. Although this was only proved for the Cepheids in the Magellanic Cloud, it must be true for all Cepheids wherever they are, for it is inconceivable that we could make a star’s light fluctuate more slowly or more rapidly merely by altering its distance from us—by ourselves receding from it, in fact.
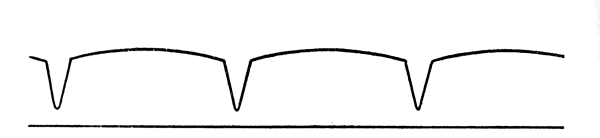
Light Curve of Eclipsing Binary (β Aurigae)
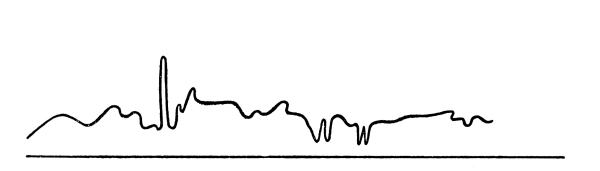
Light Curve of Irregular Variable (RS Ophiuchi)
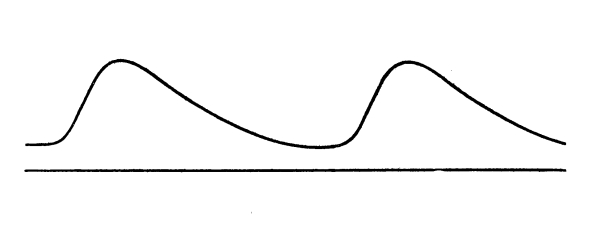
Light Curve of Cepheid Variable(ν Lacerbae)
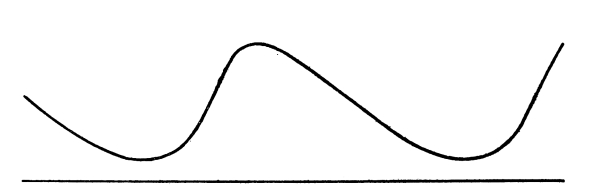
Light Curve of Long-Period Variable (ο Ceti)
Fig. 7. Light Curves of typical Variable Stars of different classes.
Professor Hertzsprung of Leiden and Dr Shapley, then of Mount Wilson Observatory, were quick to seize upon the implications of this discovery. If two Cepheids A, B in different parts of the sky are found to fluctuate with equal rapidities, then their intrinsic candle-powers must be equal. Thus any difference in their apparent brightness must be traceable to a difference in their distances from us. If A looks a hundred times as bright as B, then B must be at ten times the distance of A. In the same way, a third Cepheid C may prove to be at ten times the distance of B. We now know that C is a hundred times as remote as A. And if D can be found ten times as distant as C, we know that D is a thousand times as remote as A. So we can go on constructing and ever extending our measuring-rod; there is no limit until we reach distances so great that even Cepheid variables, which are exceptionally bright stars, fade into invisibility.
So far we have only considered the comparative distances of Cepheids. The absolute distances of many of the nearer Cepheids have, however, been determined by the parallactic method already explained—i.e. by measuring their apparent motion in the sky, resulting from the earth’s motion round the sun. Taking any one of these stars as our original Cepheid A, we can step continually from one Cepheid to another, and so calculate the absolute distances of all the Cepheid variables in the sky.
In this way the observed relation between the period of fluctuation and the brightness of Cepheid variables—commonly known as the “period-luminosity law”—can be made to provide a scale on which the absolute luminosity, or candle-power, of a Cepheid can be read off directly from the observed period of its light-fluctuations. The Cepheid variables may be regarded as lighthouses set up in distant parts of the universe. We can recognise them, just as a sailor recognises lighthouses, by the quality of their light. We can read off their candle-power from the period of their observed light-fluctuations as easily as the sailor could read off the candle-power of a lighthouse from an Admiralty chart. The apparent brightness of the Cepheid informs us as to its distance from us[7].
It would be difficult to over-estimate the importance of all this to modern astronomical science. It means that a method has been found for surveying, if not the whole of the universe, at least those parts of it in which Cepheid variables are visible. Actually this last reservation is unimportant, for Cepheid variables are very freely scattered in space. Naturally the method is of most value for the exploration of the most distant parts of the universe; here it achieves triumphant success where other methods fail completely. The parallactic method begins to fail when we try to sound distances of more than about a hundred light-years. The apparent path in the sky, which a star at this distance describes, in consequence of the earth’s motion round the sun, is of the size of a pin-head two miles away. With all their refinements, modern instruments find it difficult enough to detect so small a motion as this, and it is practically impossible to measure it with accuracy. The “period-luminosity” law measures the distances of objects up to a million light-years away, with a smaller percentage of error than is to be expected in the parallactic measures of stars only a hundred light-years away.
SOUNDING SPACE
This by no means exhausts the list of modern methods of surveying space. Any standard type of astronomical object, which is easily recognisable and emits the same amount of light no matter where it occurs, provides an obvious means of measuring astronomical distances, for when once the intrinsic luminosity of such an object has been determined, the distance of every example of it can be estimated from its apparent brightness.
Cepheid variables of assigned periods provide the most striking instance of such standard objects, but three others are available, although they are not so generally useful as Cepheids. First comes another type of variable star, the “long-period variables” already mentioned, which are generally similar to Cepheids except that their light fluctuates much more slowly. These stars are intrinsically far more luminous even than Cepheids, many of them being 10,000 times as luminous as the sun. They are accordingly visible at enormous distances, and may ultimately be found to provide a means of sounding depths of space at which even Cepheids are lost to sight.
Next come “novae” or new stars. Every now and then an ordinary star in the sky suddenly bursts out in a phenomenal blaze of light, shining with perhaps a thousand times its original brilliance. The cause of these violent outbursts is still a matter for debate, and no thoroughly convincing explanation has as yet been given. A study of comparatively near novae has, however, provided information as to the luminosity of the average nova when at its brightest, and as novae appear in various parts of the sky, and particularly in the extra-galactic nebulae, they provide a rough means of measuring stellar and nebular distances.
Blue stars provide yet another method. These are exceedingly luminous, and they vary but little in intrinsic luminosity. Moreover, the luminosity of any particular star can generally be estimated fairly closely from the quality of the light it emits, by methods which will be explained later. This makes it possible to determine the distances of blue stars, and so of course of the astronomical objects in which they occur.
Still two other methods of a different kind may be briefly mentioned. Dr W. S. Adams, Director of Mount Wilson Observatory, and others have found that certain definite peculiarities in the spectra of certain classes of stars convey information as to the intrinsic brightness of the star emitting them; with this information it is easy to estimate the star’s distance from its apparent brightness. This is commonly described as the method of Spectroscopic Parallaxes.
Finally the diffuse cloud of nebular matter which is spread through interstellar space (p. 30) is found to affect the quality of light travelling through it, so that a star’s spectrum gives an indication of the amount of cloud through which the light of the star has travelled, and this again provides a rough means of estimating distances inside the galactic system.
PLATE IX
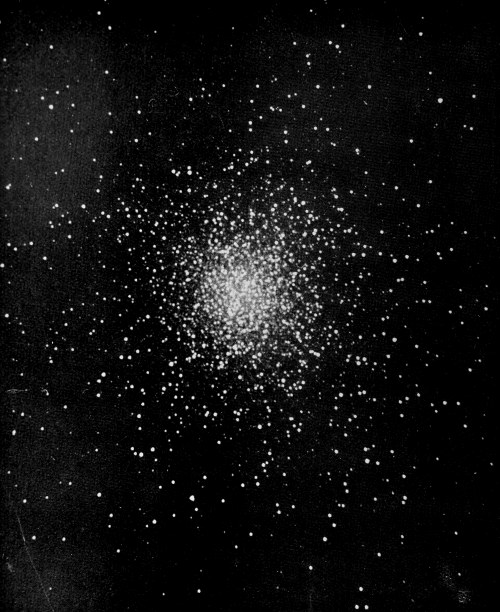
Dominion Astrophysical Observatory, B. C.
The Globular Cluster M 13 in Hercules
GLOBULAR CLUSTERS. The law of Cepheid luminosity was first used by Hertzsprung to estimate the distance of the Lesser Magellanic Cloud, the study of which had been responsible for the original discovery of the law. Shapley subsequently used it to determine the distances of the rather mysterious groups of stars known as “Globular Clusters.” A typical example of these is shewn in Plate IX. About 100 of these clusters are known and they all look pretty much alike, except for differences in apparent size. Even these latter can be traced mainly to differences of distance, so that the globular clusters are probably almost identical objects, and Plate IX might almost be regarded as a picture of any one of them. Cepheid variables abound in them all.
Shapley found the nearest globular cluster, ω Centauri, to lie at a distance of about 22,000 light-years, the furthest, N.G.C. 7006, being about ten times as remote, at a distance of 220,000 light-years. At such distances the parallactic method of measuring distances would of course fail hopelessly. The parallactic orbit of a star at 220,000 light-years’ distance is about the size of a pin-head held at a distance of 4000 miles; no telescope on earth could detect, still less measure, such an orbit.
The mere figure of 220,000 light-years can convey but little conception of the distance of this remotest of star-clusters from us. We may apprehend it better if we reflect that the light by which we see the cluster started on its long journey from it to us somewhere about the time when primaeval man first appeared on earth. Through the childhood, youth and age of countless generations of men, through the long prehistoric ages, through the slow dawn of civilisation and through the whole span of time which history records, through the rise and fall of dynasties and empires, this light has travelled steadily on its course, covering 186,000 miles every second, and is only just reaching us now. And yet this enormous stretch of space does not carry us to the confines of the universe; we shall now see that in all probability it has barely carried us to the confines of the galactic system.
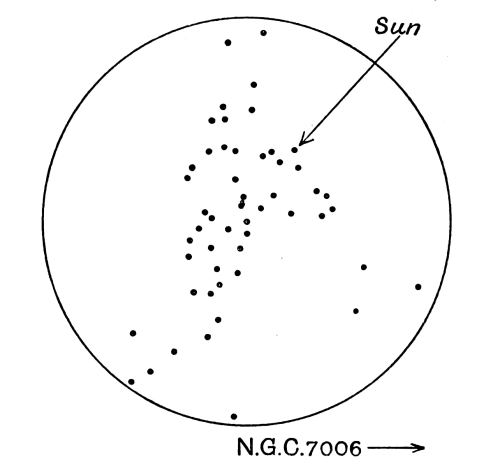
Fig. 8. The arrangement of the Globular Clusters.
Shapley has mapped out the complete system of the globular clusters, and finds that they occupy an oblong region, lying on both sides of the plane of the Milky Way, its greatest diameter of about 250,000 light-years lying in this plane, and its two transverse diameters being considerably shorter. The sun is nearer to the edge of this oblong region than to its centre, which explains why all the globular clusters appear in one half of the sky, as Hinks first noted in 1911. The general arrangement is shewn in fig. 8. The page of the book represents the plane of the Milky Way, the various dots representing the points in this plane which are nearest to the different clusters, so that the diagram exhibits the system of globular clusters as they would appear to an observer out in space who viewed the galactic plane “full-on.” All the globular clusters except N.G.C. 7006 lie within a circle of about 125,000 light-years’ radius, having its centre at about 50,000 light-years from the sun.
PLATE X
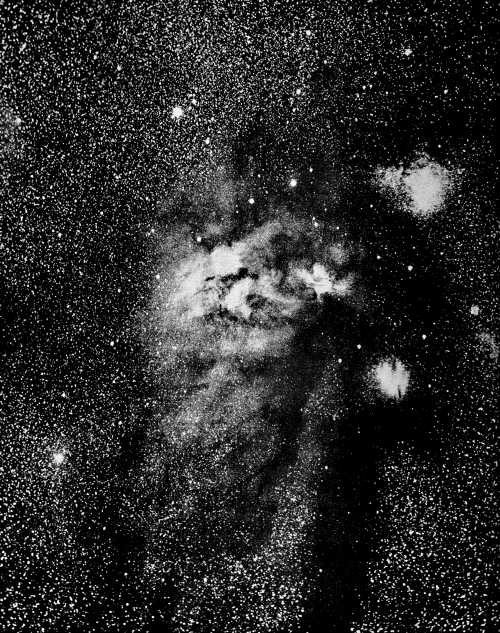
E. E. Barnard
The Region of ρ Ophiuchi
THE ARRANGEMENT OF THE GALACTIC SYSTEM. Although the matter has long been one of vigorous controversy, it is now becoming clear that the region of space mapped out by these globular clusters approximately coincides with that occupied by the galactic system itself. Herschel and Kapteyn appear to have been in error in supposing the centre of the galactic system to be in the neighbourhood of the sun; a considerable accumulation of evidence indicates that it lies in a massive star-cloud in the constellations of Ophiuchus and Scorpio. Dr Shapley and Miss Swope, at Harvard Observatory, have recently determined the distance of this star-cloud from the sun as 47,000 light-years, which places it almost exactly at the centre of the system of globular clusters, as shewn in fig. 8. There is what Shapley describes as a “local system” of fairly bright stars surrounding the sun, and the error of identifying this with the main galactic system has apparently been responsible for a large part of the confusion which has hitherto beset the problem of the architecture of the galaxy. This local system has the same flattened shape as the main system, but it does not lie exactly in the plane of the Milky Way, being inclined at an angle of about 12 degrees to it. The sun appears to lie very near to the plane of the central plane of the system; recent determinations place it about 100 light-years to the north of this plane. Fig. 9 shews a cross-section of the system, as it is now imagined to lie.
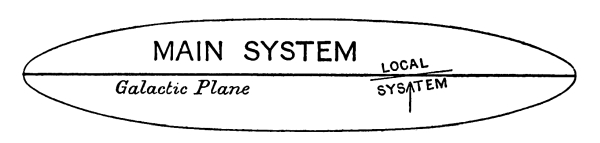
Fig. 9. Diagrammatic scheme of cross-section of the Galactic System. The sun is at the head of the arrow.
We have already compared the shape of the galactic system to that of a wheel. It obviously could not retain this shape if the stars which formed it were standing still in space. For the gravitational pull of the inner stars would cause the outermost stars—the rim of the wheel—to fall inwards, and the system would end as a confused jumble of stars somewhere in the vicinity of the hub of the wheel. In 1913, Henri Poincaré, Professor of Mathematics at the Sorbonne, suggested that the galactic “wheel” might escape this fate if it were in a state of rotation. Just as the earth’s motion saves it from falling into the sun, and the moon’s motion saves it from falling on to the earth, so, Poincaré suggested, the stars which form the rim of the wheel might be saved from falling into the hub, by a motion of rotation of the whole wheel. A rough calculation suggested that it would be necessary for the wheel to rotate at the rate of a complete revolution about every 500 million years.
Naturally it is no simple matter to detect so slow a rotation. It was first suspected to occur in the following way. We know that when a spinning-top or gyroscope is set in rapid rotation, a considerable force is needed to twist the top or gyroscope about in space. This is the principle of the gyroscopic compass such as is used to steer ships. A gyroscope, a sort of big steel spinning-top, is started spinning with its two ends pivoted in a swinging frame. No matter how the ship turns, the motion of the gyroscope keeps the frame pointing away in the same direction, and by the help of this fixed direction the ship is kept on its course. Now the solar system has many of the properties of a huge spinning-top, the revolutions of the planets corresponding to the spin of the top. As there is no twist impressed on this “spinning-top” from outside, its axis of rotation must always point in the same direction, thus providing a sort of “gyroscopic compass” to give us our bearings in space.
In 1913 Charlier believed he had found that this “gyroscopic compass” was turning round against the distant background of the Milky Way, at the rate of a complete rotation every 370 million years, a period which subsequent measurements increased to 530 million years. Eddington then suggested that it might be the background rather than the gyroscopic compass that was turning, the Milky Way actually rotating in the way imagined by Poincaré, and at just about the rate which Poincaré had calculated.
Recent investigations by Oort, Plaskett, Lindblad and others prove beyond doubt that such a rotation really occurs, although it is not of the simple “cart-wheel type” we have so far discussed. In the solar system the innermost planets move more rapidly than the outermost: they must necessarily do so if the motion of each planet is to counteract the sun’s attraction. In the same way, if the rotational motion of the galaxy is to counteract the gravitational attraction of its innermost stars, its inner parts must rotate more rapidly than its outermost. Thus the sun ought to be overtaking those stars which lie outside it on the galactic wheel, while being itself overtaken by those which lie inside it. Such an overtaking motion is fairly easy to detect. A careful analysis of observed stellar motions has disclosed such a motion, shewing that the galaxy as a whole is in rotation in precisely the way just described, the inner parts rotating most rapidly.
The hub of this gigantic wheel lies almost exactly in the direction which Shapley assigned to the centre of the galaxy from his study of the globular clusters. Its distance from the sun, which cannot yet be determined with any great accuracy, is probably somewhere about 37,000 light-years. To within the limits of accuracy which are at present attainable, this places the centre of the galactic wheel at the centre of the system of globular clusters (see fig. 8, p. 64). In the vicinity of the sun, the galactic wheel performs a complete revolution in a period of about 230 million years, and this endows the stars near the sun with a motion through space at a speed of nearly 200 miles a second, arising from the rotation of the galaxy alone.
With these data, it is possible to weigh the stars of the galactic system en masse. Individual stars far away from the centre of the galactic system must be describing orbits under the gravitational pull of the system as a whole, the pull which prevents the stars from scattering away into space, and so keeps the galactic system in being. The aggregate of these orbital motions produces the general rotation of the galaxy which we have just discussed. And from the figures just mentioned, it can be calculated that the total weight of matter inside the sun’s orbit must be about that of 240,000 million suns. Part of this may of course arise from interstellar dust or gas. Nevertheless, as the average star weighs considerably less than the sun, the total number of stars in the galactic system may well be of the order of 400,000 million. This estimate of course includes all stars, dark as well as luminous, but there are reasons for believing that the number of dark stars is comparatively small (see p. 269 below).
Other estimates of the number of stars in the galaxy have been made, generally lower than the foregoing. Two estimates by Lindblad, for instance, give the total weight of the galaxy as 110,000 and 180,000 million suns respectively.
Again we are confronted with the difficulty of visualising such large numbers. With perfect eyesight on a clear moonless night we can see about 3000 stars. Imagine each of these 3000 stars to spread out into a complete sky-full of 3000 new stars, and we are contemplating 9 million stars, which is still only the number visible in a telescope of 5 inches aperture. We probably cannot ask our imagination to play the same trick for us a second time, but if it can be persuaded to do so, and if we can think of each of these 9 million stars as again generating a whole sky-full of stars, we still have only 27,000 million stars within our purview—a number which is still far below any permissible estimate of the total number of stars in the galactic system. Or again, let us notice that the number of stars photographically visible in the 100-inch telescope, namely 1500 million, is about equal to the number of men, women and children in the world. Each inhabitant of the earth—each man, woman and child living in the five continents or travelling on the seven seas—can be allowed to choose his own particular star, and can then repeat the process tens, and more probably hundreds, of times without going outside the galactic system.
After this we can still go exploring outside the galactic system and find more and ever more stars. The galactic system, with its hundreds of millions of stars, no more contains all the stars in space than one house contains all the inhabitants of Great Britain. There are millions of other houses and millions of other families of stars.
THE EXTRA-GALACTIC NEBULAE. We have already spoken of the faint nebulous objects which Herschel described, somewhat conjecturally, as “island universes.” These are the other houses in which other families of stars are to be found. The most powerful of modern telescopes shew that they consist, in part at least, of huge clouds of stars. Just as a powerful microscope shews that a puff of cigarette smoke, in spite of its appearance of continuity, consists of a cloud of minute but quite distinct particles, so a powerful modern telescope breaks up the light from the outer regions of these nebulae into distinct spots of light; the nebula is resolved into a cloud of shining particles, just as the Milky Way was in Galileo’s tiny telescope of three centuries ago. Plate XI shews an example; it represents a magnification of a small area in the top left-hand corner of the Great Nebula M 31 in Andromeda already shewn in Plate IV (p. 30), and the resolution into distinct spots of light is unmistakable. We know that some at least of these spots of light are stars, because we recognise them as Cepheid variables, their light shewing the unmistakable characteristic fluctuations of the familiar Cepheid variables nearer home. The other shining particles are of comparable brightness and shew about the range of brightness above and below that of the Cepheids which is needed to justify us in supposing that they are ordinary stars.
PLATE XI
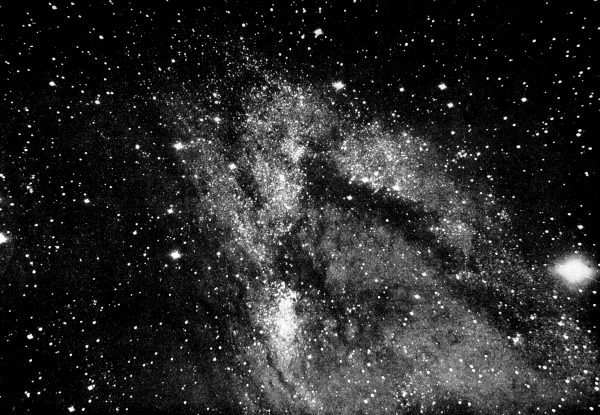
Mt Wilson Observatory
Magnification of a part (left-hand top corner) of the Great Nebula M 31 in Andromeda, which is shewn complete in Plate IV (p. 30)
PLATE XII
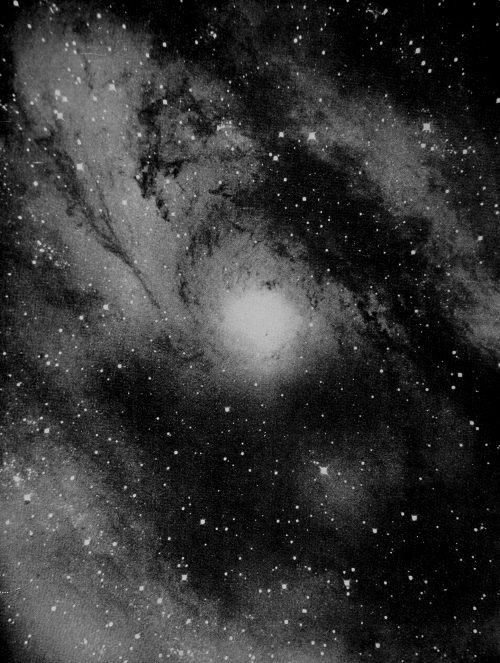
Mt Wilson Observatory
Magnification of the central region of the Great Nebula M 31 in Andromeda
From the observed periods of fluctuation of their Cepheid variables, in combination with the other methods just explained, Dr Hubble of Mount Wilson Observatory has recently found that even the nearest of these nebulae, namely the nebula M 33 shewn in Plate XX (p. 213), is so remote that light takes some 850,000 years to travel from it to us. The Great Nebula M 31 in Andromeda (p. 30) is at the slightly greater distance of about 900,000 light-years. This abundantly proves that these nebulae lie right outside the galactic system, justifying the term “extra-galactic” nebulae.
One might attempt to estimate the total number of stars in these nebulae by counting those visible in a selected average small area, but more precise methods are available. Just as we have supposed that the outermost stars in the galactic system are describing orbits under the gravitational attraction of the galaxy as a whole, so we must suppose that the outermost stars in a nebula are describing orbits under the gravitational attraction of the main mass of the nebula; the forces which keep them from running away from the nebula are similar to those which keep the earth moving in its orbit round the sun. If so, we can weigh the nebulae, precisely in the same way as we weigh the sun (p. 44) or the galactic system (p. 69). Dr Hubble in this way estimates that the weight of the Great Nebula M 31 in Andromeda, shewn in Plate IV, must be about 3500 million times that of the sun, while the nebula N.G.C. 4594 in Virgo, shewn in Plate XV (p. 204), must have about 2000 million times the weight of the sun. In general it seems likely that each of the extra-galactic nebulae contains about enough matter to make some 2000 million stars.
This is not the same thing as saying that each nebula already contains 2000 million stars. While many of these nebulae appear to consist largely of clouds of stars, yet most of them contain also a large central region which no telescopic power has so far succeeded in resolving into distinct points. For instance, Plate XII shews the central region of the Great Nebula in Andromeda magnified to the same degree as the left-hand top corner shewn in Plate XI, and this is clearly not resolved into stars in the same way as the outer regions shewn in Plate XI. The whole of the nebula N.G.C. 4594 in Virgo, shewn in Plate XV, also refuses to be resolved into separate stars. We shall find reasons later (Chapter IV) for interpreting these central regions as masses of gas which are destined in time to form stars, but have not yet done so. We shall in fact find that the nebulae are the birthplaces of the stars, so that each nebula consists of stars born and stars not yet born. It is the total weight of stars already born and of matter which is destined to form stars that aggregates 2000 million suns.
About 2,000,000 of these extra-galactic nebulae are visible in the great 100-inch telescope. In general, they appear to be scattered with a tolerable approach to uniformity through space, their average distance apart being something of the order of 2,000,000 light-years, although here and there this uniformity is broken by clouds and clusters of nebulae. For instance, the sky is remarkably rich in nebulae in the constellations of Virgo and Coma Berenices. Here a cloud of about 300 nebulae is collected, according to Shapley, within a space having only from 5 to 10 times the dimensions of the galactic system, at a distance of some ten million light-years from the sun. The same region of the sky appears also to contain three other and more remote clouds. Shapley has suggested that our galactic system, the Andromeda nebula and other near nebulae may constitute a similar cloud.
THE REMOTEST DEPTHS OF SPACE. Hubble estimates that the most distant of the 2,000,000 nebulae revealed by the 100-inch telescope must be about 140 million light-years away from us. This is the greatest distance which the human eye has so far seen into space. The 220,000 light-years which formed the diameter of the galactic system seemed staggeringly large at first, but we are now speaking of distances some 600 times greater. For all but a 500th part of its long journey, the light by which we see this remotest of visible nebulae travelled towards an earth uninhabited by man. Just as it was about to arrive, man came into being on earth, and built telescopes to receive it. So at least it appears when viewed on the astronomical scale. Yet even this last 500th part of the journey covers the lives of 10,000 generations of men, through all of which, as well as through 500 times as great a span of time, the light has been travelling steadily onward at 186,000 miles a second.
There are so many faint nebulae at the very limit of vision of the 100-inch telescope, that it seems certain that a still larger telescope would reveal a great many more. The 200-inch telescope, which it is hoped will shortly be built, having twice the aperture of the present 100-inch, ought to probe twice as far into space, and so may perhaps be expected to shew about eight times as many, or 16 million, nebulae.