III. EXPERIMENTS WITH UNIVERSITY STUDENTS, TRAINED IN ATHLETICS. (continued 2)
Reading edition
Bread 51 × 1.75 = 0.893
Bacon 59 × 3.28 = 1.935
Potato croquette 80 × 0.77 = 0.610
Macaroni 100 × 0.87 = 0.870
Water ice 184 × 0.006 = 0.011
Vegetable soup 100 × 0.48 = 0.480
Total nitrogen in food 12.167 grams.
Total nitrogen in urine 10.040
Fuel value of the food 3100 calories.
Tuesday, May 24, 1904.
Breakfast.—None.
Lunch.—Cream of celery soup 100 grams, bread 35 grams, butter 10 grams, farina croquette 88 grams, potato 150 grams, stewed prunes 176 grams.
Dinner.—Tomato soup 150 grams, Hamburg steak 77 grams, potato 150 grams, spinach 75 grams, farina croquette 107 grams, syrup 48 grams, bread 30.5 grams, butter 7.5 grams, cream pie 162 grams.
Food. Grams. Per cent Nitrogen. Total Nitrogen.
Bread 35 × 1.64 = 0.574 grams.
Butter 10 + 7.5 = 17.5 × 0.15 = 0.026
Farina croquette 88 × 0.74 = 0.651
Potato 150 × 0.26 = 0.390
Prunes 176 × 0.17 = 0.299
Cream of celery soup 100 × 0.48 = 0.480
Tomato soup 150 × 0.19 = 0.285
Hamburg steak 77 × 3.96 = 3.049
Potato (fried) 150 × 0.46 = 0.690
Spinach 75 × 0.54 = 0.405
Bread 30.5 × 1.82 = 0.555
Cream pie 162 × 0.93 = 1.507
Farina croquette 107 × 0.76 = 0.813
Syrup 48 × 0.024 = 0.012
Total nitrogen in food 9.736 grams.
Total nitrogen in urine 8.710
Fuel value of the food 2151 calories.
NITROGEN BALANCE.—Schenker.
Nitrogen Taken in. Output.
Nitrogen in Urine. Weight of Fæces (dry).
May 18 10.269 grams. 8.77 grams. 8.0 grams.
19 8.239 8.73 41.0
20 15.545 12.48 26.5
21 9.977 8.76 43.4
22 10.741 9.98 29.0
23 12.167 10.04 14.7
24 9.736 8.71 20.5
11.0
193.4 grams contain 6.50% N.
76.674 67.47 + 12.571 grams nitrogen.
76.674 grams nitrogen. 80.041 grams nitrogen.
Nitrogen balance for seven days = -3.367 grams.
Nitrogen balance per day = -0.481 gram.
Average Intake.
Calories per day 2486.
Nitrogen per day 10.95 grams.
In this seven days’ balance trial, there were taken in with the food 76.674 grams of nitrogen, with an output of 67.47 grams of nitrogen through the urine and 12.571 grams through the fæces, thus showing a minus balance of 3.367 grams of nitrogen for the seven days. The fuel value of the food averaged 2486 calories per day, while the average daily excretion of metabolized nitrogen amounted to 9.63 grams. Schenker’s daily nitrogen excretion for the last two months of the experiment averaged 9.82 grams. Presumably, the slight minus balance of nitrogen was due to the relatively small fuel value of the food, which doubtless was not quite sufficient for the body-weight, and the degree of bodily activity then prevailing.
With G. W. Anderson, a plus balance was obtained as follows:
G. W. ANDERSON.
Wednesday May 18, 1904.
Breakfast.—Banana 103 grams, coffee 150 grams, sugar 42 grams, cream 125 grams, fried rice 45 grams, baked potato 92 grams, roll 65 grams, butter 11 grams.
Lunch.—Soup 150 grams, farina croquette 88 grams, sweet potato 206 grams, string beans 75 grams, bread 62 grams, butter 15.5 grams, coffee 150 grams, sugar 14 grams, cream 30 grams.
Dinner.—Consommé 200 grams, bread 59 grams, butter 20 grams, Hamburg steak 109 grams, mashed potato 150 grams, coffee 200 grams, cream 30 grams, sugar 24 grams, spinach 100 grams, apple pie 150 grams.
Food. Grams. Per cent Nitrogen. Total Nitrogen.
Butter 11 + 15.5 + 20 = 46.5 × 0.15 = 0.070 grams.
Sugar 42 + 24 + 14 = 80.0 × 0.00 = 0.000
Banana 103.0 × 0.23 = 0.237
Cream 125 + 30 + 30 = 185.0 × 0.46 = 0.851
Fried rice 45.0 × 0.75 = 0.338
Roll 65.0 × 1.66 = 1.079
Potato 92.0 × 0.39 = 0.359
Coffee 150 + 150 + 200 = 500.0 × 0.06 = 0.300
Bread 62.0 × 1.60 = 0.992
Soup 150.0 × 0.41 = 0.615
Farina croquette 88.0 × 1.09 = 0.959
Sweet potato 206.0 × 0.32 = 0.659
String beans 75.0 × 0.34 = 0.255
Bread 59.0 × 1.80 = 1.062
Soup (consommé) 200.0 × 0.38 = 0.760
Hamburg steak 109.0 × 3.64 = 3.968
Potato 150.0 × 0.38 = 0.570
Spinach 100.0 × 0.53 = 0.530
Apple pie 150.0 × 0.43 = 0.645
Total nitrogen in food 14.249 grams.
Total nitrogen in urine 8.870
Fuel value of the food 3323 calories.
Thursday, May 19, 1904.
Breakfast.—Banana 170 grams, cream 140 grams, sugar 28 grams, coffee 150 grams, baked potato 127 grams, rolls 47 grams, butter 15 grams.
Lunch.—Bread 50 grams, butter 18 grams, fried potato 150 grams, fried hominy 100 grams, syrup 48 grams, coffee 150 grams, cream 50 grams, sugar 14 grams.
Dinner.—Soup 200 grams, fried sweet potato 70 grams, macaroni 125 grams, spinach 105 grams, bacon 13 grams, butter 15 grams, coffee 150 grams, sugar 14 grams, cream 40 grams.
Food. Grams. Per cent Nitrogen. Total Nitrogen.
Banana 170 × 0.23 = 0.391 grams.
Cream 140 + 50 + 40 = 230 × 0.46 = 1.058
Sugar 28 + 14 + 14 = 56 × 0.00 = 0.000
Butter 15 + 18 + 15 = 48 × 0.15 = 0.072
Rolls 47 × 1.66 = 0.780
Potato 127 × 0.39 = 0.495
Coffee 150 + 150 + 150 = 450 × 0.06 = 0.270
Bread 50 × 1.60 = 0.800
Fried potato 150 × 0.32 = 0.480
Syrup 48 × 0.024 = 0.012
Hominy 100 × 0.67 = 0.670
Bread 46 × 1.74 = 0.800
Soup 200 × 0.53 = 1.060
Fried sweet potato 70 × 0.38 = 0.266
Macaroni 125 × 0.93 = 1.163
Spinach 105 × 0.56 = 0.588
Bacon 13 × 3.00 = 0.390
Total nitrogen in food 9.295 grams.
Total nitrogen in urine 8.360
Fuel value of the food 2932 calories.
Friday, May 20, 1904.
Breakfast.—Orange 70 grams, roll 120 grams, butter 33 grams, coffee 150 grams, sugar 28 grams, cream 50 grams.
Lunch.—Bread 48 grams, butter 19 grams, fish-cake 81 grams, potato 200 grams, lima beans 50 grams, fried hominy 118 grams, syrup 96 grams, coffee 150 grams, cream 50 grams, sugar 14 grams.
Dinner.—Consommé 100 grams, boiled halibut 143 grams, mashed potato 177 grams, string beans 90 grams, stewed cranberry 76 grams, bread 56 grams, butter 16 grams, coffee 150 grams, cream 50 grams, sugar 14 grams.
Food. Grams. Per cent Nitrogen. Total Nitrogen.
Butter 33 + 19 + 16 = 68 × 0.15 = 0.102 grams.
Orange 70 × 0.20 = 0.140
Rolls 120 × 1.72 = 2.064
Coffee 150 + 150 + 150 = 450 × 0.06 = 0.270
Cream 50 + 50 + 50 = 150 × 0.44 = 0.660
Bread 48 × 1.71 = 0.821
Fish-cake 81 × 1.22 = 0.988
Potato 200 × 0.30 = 0.600
Lima beans 50 × 0.76 = 0.380
Fried hominy 118 × 0.57 = 0.673
Syrup 96 × 0.024 = 0.023
Bread 56 × 1.97 = 1.104
Consommé 100 × 0.59 = 0.590
Halibut 143 × 3.18 = 4.547
Mashed potato 177 × 0.34 = 0.602
Sugar 28 + 14 + 14 = 56 × 0.00 = 0.000
String beans 90 × 0.36 = 0.324
Cranberry 76 × 0.03 = 0.023
Total nitrogen in food 13.911 grams.
Total nitrogen in urine 9.950
Fuel value of the food 3052 calories.
Saturday, May 21, 1904.
Breakfast.—Banana 157 grams, roll 61 grams, butter 15 grams, coffee 150 grams, cream 150 grams, sugar 28 grams.
Lunch.—Bread 58 grams, butter 17 grams, lamb chop 33 grams, potato croquettes 138 grams, tomato 161 grams, water ice 162 grams, coffee 150 grams, cream 50 grams, sugar 21 grams.
Dinner.—Soup 75 grams, bread 59 grams, butter 22.5 grams, bacon 15 grams, lettuce salad 64 grams, fried potato 100 grams, stewed prunes 283 grams, coffee 150 grams, cream 50 grams, sugar 14 grams.
Food. Grams. Per cent Nitrogen. Total Nitrogen.
Banana 157.0 × 0.23 = 0.361 grams.
Roll 61.0 × 1.65 = 1.007
Cream 50 + 50 + 50 = 250.0 × 0.43 = 1.075
Butter 15 + 17 + 22.5 = 54.5 × 0.15 = 0.082
Sugar 28 + 21 + 14 = 63.0 × 0.00 = 0.000
Coffee 150 + 150 + 150 = 450.0 × 0.06 = 0.270
Bread 58.0 × 1.82 = 1.056
Lamb chop 33.0 × 4.63 = 1.528
Potato croquettes 138.0 × 0.71 = 0.980
Tomato 161.0 × 0.17 = 0.274
Water ice 162.0 × 0.012 = 0.019
Bread 59.0 × 1.62 = 0.956
Soup 75.0 × 1.21 = 0.908
Bacon 15.0 × 3.05 = 0.458
Prunes 175 + 108 = 283.0 × 0.16 = 0.453
Salad 64.0 × 0.21 = 0.134
Fried potato 100.0 × 0.60 = 0.600
Total nitrogen in food 10.161 grams.
Total nitrogen in urine 8.510
Fuel value of the food 2826 calories.
Sunday, May 22, 1904.
Breakfast.—Orange 80 grams, oatmeal 100 grams, potato 103 grams, butter 16 grams, roll 50 grams, coffee 150 grams, cream 125 grams, sugar 35 grams.
Lunch.—Bread 47 grams, butter 14.5 grams, macaroni 116 grams, potato 150 grams, fried rice 85 grams, syrup 48 grams, ice cream 169 grams, coffee 150 grams, cream 50 grams, sugar 14 grams.
Dinner.—Soup 100 grams, bread 40.5 grams, butter 16 grams, fried potato 50 grams, mashed potato 100 grams, coffee 150 grams, cream 100 grams, sugar 21 grams, strawberry short-cake 214 grams.
Food. Grams. Per cent Nitrogen. Total Nitrogen.
Orange 80 × 0.20 = 0.160 grams.
Butter 16 + 14.5 + 16 = 46.5 × 0.15 = 0.070
Oatmeal 100 × 0.43 = 0.430
Sugar 35 + 14 + 14 + 7 = 70 × 0.00 = 0.000
Potato 103 × 0.40 = 0.412
Cream 125 + 50 + 100 = 275 × 0.45 = 1.238
Roll 50 × 1.67 = 0.835
Coffee 150 + 150 + 150 = 450 × 0.06 = 0.270
Bread 47 × 1.57 = 0.738
Macaroni 116 × 0.46 = 0.534
Potato 150 × 0.30 = 0.450
Fried rice 85 × 0.75 = 0.638
Syrup 48 × 0.024 = 0.012
Ice cream 169 × 0.53 = 0.896
Bread 40.5 × 1.91 = 0.774
Celery soup 100 × 0.33 = 0.330
Fried potato 50 × 0.57 = 0.285
Mashed potato 100 × 0.37 = 0.370
Strawberry short-cake 214 × 0.50 = 1.070
Total nitrogen in food 9.512 grams.
Total nitrogen in urine 6.500
Fuel value of the food 3429 calories.
Monday, May 23, 1904.
Breakfast.—Banana 211 grams, roll 59 grams, butter 15 grams, coffee 150 grams, cream 150 grams, sugar 28 grams.
Lunch.—Consommé 100 grams, bread 63 grams, butter 15 grams, rice 113 grams, syrup 48 grams, sugar 14 grams, fried potato 170 grams, apple sauce 125 grams.
Dinner.—Vegetable soup 100 grams, bread 70 grams, butter 16 grams, bacon 42 grams, potato croquettes 49 grams, macaroni 105 grams, string beans 184 grams, water ice 148 grams.
Food. Grams. Per cent Nitrogen. Total Nitrogen.
Banana 211 × 0.23 = 0.485 grams.
Butter 15 + 15 + 16 = 46 × 0.15 = 0.069
Cream 150 × 0.45 = 0.675
Roll 59 × 1.63 = 0.962
Sugar 28 + 14 = 42 × 0.00 = 0.000
Coffee 150 × 0.06 = 0.090
Bread 63 × 1.64 = 1.033
Consommé 100 × 0.65 = 0.650
Apple sauce 125 × 0.02 = 0.025
Fried rice 113 × 0.61 = 0.689
Syrup 48 × 0.024 = 0.012
Fried potato 170 × 0.60 = 1.020
Bread 70 × 1.75 = 1.225
Vegetable soup 100 × 0.70 = 0.700
Macaroni 105 × 0.87 = 0.914
Bacon 42 × 3.28 = 1.378
Potato croquettes 149 × 0.77 = 1.147
String beans 184 × 0.22 = 0.405
Water ice 148 × 0.006 = 0.009
Total nitrogen in food 11.488 grams.
Total nitrogen in urine 6.900
Fuel value of the food 3057 calories.
Tuesday, May 24, 1904.
Breakfast.—Orange 80 grams, roll 55 grams, butter 16 grams, potato 91 grams, coffee 150 grams, cream 50 grams, sugar 21 grams.
Lunch.—Celery soup 150 grams, bread 62 grams, butter 19 grams, mashed potato 200 grams, farina croquettes 87 grams, syrup 48 grams, stewed prunes 138 grams.
Dinner.—Soup 150 grams, bread 43 grams, butter 15 grams, Hamburg steak 82 grams, fried potato 150 grams, spinach 85 grams, rice croquettes 57 grams, syrup 48 grams, coffee 150 grams, cream 50 grams, sugar 14 grams, lemon pie 125 grams.
Food. Grams. Per cent Nitrogen. Total Nitrogen.
Butter 16 + 19 + 15 = 50 × 0.15 = 0.075 grams.
Orange 80 × 0.20 = 0.160
Roll 55 × 1.64 = 0.902
Potato 91 × 0.25 = 0.228
Coffee 150 + 150 = 300 × 0.06 = 0.180
Cream 50 + 50 = 100 × 0.45 = 0.450
Sugar 21 + 14 = 35 × 0.00 = 0.000
Bread 62 × 1.66 = 1.029
Celery soup 150 × 0.48 = 0.720
Mashed potato 200 × 0.26 = 0.520
Farina croquettes 87 × 0.74 = 0.644
Syrup 48 + 48 = 96 × 0.024 = 0.023
Prunes 138 × 0.17 = 0.235
Soup 150 × 0.19 = 0.285
Bread 43 × 1.82 = 0.783
Hamburg steak 82 × 3.96 = 3.247
Fried potato 150 × 0.46 = 0.690
Spinach 85 × 0.54 = 0.459
Rice croquettes 57 × 0.76 = 0.433
Lemon pie 125 × 0.93 = 1.163
Total nitrogen in food 12.226 grams.
Total nitrogen in urine 8.450
Fuel value of the food 3022 calories.
NITROGEN BALANCE.—G. W. Anderson.
Nitrogen Taken in. Output.
Nitrogen in Urine. Weight of Fæces (dry).
May 18 14.249 grams. 8.87 grams.
19 9.295 8.36
20 13.911 9.95 12.0 grams.
21 10.161 8.51 46.0
22 9.512 6.50 39.0
23 11.488 6.90 67.0
24 12.226 8.45
164.0 grams contain 6.92% N.
80.842 57.54 + 11.349 grams nitrogen.
80.842 grams nitrogen. 68.889 grams nitrogen.
Nitrogen balance for seven days = +11.953 grams.
Nitrogen balance per day = +1.707 grams.
Average Intake.
Calories per day 3091
Nitrogen per day 11.55 grams.
With G. W. Anderson, the balance trial was characterized by an intake of 80.842 grams of nitrogen, with an output for the seven days of 57.54 grams through the urine and 11.349 grams through the fæces, thus making a total excretion of 68.889 grams of nitrogen, and showing a plus balance of 11.953 grams. In other words, the body of this subject, under the conditions prevailing, was storing up nitrogen for future use at the rate of 1.7 grams per day. This also means that a daily intake of 9.8 grams of nitrogen would have been quite sufficient to maintain nitrogen equilibrium, certainly with the large fuel value of the food taken, i. e., 3091 calories per day as the average value.
The average daily excretion of metabolized nitrogen during the balance period amounted to 8.22 grams, while the average daily excretion for the last two months of the experiment was 8.81 grams.
With Stapleton, the following results were obtained, showing a distinct positive balance:
STAPLETON.
Wednesday, May 18, 1904.
Breakfast.—Banana 118 grams, bread 29 grams, butter 11 grams, sugar 56 grams, cream 125 grams.
Lunch.—Tomato soup 247 grams, bread 37 grams, butter 9 grams, croquettes 97 grams, potato 100 grams, string beans 46 grams, coffee 150 grams, cream 50 grams, sugar 21 grams.
Dinner.—Bread 109 grams, butter 40 grams, Hamburg steak 87 grams, potato 150 grams, spinach 100 grams, coffee 150 grams, cream 100 grams, sugar 30 grams, apple pie 110 grams.
Food. Grams. Per cent Nitrogen. Total Nitrogen.
Banana 118 × 0.23 = 0.271 grams.
Butter 11 + 9 + 40 = 60 × 0.15 = 0.090
Bread 29 × 1.66 = 0.481
Sugar 35 + 21 + 30 = 86 × 0.00 = 0.000
Cream 125 + 50 + 100 = 275 × 0.46 = 1.265
Tomato soup 247 × 0.41 = 1.013
Bread 37 × 1.60 = 0.592
Croquettes 97 × 1.09 = 1.057
Sweet potato 100 × 0.32 = 0.320
String beans 46 × 0.34 = 0.156
Coffee 150 + 150 = 300 × 0.06 = 0.180
Bread 109 × 1.80 = 1.962
Hamburg steak 87 × 3.64 = 3.167
Potato 150 × 0.38 = 0.570
Spinach 100 × 0.53 = 0.530
Apple pie 110 × 0.43 = 0.473
Total nitrogen in food 12.127 grams.
Total nitrogen in urine 9.670
Fuel value of the food 3109 calories.
Thursday, May 19, 1904.
Breakfast.—None.
Lunch.—Bread 48 grams, butter 14 grams, omelette 125 grams, boiled onion 63 grams, fried sweet potato 100 grams, coffee 300 grams, cream 150 grams, sugar 56 grams, apple pudding 146 grams.
Dinner.—Tomato soup 200 grams, bread 42 grams, butter 9 grams, macaroni 75 grams, potato 36 grams, spinach 70 grams, bacon 16 grams, coffee 150 grams, cream 50 grams, sugar 21 grams.
Food. Grams. Per cent Nitrogen. Total Nitrogen.
Coffee 300 + 150 = 450 × 0.06 = 0.270 grams.
Butter 14 + 9 = 23 × 0.15 = 0.035
Bread 48 × 1.60 = 0.768
Omelette 125 × 1.58 = 1.975
Onions 63 × 0.27 = 0.170
Sugar 56 + 21 = 77 × 0.00 = 0.000
Cream 150 + 50 = 200 × 0.47 = 0.940
Potato 100 × 0.49 = 0.490
Apple pudding 146 × 0.28 = 0.409
Bread 42 × 1.74 = 0.731
Tomato soup 200 × 0.53 = 1.060
Macaroni 75 × 0.93 = 0.698
Fried sweet potato 36 × 0.38 = 0.137
Spinach 70 × 0.56 = 0.392
Bacon 16 × 3.00 = 0.480
Total nitrogen in food 8.555 grams.
Total nitrogen in urine 8.580
Fuel value of the food 2072 calories.
Friday, May 20, 1904.
Breakfast.—Orange 150 grams, roll 65 grams, coffee 150 grams, cream 50 grams, sugar 35 grams.
Lunch.—Bread 64 grams, butter 18 grams, fish-cake 72 grams, potato 150 grams, lima beans 50 grams, coffee 150 grams, cream 100 grams, sugar 21 grams, bread pudding 150 grams.
Dinner.—Fish 113 grams, string beans 62 grams, potato 150 grams, rice croquettes 102 grams, syrup 48 grams, stewed cranberry 95 grams, bread 33 grams, butter 16 grams, coffee 300 grams, cream 100 grams, sugar 42 grams.
Evening.—Beer 750 grams.
Food. Grams. Per cent Nitrogen. Total Nitrogen.
Orange 150 × 0.20 = 0.300 grams.
Sugar 35 + 21 + 42 = 98 × 0.00 = 0.000
Roll 65 × 1.72 = 1.118
Coffee 150 + 150 + 300 = 600 × 0.06 = 0.360
Cream 50 + 100 + 100 = 250 × 0.44 = 1.100
Bread 64 × 1.71 = 1.094
Butter 18 + 16 = 34 × 0.15 = 0.051
Fish-cake 72 × 1.22 = 0.878
Potato 150 × 0.30 = 0.450
Lima beans 50 × 0.76 = 0.380
Bread pudding 150 × 0.99 = 1.485
String beans 62 × 0.36 = 0.223
Fish 113 × 3.18 = 3.593
Bread 33 × 1.97 = 0.650
Potato 150 × 0.34 = 0.510
Rice croquettes 102 × 1.06 = 1.081
Cranberry 95 × 0.030 = 0.029
Syrup 48 × 0.024 = 0.012
Beer 750 × 0.069 = 0.518
Total nitrogen in food 18.832 grams.
Total nitrogen in urine 9.510
Fuel value of the food 2999 calories.
Saturday, May 21, 1904.
Breakfast.—Banana 74 grams, baked potato 95 grams, roll 71 grams, butter 18 grams, coffee 150 grams, cream 100 grams, sugar 30 grams.
Lunch.—Bread 48 grams, butter 14 grams, lamb chop 27 grams, potato croquette 91 grams, tomato 105 grams, coffee 150 grams, cream 50 grams, sugar 21 grams, water ice 185 grams.
Dinner.—Bean soup 150 grams, fried egg 127 grams, bacon 2 grams, fried potato 108 grams, bread 77 grams, butter 18 grams, coffee 150 grams, cream 50 grams, sugar 21 grams, jelly roll 56 grams.
Evening.—Beer 600 grams.
Food. Grams. Per cent Nitrogen. Total Nitrogen.
Banana 74 × 0.23 = 0.170 grams.
Roll 71 × 1.65 = 1.172
Coffee 150 + 150 + 150 = 450 × 0.06 = 0.270
Sugar 30 + 21 + 21 = 72 × 0.00 = 0.000
Cream 100 + 50 + 50 = 200 × 0.43 = 0.860
Potato 95 × 0.40 = 0.380
Butter 18 + 14 + 18 = 50 × 0.15 = 0.075
Bread 48 × 1.82 = 0.874
Lamb chop 27 × 4.63 = 1.250
Croquette (potato) 91 × 0.71 = 0.646
Tomato 105 × 0.17 = 0.179
Water ice 185 × 0.012 = 0.022
Bread 77 × 1.62 = 1.247
Bean soup 150 × 1.21 = 1.815
Fried egg 127 × 2.27 = 2.883
Bacon 2 × 3.05 = 0.061
Fried potato 108 × 0.60 = 0.648
Jelly roll 56 × 0.86 = 0.482
Beer 600 × 0.069 = 0.414
Total nitrogen in food 13.448 grams.
Total nitrogen in urine 9.640
Fuel value of the food 2871 calories.
Sunday, May 22, 1904.
Breakfast.—Orange 60 grams, oatmeal 150 grams, wheat roll 51 grams, butter 17 grams, coffee 150 grams, cream 100 grams, sugar 49 grams.
Lunch.—Bread 37 grams, butter 13 grams, potato 114 grams, macaroni 115 grams, fried rice 92 grams, coffee 300 grams, cream 100 grams, sugar 42 grams, ice cream 104 grams, cake 37.5 grams.
Dinner.—Chicken 89 grams, spinach 100 grams, fried potato 70 grams, bread 46 grams, butter 12 grams, coffee 150 grams, cream 100 grams, sugar 30 grams, strawberry short-cake 195 grams.
Food. Grams. Per cent Nitrogen. Total Nitrogen.
Roll 51 × 1.67 = 0.852 grams.
Sugar 49 + 42 + 30 = 121 × 0.00 = 0.000
Orange 60 × 0.20 = 0.120
Oatmeal 150 × 0.43 = 0.645
Coffee 150 + 300 + 150 = 600 × 0.06 = 0.360
Cream 100 + 100 + 100 = 300 × 0.45 = 1.350
Butter 17 + 13 + 12 = 42 × 0.15 = 0.063
Potato 114 × 0.30 = 0.342
Macaroni 115 × 0.46 = 0.529
Bread 37 × 1.57 = 0.581
Fried rice 92 × 0.75 = 0.690
Ice cream 104 × 0.53 = 0.551
Cake 37.5 × 1.20 = 0.450
Spinach 100 × 0.55 = 0.550
Chicken 89 × 3.02 = 2.688
Fried potato 70 × 0.57 = 0.399
Bread 46 × 1.91 = 0.879
Short-cake 195 × 0.50 = 0.975
Total nitrogen in food 12.024 grams.
Total nitrogen in urine 9.560
Fuel value of the food 3442 calories.
Monday, May 23, 1904.
Breakfast.—Banana 98 grams, roll 68 grams, butter 15 grams, coffee 150 grams, cream 100 grams, sugar 40 grams.
Lunch.—Bread 53 grams, butter 17.5 grams, boiled eggs 101 grams, apple sauce 130 grams, coffee 150 grams, cream 50 grams, sugar 17 grams.
Dinner.—Bread 28 grams, butter 7 grams, bacon 40 grams, macaroni 62 grams, potato croquette 69 grams, coffee 150 grams, cream 50 grams, sugar 21 grams, water ice 116 grams.
Food. Grams. Per cent Nitrogen. Total Nitrogen.
Banana 98 × 0.23 = 0.225 grams.
Butter 15 + 17.5 + 7 = 39.5 × 0.15 = 0.059
Coffee 150 + 150 + 150 = 450 × 0.06 = 0.270
Cream 100 + 50 + 50 = 200 × 0.45 = 0.900
Sugar 40 + 17 + 21 = 78 × 0.00 = 0.000
Roll 68 × 1.63 = 1.108
Bread 53 × 1.64 = 0.869
Apple sauce 130 × 0.02 = 0.026
Boiled eggs 101 × 2.07 = 2.091
Bread 28 × 1.75 = 0.490
Macaroni 62 × 0.87 = 0.539
Bacon 40 × 3.28 = 1.312
Potato croquette 69 × 0.77 = 0.531
Water ice 116 × 0.006 = 0.007
Total nitrogen in food 8.427 grams.
Total nitrogen in urine 8.030
Fuel value of the food 2346 calories.
Tuesday, May 24, 1904.
Breakfast.—Orange 80 grams, roll 118 grams, butter 23 grams, coffee 150 grams, cream 50 grams, sugar 25 grams.
Lunch.—Soup 100 grams, bread 59 grams, butter 15.5 grams, potato 100 grams, farina croquettes 109 grams, tomato sauce 75 grams, boiled onions 107 grams, stewed prunes 105 grams, coffee 150 grams, cream 100 grams, sugar 18 grams.
Dinner.—Celery soup 150 grams, Hamburg steak 63 grams, potato 100 grams, spinach 50 grams, bread 32 grams, butter 15 grams, coffee 150 grams, cream 50 grams, sugar 16 grams, cream pie 79 grams.
Evening.—Beer 750 grams.
Food. Grams. Per cent Nitrogen. Total Nitrogen.
Roll 118 × 1.64 = 1.935 grams.
Orange 80 × 0.20 = 0.160
Coffee 150 + 150 + 150 = 450 × 0.06 = 0.270
Cream 50 + 100 + 50 = 200 × 0.45 = 0.900
Sugar 25 + 18 + 16 = 59 × 0.00 = 0.000
Butter 23 + 15.5 + 15 = 53.5 × 0.15 = 0.080
Bread 59 × 1.66 = 0.979
Tomato sauce 75 × 0.23 = 0.173
Onions 107 × 0.30 = 0.321
Celery soup 100 × 0.48 = 0.480
Potato 100 × 0.26 = 0.260
Farina croquettes 109 × 0.74 = 0.807
Prunes 105 × 0.17 = 0.179
Hamburg steak 63 × 3.96 = 2.495
Potato 100 × 0.46 = 0.460
Soup 150 × 0.19 = 0.285
Bread 32 × 1.82 = 0.582
Spinach 50 × 0.54 = 0.270
Cream pie 79 × 0.93 = 0.735
Beer 750 × 0.069 = 0.518
Total nitrogen in food 11.889 grams.
Total nitrogen in urine 9.040
Fuel value of the food 2822 calories.
NITROGEN BALANCE.—Stapleton.
Nitrogen Taken in. Output.
Nitrogen in Urine. Weight of Fæces (dry).
May 18 12.127 grams. 9.67 grams. 39.6 grams.
19 8.555 8.58 34.5
20 13.832 9.51 65.3
21 13.448 9.64 17.8
22 12.024 9.56 11.4
23 8.427 8.03 27.7
24 11.889 9.04
196.3 grams contain 7.08% N.
80.302 64.03 + 13.898 grams nitrogen.
80.302 grams nitrogen. 77.928 grams nitrogen.
Nitrogen balance for seven days = +2.374 grams.
Nitrogen balance per day = +0.339 gram.
Average Intake.
Calories per day 2809.
Nitrogen per day 11.47 grams.
With this subject, the total intake of nitrogen for the seven days’ period was 80.302 grams. The output of nitrogen through the urine amounted to 64.03 grams, while 13.898 grams were passed out through the fæces, making a total output of 77.928 grams of nitrogen. This shows a plus balance of 2.374 grams of nitrogen for the seven days, indicating a gain to the body of 0.339 gram per day. The fuel value of the food averaged 2809 calories per day, while the daily excretion of metabolized nitrogen averaged 9.14 grams. This is in close agreement with the average daily excretion of nitrogen through the urine of this subject for the last two months of the experiment, viz., 9.00 grams of nitrogen.
With W. L. Anderson, the following results were obtained:
W. L. ANDERSON.
Wednesday, May 18, 1904.
Breakfast.—Banana 90 grams, fried rice 150 grams, syrup 50 grams, wheat roll 64 grams, butter 11 grams, coffee 150 grams, cream 125 grams, sugar 21 grams.
Lunch.—Tomato soup 247 grams, bread 19 grams, butter 16.5 grams, sweet potato 105 grams, farina croquette 115 grams, syrup 60 grams, coffee 150 grams, milk 50 grams, sugar 14 grams.
Dinner.—Consommé 250 grams, bread 52 grams, butter 20 grams, Hamburg steak 117 grams, boiled potato 150 grams, coffee 150 grams, cream 50 grams, sugar 14 grams.
Food. Grams. Per cent Nitrogen. Total Nitrogen.
Banana 90 × 0.23 = 0.207 grams.
Cream 125 + 50 + 50 = 225 × 0.46 = 1.035
Sugar 21 + 14 + 14 = 49 × 0.00 = 0.000
Coffee 150 + 150 + 150 = 450 × 0.06 = 0.270
Roll 64 × 1.66 = 1.063
Butter 11 + 16.5 + 20 = 47.5 × 0.15 = 0.071
Rice 150 × 0.75 = 1.125
Syrup 50 + 60 = 110 × 0.024 = 0.026
Tomato soup 247 × 0.41 = 1.013
Bread 19 × 1.60 = 0.304
Sweet potato 105 × 0.32 = 0.336
Farina croquette 115 × 1.09 = 1.690
Bread 52 × 1.80 = 0.936
Consommé 250 × 0.38 = 0.950
Hamburg steak 117 × 3.64 = 4.259
Potato 150 × 0.38 = 0.570
Total nitrogen in food 13.855 grams.
Total nitrogen in urine 10.030
Fuel value of the food 2946 calories.
Thursday, May 19, 1904.
Breakfast.—Banana 158 grams, roll 122 grams, butter 15 grams, boiled hominy 150 grams, syrup 48 grams, coffee 150 grams, cream 100 grams, sugar 28 grams.
Lunch.—Bread 50 grams, butter 12 grams, fried hominy 100 grams, syrup 48 grams, boiled onions 80 grams, omelette 60 grams, coffee 150 grams, cream 50 grams, sugar 14 grams.
Dinner.—Tomato soup 200 grams, bread 43 grams, butter 10 grams, potato 50 grams, baked macaroni 202 grams, coffee 150 grams, sugar 14 grams, cream 25 grams.
Food. Grams. Per cent Nitrogen. Total Nitrogen.
Roll 122 × 1.54 = 1.879 grams.
Boiled hominy 150 × 0.20 = 0.300
Butter 15 + 12 + 10 = 37 × 0.15 = 0.056
Banana 158 × 0.23 = 0.363
Sugar 28 + 14 + 14 = 56 × 0.00 = 0.000
Cream 100 + 50 + 25 = 175 × 0.47 = 0.823
Coffee 150 + 150 + 150 = 450 × 0.06 = 0.270
Syrup 48 + 48 = 96 × 0.024 = 0.023
Bread 50 × 1.60 = 0.800
Potato 150 × 0.49 = 0.735
Fried hominy 100 × 0.67 = 0.670
Onions 80 × 0.27 = 0.216
Omelette 60 × 1.58 = 0.948
Tomato soup 200 × 0.53 = 1.060
Bread 43 × 1.74 = 0.748
Potato 50 × 0.38 = 0.190
Baked macaroni 202 × 0.93 = 1.879
Total nitrogen in food 10.960 grams.
Total nitrogen in urine 10.150
Fuel value of the food 3013 calories.
Friday, May 20, 1904.
Breakfast.—Coffee 150 grams, cream 25 grams, sugar 14 grams, roll 70 grams, butter 9 grams.
Lunch.—Potato 100 grams, butter 3 grams, lima beans 50 grams, hominy 69 grams, syrup 48 grams, coffee 150 grams, cream 25 grams, sugar 14 grams.
Dinner.—Consommé 150 grams, bread 28 grams, butter 15 grams, string beans 56 grams, potato 200 grams, rice croquette 65 grams, syrup 48 grams, coffee 150 grams, sugar 14 grams, cream 25 grams.
Evening.—Beer 450 grams.
Food. Grams. Per cent Nitrogen. Total Nitrogen.
Coffee 150 + 150 + 150 = 450 × 0.06 = 0.270 grams.
Cream 25 + 25 + 25 = 75 × 0.44 = 0.330
Sugar 14 + 14 + 14 = 42 × 0.00 = 0.000
Roll 70 × 1.72 = 1.204
Butter 9 + 3 + 15 = 27 × 0.15 = 0.041
Potato 100 × 0.30 = 0.300
Lima beans 50 × 0.76 = 0.380
Fried hominy 69 × 0.57 = 0.393
Syrup 48 + 48 = 96 × 0.024 = 0.023
Consommé 150 × 0.59 = 0.885
String beans 56 × 0.36 = 0.202
Potato 200 × 0.34 = 0.680
Bread 28 × 1.97 = 0.552
Rice croquettes 65 × 1.06 = 0.689
Beer 450 × 0.069 = 0.311
Total nitrogen in food 6.260 grams.
Total nitrogen in urine 8.640
Fuel value of the food 1748 calories.
Saturday, May 21, 1904.
Breakfast.—Banana 73 grams, bread 63 grams, butter 7 grams, coffee 150 grams, cream 50 grams, sugar 28 grams.
Lunch.—Potato 150 grams, tomato 145 grams, fried Indian-meal 81 grams, syrup 48 grams, coffee 150 grams, sugar 21 grams, cream 25 grams, water ice 165 grams.
Dinner.—Bean soup 150 grams, bread 29 grams, butter 16 grams, bacon 15 grams, fried potato 150 grams, cake 36 grams, coffee 150 grams, sugar 14 grams, cream 45 grams.
Evening.—Beer 600 grams.
Food. Grams. Per cent Nitrogen. Total Nitrogen.
Banana 73 × 0.23 = 0.168 grams.
Sugar 28 + 21 + 14 = 63 × 0.00 = 0.000
Cream 50 + 25 + 45 = 120 × 0.43 = 0.516
Bread 63 × 1.65 = 1.040
Butter 7 + 16 = 23 × 0.15 = 0.035
Coffee 150 + 150 + 150 = 450 × 0.06 = 0.270
Potato 150 × 0.71 = 1.065
Tomato 145 × 0.17 = 0.247
Fried Indian-meal 81 × 1.09 = 0.883
Syrup 48 × 0.024 = 0.012
Water ice 165 × 0.012 = 0.020
Bean soup 150 × 1.21 = 1.815
Bread 29 × 1.62 = 0.470
Bacon 15 × 3.05 = 0.458
Fried potato 150 × 0.60 = 0.900
Cake 36 × 0.86 = 0.310
Beer 600 × 0.069 = 0.414
Total nitrogen in food 8.623 grams.
Total nitrogen in urine 8.460
Fuel value of the food 2393 calories.
Sunday, May 22, 1904.
Breakfast.—Oatmeal 200 grams, sugar 28 grams, coffee 150 grams, roll 60 grams, butter 6 grams.
Lunch.—Fried rice 140 grams, syrup 48 grams, potato 100 grams, macaroni 155 grams, boiled onions 80 grams, butter 5 grams, coffee 150 grams, cream 25 grams, sugar 14 grams, ice cream 185 grams, cake 34 grams.
Dinner.—Cream of celery soup 150 grams, mashed potato 134 grams, butter 11 grams, spinach 100 grams, strawberry short-cake 185 grams, cream 70 grams, sugar 28 grams.
Food. Grams. Per cent Nitrogen. Total Nitrogen.
Roll 60 × 1.67 = 1.002 grams.
Oatmeal 200 × 0.43 = 0.860
Sugar 28 + 14 + 28 = 70 × 0.00 = 0.000
Coffee 150 + 150 + 150 = 450 × 0.06 = 0.270
Butter 6 + 5 + 11 = 22 × 0.15 = 0.033
Potato 100 × 0.30 = 0.300
Macaroni 155 × 0.46 = 0.713
Cream 25 + 70 = 95 × 0.45 = 0.428
Onions 80 × 0.25 = 0.200
Fried rice 140 × 0.75 = 1.050
Ice cream 185 × 0.53 = 0.981
Cake 34 × 1.20 = 0.408
Syrup 48 × 0.024 = 0.012
Cream of celery soup 150 × 0.33 = 0.495
Mashed potato 134 × 0.37 = 0.496
Short-cake 185 × 0.50 = 0.925
Spinach 100 × 0.55 = 0.550
Total nitrogen in food 8.723 grams.
Total nitrogen in urine 7.960
Fuel value of the food 2812 calories.
Monday, May 23, 1904.
Breakfast.—Banana 115 grams, wheat griddle cakes 87 grams, syrup 48 grams, butter 7 grams, coffee 150 grams, sugar 28 grams, cream 50 grams.
Lunch.—Fried potato 100 grams, rice croquette 115 grams, syrup 48 grams, apple sauce 125 grams, coffee 150 grams, sugar 14 grams.
Dinner.—Macaroni 270 grams, potato croquette 134 grams, coffee 150 grams, sugar 14 grams, water ice 154 grams.
Food. Grams. Per cent Nitrogen. Total Nitrogen.
Banana 115 × 0.23 = 0.265 grams.
Coffee 150 + 150 + 150 = 450 × 0.06 = 0.270
Sugar 28 + 14 + 14 = 56 × 0.00 = 0.000
Cream 50 × 0.45 = 0.225
Griddle cakes 87 × 0.91 = 0.792
Syrup 48 + 48 = 96 × 0.024 = 0.023
Butter 7 × 0.15 = 0.011
Apple sauce 125 × 0.020 = 0.025
Rice croquette 115 × 0.61 = 0.702
Fried potato 100 × 0.60 = 0.600
Macaroni 270 × 0.87 = 2.349
Potato croquette 134 × 0.77 = 1.032
Water ice 154 × 0.006 = 0.009
Total nitrogen in food 6.303 grams.
Total nitrogen in urine 7.490
Fuel value of the food 2224 calories.
Tuesday, May 24, 1904.
Breakfast.—Fried rice 115 grams, syrup 48 grams, roll 60 grams, butter 14 grams, coffee 150 grams, sugar 14 grams.
Lunch.—Celery soup 150 grams, farina croquette 108 grams, syrup 48 grams, fried potato 200 grams, bread 22 grams, butter 7 grams, coffee 150 grams, sugar 14 grams.
Dinner.—Fried potato 200 grams, cream pie 167 grams, coffee 150 grams, cream 25 grams, sugar 14 grams.
Food. Grams. Per cent Nitrogen. Total Nitrogen.
Fried rice 115 × 0.36 = 0.414 grams.
Coffee 150 + 150 + 150 = 450 × 0.06 = 0.270
Roll 60 × 1.64 = 0.984
Butter 14 + 7 = 21 × 0.15 = 0.032
Sugar 14 + 14 + 14 = 42 × 0.00 = 0.000
Syrup 48 + 48 = 96 × 0.024 = 0.023
Celery soup 150 × 0.48 = 0.720
Farina croquette 108 × 0.74 = 0.799
Fried potato 200 × 0.26 = 0.520
Bread 22 × 1.66 = 0.365
Fried potato 200 × 0.46 = 0.920
Cream pie 167 × 0.93 = 1.553
Cream 25 × 0.45 = 0.113
Total nitrogen in food 6.713 grams.
Total nitrogen in urine 6.600
Fuel value of the food 2324 calories.
NITROGEN BALANCE.—W. L. Anderson.
Nitrogen Taken in. Output.
Nitrogen in Urine. Weight of Fæces (dry).
May 18 13.855 grams. 10.03 grams. 42.3 grams.
19 10.960 10.15
20 6.260 8.64 17.5
21 8.623 8.46
22 8.723 7.96 42.7
23 6.303 7.49 41.0
24 6.713 6.60 29.2
172.7 grams contain 6.30% N.
61.437 59.33 + 10.880 grams nitrogen.
61.437 grams nitrogen. 70.210 grams nitrogen.
Nitrogen balance for seven days = -8.773 grams.
Nitrogen balance per day = -1.253 grams.
Average Intake.
Calories per day 2494.
Nitrogen per day 8.777 grams.
Here, we find a minus balance of 8.773 grams of nitrogen for the seven days’ period. The total intake of nitrogen amounted to 61.437 grams, while there were excreted through the urine 59.33 grams, and through the fæces 10.880 grams of nitrogen, making a total output of 70.210 grams as contrasted with an intake of 61.437 grams of nitrogen. This loss of body material is to be attributed to the small fuel value of the food,—only 2494 calories as the day’s average,—though perhaps in part to the relatively small intake of nitrogen. In this connection it is to be noted that the average daily excretion of metabolized nitrogen for the seven days’ period amounted to only 8.777 grams, while the average daily excretion for the last two months of the experiment was as high as 10.07 grams. Undoubtedly, the subject did not eat as much food during the week of this balance trial as was needed to maintain equilibrium, under the conditions of bodily activity then prevailing.
The same statement applies to Mr. Bellis, whose balance trial likewise shows a deficiency of ingested nitrogen over the nitrogen output. Here, however, the deficiency is more manifestly due to the small fuel value of the daily food, which averaged only 2174 calories. Bellis showed an average daily excretion of metabolized nitrogen amounting to 8.45 grams for the last six weeks of the experiment, while in the balance period the excretion of metabolized nitrogen was 8.19 grams per day. The daily intake of nitrogen in the food, however, averaged only 7.76 grams, obviously too small a quantity to meet the wants of the body, especially with the low fuel value of the food. It is quite plain that during the week of this balance trial, the amount of food consumed was not equal to the necessities of the body, neither was it equal in nitrogen or fuel value to what the subject had been taking during the last few months of the experiment, and on which he had practically maintained body-weight for at least the last month of the experiment. It is further noticeable that during the balance week the body-weight dropped off somewhat.
Owing to the absence of Dr. Callahan from New Haven during this period, no attempt was made to determine experimentally whether he was in nitrogen equilibrium or not.
The following tables give the data in the experiment with Bellis:—
BELLIS.
Wednesday, May 18, 1904.
Breakfast.—Banana 94 grams, wheat roll 53 grams, butter 11 grams, coffee 150 grams, cream 75 grams, sugar 21 grams.
Lunch.—Soup 150 grams, farina croquette 100 grams, syrup 50 grams, string beans 75 grams, fried sweet potato 117 grams, bread 36 grams, butter 7 grams, coffee 150 grams, sugar 14 grams.
Dinner.—Hamburg steak 53 grams, potato 250 grams, spinach 100 grams, bread 55 grams, butter 10 grams, coffee 150 grams, cream 75 grams, sugar 21 grams, apple pie 142 grams.
Food. Grams. Per cent Nitrogen. Total Nitrogen.
Banana 94 × 0.23 = 0.216 grams.
Cream 75 + 75 = 150 × 0.46 = 0.690
Sugar 21 + 14 + 21 = 56 × 0.00 = 0.000
Coffee 150 + 150 + 150 = 450 × 0.06 = 0.270
Roll (wheat) 53 × 1.66 = 0.880
Butter 11 + 7 + 10 = 28 × 0.15 = 0.042
Soup 150 × 0.41 = 0.615
Farina croquette 100 × 1.09 = 1.090
Fried sweet potato 117 × 0.32 = 0.374
String beans 75 × 0.34 = 0.255
Syrup 50 × 0.024 = 0.012
Bread 36 × 1.60 = 0.576
Hamburg steak 53 × 3.64 = 1.929
Potato 250 × 0.38 = 0.950
Spinach 100 × 0.53 = 0.530
Bread 55 × 1.80 = 0.990
Apple pie 142 × 0.43 = 0.611
Total nitrogen in food 10.030 grams.
Total nitrogen in urine 8.350
Fuel value of the food 2686 calories.
Thursday, May 19, 1904.
Breakfast.—Banana 155 grams, roll 53 grams, butter 10 grams, coffee 150 grams, sugar 28 grams, cream 70 grams.
Lunch.—Fried hominy 60 grams, syrup 48 grams, potato 100 grams, boiled onion 82 grams, coffee 150 grams, cream 35 grams, sugar 21 grams, bread pudding 134 grams.
Dinner.—Tomato soup 200 grams, macaroni 75 grams, mashed potato 54 grams, spinach 70 grams, boiled Indian-meal 100 grams, coffee 150 grams, cream 80 grams, sugar 21 grams.
Food. Grams. Per cent Nitrogen. Total Nitrogen.
Roll 53 × 1.54 = 0.816 grams.
Banana 155 × 0.23 = 0.357
Butter 10 × 0.15 = 0.015
Coffee 150 + 150 + 150 = 450 × 0.06 = 0.270
Sugar 28 + 21 + 21 = 70 × 0.00 = 0.000
Cream 70 + 35 + 80 = 185 × 0.47 = 0.870
Potato 100 × 0.49 = 0.490
Fried hominy 60 × 0.67 = 0.402
Boiled onion 82 × 0.27 = 0.221
Bread pudding 134 × 0.28 = 0.375
Syrup 48 × 0.024 = 0.012
Tomato soup 200 × 0.53 = 1.060
Macaroni 75 × 0.93 = 0.698
Mashed potato 54 × 0.38 = 0.205
Spinach 70 × 0.56 = 0.392
Boiled Indian-meal 100 × 0.20 = 0.200
Total nitrogen in food 6.383 grams.
Total nitrogen in urine 9.600
Fuel value of the food 2075 calories.
Friday, May 20, 1904.
Breakfast.—Orange 150 grams, roll 57 grams, butter 17 grams, coffee 159 grams, sugar 14 grams.
Lunch.—Fried farina 74 grams, syrup 48 grams, potato 250 grams, lima beans 50 grams, coffee 150 grams, sugar 14 grams.
Dinner.—Rice croquette 92 grams, syrup 48 grams, string beans 93 grams, mashed potato 352 grams, bread 40 grams, butter 8 grams, coffee 150 grams, sugar 14 grams.
Evening.—Beer 450 grams.
Food. Grams. Per cent Nitrogen. Total Nitrogen.
Orange 150 × 0.20 = 0.300 grams.
Roll 57 × 1.72 = 0.980
Coffee 150 + 150 + 150 = 450 × 0.06 = 0.270
Sugar 14 + 14 + 14 = 42 × 0.00 = 0.000
Butter 17 + 8 = 25 × 0.15 = 0.038
Potato 250 × 0.30 = 0.750
Lima beans 50 × 0.76 = 0.380
Fried farina 74 × 0.57 = 0.422
Syrup 48 + 48 = 96 × 0.024 = 0.023
String beans 93 × 0.36 = 0.335
Bread 40 × 1.97 = 0.788
Mashed potato 352 × 0.34 = 1.197
Rice croquette 92 × 1.06 = 0.975
Beer 450 × 0.069 = 0.311
Total nitrogen in food 6.769 grams.
Total nitrogen in urine 10.670
Fuel value of the food 1980 calories.
Saturday, May 21, 1904.
Breakfast.—Banana 69 grams, baked potato 57 grams, bread 59 grams, butter 8 grams, coffee 150 grams, sugar 14 grams.
Lunch.—Fried Indian-meal 80 grams, syrup 48 grams, potato croquette 152 grams, tomato 147 grams, coffee 150 grams, sugar 14 grams, water ice 163 grams.
Dinner.—Bean soup 150 grams, bacon 13 grams, fried egg 50 grams, fried potato 206 grams, lettuce salad 45 grams, bread 38 grams, butter 8 grams, coffee 150 grams, sugar 14 grams.
Evening.—Beer 600 grams.
Food. Grams. Per cent Nitrogen. Total Nitrogen.
Banana 69 × 0.23 = 0.159 grams.
Bread 59 × 1.65 = 0.974
Coffee 150 + 150 + 150 = 450 × 0.06 = 0.270
Sugar 14 + 14 + 14 = 42 × 0.00 = 0.000
Baked potato 57 × 0.40 = 0.228
Butter 8 + 8 = 16 × 0.15 = 0.024
Potato croquette 152 × 0.71 = 1.079
Tomato 147 × 0.17 = 0.250
Fried Indian-meal 80 × 1.09 = 0.872
Syrup 48 × 0.024 = 0.012
Water ice 163 × 0.012 = 0.020
Bread 38 × 1.62 = 0.616
Bacon 13 × 3.05 = 0.397
Fried egg 50 × 2.27 = 1.135
Bean soup 150 × 1.21 = 1.815
Lettuce salad 45 × 0.21 = 0.095
Fried potato 206 × 0.60 = 1.236
Beer 600 × 0.069 = 0.414
Total nitrogen in food 9.596 grams.
Total nitrogen in urine 8.460
Fuel value of the food 2071 calories.
Sunday, May 22, 1904.
Breakfast.—Orange 100 grams, oatmeal 100 grams, roll 50 grams, butter 8 grams, coffee 150 grams, cream 40 grams, sugar 21 grams.
Lunch.—Macaroni 112 grams, potato 200 grams, onions 143 grams, coffee 150 grams, sugar 7 grams, ice cream 170 grams, cake 31 grams.
Dinner.—Cream of celery soup 150 grams, mashed potato 182 grams, spinach 100 grams, coffee 150 grams, sugar 7 grams, strawberry short-cake 97 grams.
Food. Grams. Per cent Nitrogen. Total Nitrogen.
Orange 100 × 0.20 = 0.200 grams.
Roll 50 × 1.67 = 0.835
Butter 8 × 0.15 = 0.012
Oatmeal 100 × 0.43 = 0.430
Coffee 150 + 150 + 150 = 450 × 0.06 = 0.270
Sugar 21 + 7 + 7 = 35 × 0.00 = 0.000
Cream 40 × 0.45 = 0.180
Macaroni 112 × 0.46 = 0.515
Potato 200 × 0.30 = 0.600
Onions 143 × 0.25 = 0.358
Ice cream 170 × 0.53 = 0.901
Cake 31 × 1.20 = 0.372
Cream of Celery soup 150 × 0.33 = 0.495
Mashed potato 182 × 0.37 = 0.673
Spinach 100 × 0.55 = 0.550
Strawberry short-cake 97 × 0.50 = 0.485
Total nitrogen in food 6.876 grams.
Total nitrogen in urine 7.710
Fuel value of the food 1929 calories.
Monday, May 23, 1904.
Breakfast.—Banana 219 grams, coffee 150 grams, cream 80 grams, sugar 28 grams.
Lunch.—Rice croquette 143 grams, syrup 45 grams, potato 200 grams, coffee 150 grams, sugar 7 grams, apple sauce 250 grams.
Dinner.—Vegetable soup 150 grams, bacon 37 grams, string beans 100 grams, potato 101 grams, macaroni 86 grams, coffee 150 grams, water ice 184 grams.
Food. Grams. Per cent Nitrogen. Total Nitrogen.
Banana 219 × 0.23 = 0.504 grams.
Cream 80 × 0.45 = 0.360
Sugar 28 + 7 = 35 × 0.00 = 0.000
Coffee 150 + 150 + 150 = 450 × 0.06 = 0.270
Apple sauce 250 × 0.02 = 0.050
Rice croquette 143 × 0.61 = 0.872
Syrup 45 × 0.024 = 0.011
Potato 200 × 0.60 = 1.200
Macaroni 86 × 0.87 = 0.748
Vegetable soup 150 × 0.70 = 1.050
Bacon 37 × 3.28 = 1.214
String beans 100 × 0.22 = 0.220
Potato croquette 101 × 0.77 = 0.778
Water ice 184 × 0.006 = 0.011
Total nitrogen in food 7.288 grams.
Total nitrogen in urine 5.980
Fuel value of the food 2226 calories.
Tuesday, May 24, 1904.
Breakfast.—Orange 100 grams, baked potato 138 grams, butter 5 grams, coffee 150 grams, sugar 14 grams.
Lunch.—Celery soup 150 grams, farina croquette 91 grams, syrup 48 grams, boiled onions 110 grams, potato 200 grams, stewed prunes 113 grams.
Dinner.—Tomato soup 150 grams, farina croquette 107 grams, syrup 48 grams, potato 200 grams, spinach 180 grams, cream pie 140 grams.
Food. Grams. Per cent Nitrogen. Total Nitrogen.
Orange 100 × 0.20 = 0.200 grams.
Baked potato 138 × 0.25 = 0.345
Coffee 150 × 0.06 = 0.090
Sugar 14 × 0.00 = 0.000
Butter 5 × 0.15 = 0.008
Boiled onions 110 × 0.30 = 0.330
Celery soup 150 × 0.48 = 0.720
Potato 200 × 0.26 = 0.520
Farina croquette 91 × 0.74 = 0.673
Syrup 48 + 48 = 96 × 0.024 = 0.023
Stewed prunes 113 × 0.17 = 0.192
Spinach 180 × 0.54 = 0.972
Tomato soup 150 × 0.19 = 0.285
Potato 200 × 0.46 = 0.920
Farina croquette 107 × 0.76 = 0.813
Cream pie 140 × 0.93 = 1.302
Total nitrogen in food 7.393 grams.
Total nitrogen in urine 6.610
Fuel value of the food 2254 calories.
NITROGEN BALANCE.—Bellis.
Nitrogen Taken in. Output.
Nitrogen in Urine. Weight of Fæces (dry).
May 18 10.030 grams. 8.35 grams.
19 6.383 9.60
20 6.769 10.67
21 9.596 8.46 51.0 grams.
22 6.876 7.71 46.0
23 7.288 5.98 27.2
24 7.393 6.61 57.5
181.7 grams contain 6.38% N.
54.335 57.38 + 11.592 grams nitrogen.
54.335 grams nitrogen. 68.972 grams nitrogen.
Nitrogen balance for seven days = -14.637 grams.
Nitrogen balance per day = -2.091 grams.
Average Intake.
Calories per day 2174.
Nitrogen per day 7.762 grams.
The Physical Condition of the Subjects.
Having considered the marked decline in the extent of proteid metabolism which these subjects have exhibited for a period of five months, and having shown the possibility of their maintaining body-weight and nitrogen equilibrium on a low proteid intake, coupled with a relatively small amount (low fuel value) of non-nitrogenous food, it is appropriate to consider next their physical condition under this changed mode of living. So much has been written upon the necessity of a rich proteid diet, with a corresponding rate of proteid metabolism, for the maintenance of bodily strength and vigor, that it becomes a question of vital importance to obtain data bearing upon the effect of a lowered proteid intake upon bodily strength. If, as is so widely believed, diminishing the daily proportion of proteid food below the standards set by Voit and other physiologists will result in a weakening of the muscles of the body, in decreasing the strength, vigor, and endurance of the individual, then obviously physiological economy in this direction would in the long run be uneconomical, and indeed injurious. The maintenance of body-weight and of nitrogen equilibrium on a small amount of proteid food would count for little, when compared with a gradual loss of bodily strength and vigor.
It was truly a great surprise when the systematic strength tests applied month after month to the soldiers indicated a marked gain in muscular power, which seemingly increased as the rate of proteid metabolism diminished, coincident with the decrease in the amount of proteid food fed. The dynamometer tests were applied primarily to make sure there was no falling off in strength, and when the marked gains already referred to were recorded, it was thought at first that they must be the result mainly of the systematic training the soldiers were undergoing in the gymnasium. Undoubtedly, this daily training, with the more regular and systematic methods of living, did contribute in some measure to the beneficial results obtained, but as the improvement and general gain in strength became more and more apparent, it was equally clear there were other factors involved than mere training.
The opportunity presented by the present subjects therefore was particularly desirable. These men had been in training for many months, some of them for several years, and naturally had acquired a high degree of proficiency in all kinds of athletic work, in the handling of themselves and in the handling of the apparatus, by use of which the strength tests are made.
The tests, etc., were applied exactly in the same manner as in the case of the soldier detail, description of which will be found on pages 259 and 260.
The following tables give the results of the tests—made at the Yale Gymnasium, and reported by Dr. Anderson—from January to June, for the eight men. It will be noted, however, that the record of Mr. Bellis is incomplete. This was owing to an injury to his hand, which prevented his working with the apparatus during the months of May and June.
The results presented by these tables are very important and suggestive. Every man, without exception, showed a decided improvement in his muscular power as measured by the strength tests. With many of the men the gain was progressive, with others there was noticeable—as in the case of W. L. Anderson and G. W. Anderson in the March test—a drop in some one test. This could generally be explained by some temporary cause. Thus, the March test taken by W. L. Anderson was at a time when he was under great strain in connection with an intercollegiate meet, etc. However, it is clear from the figures presented that all these men, though living on a greatly reduced amount of proteid food, and with certainly no increase in the quantity of non-nitrogenous food, showed at the end of the experiment a decided gain in muscular power. Note for example the great gain in strength shown by Schenker; in January his dynamometer tests, etc., indicated a total of 5728, while at the close of the experiment in June his record was 7135. Again, Bellis increased from 5993 to 8165, and W. L. Anderson from 6016 to 9472. Further, the men all agree in the good effect the changed conditions have had upon them, and they have, without exception, been able to do their athletic work and maintain their athletic supremacy.
STRENGTH OR DYNAMOMETER TESTS.
Anderson, G. W.
Weight. Lung Capacity. Right Hand. Left Hand. Chest. Back. Legs. Pull up. Push up. Vault and Ladder. Run. Product. Total.
Jan. 20 163 500 108 97 85 425 900 8 11 E 1.05 3300 4913
Feb. 20 163 535 109 105 70 380 570 10 14 E 1.07 3972 5206
Mar. 20 159 530 110 103 75 410 720 10 9 E 1.07 3021 4439
Apr. 20 161 500 101 97 85 490 810 13 11 1.05 3864 5387
May 26 159 532 120 100 80 475 885 9 15 3816 5476
June 17 157 530 100 90 80 530 840 12 14 4082 5722
Anderson, W. L.
Jan. 20 139 420 95 88 145 410 625 13 20 E 0.48 4553 6016
Feb. 20 136 440 95 80 137 550 560 15 25 E 0.45 5520 6942
Mar. 20 135 430 95 85 140 510 570 11 15 E 0.47 3510 4890
Apr. 20 138 460 93 75 165 650 730 12 30 1.04 5806 7519
May 26 134 450 90 70 155 570 880 25 31 7504 9267
June 17 137 450 95 85 160 600 860 30 26 7672 9472
Bellis.
Jan. 20 180 550 130 130 155 550 825 10 13 E 1.06 4653 5993
Feb. 20 174 500 155 135 135 580 925 11 15 E 1.08 4615 6445
Mar. 20 176 550 150 135 155 500 900 12 20 E 1.08 5728 7568
Apr. 20 177 510 160 150 150 560 1111 13 21 6035 8165
Callahan.
Jan. 20 204 565 105 110 145 450 620 2 1 D 1.20 724 2154
Feb. 20 193 560 120 120 145 440 590 4 3 F 1.18 1365 2780
Mar. 20 185 565 125 115 145 420 650 5 4 E 1.15 1692 3142
Apr. 20 181 580 120 120 145 530 685 5 4 1.16 1629 3229
June 18 184 120 115 140 520 890 7 5 1.14 2208 3983
Donahue.
Jan. 20 142 320 95 100 74 330 500 12 12 E 1.04 3480 4584
Feb. 20 136 345 105 115 95 340 490 13 14 E 1.04 3753 4905
Mar. 20 137 400 110 95 100 340 710 15 16 E 1.06 4309 5664
May 1 138 420 95 80 115 360 650 17 16 4554 5854
May 26 137 425 103 90 135 430 570 17 16 4589 5917
Jacobus.
Jan. 20 126 350 97 93 96 250 300 14 14 E 1.00 3712 4548
Feb. 20 124 380 97 97 75 460 470 15 15 E 1.02 3683 4883
Mar. 20 125 370 95 95 80 430 490 15 15 E 1.03 3810 5000
May 2 124 350 85 90 100 350 510 15 14 1.03 3610 4740
May 26 125 360 95 95 110 360 600 14 17 3875 5135
June 16 125 375 95 85 120 400 700 15 19 4267 5667
Schenker.
Jan. 20 161 485 112 90 135 410 440 14 14 E 1.06 4771 5728
Feb. 20 159 490 115 90 125 530 730 14 15 E 1.07 4748 6338
Mar. 20 158 500 100 95 120 550 780 15 15 E 1.12 4830 6475
Apr. 20 164 490 90 90 127 410 580 17 15 1.10 5248 6545
May 26 159 500 125 105 155 470 850 16 15 1.08 5104 6809
June 9 160 500 110 110 155 570 910 17 16 5280 7135
Stapleton.
Jan. 20 170 520 105 105 155 455 570 11 12 E 1.21 3961 5351
Feb. 20 167 520 105 110 160 550 690 6 10 E 1.22 2704 4319
Mar. 20 170 500 100 100 145 350 600 7 12 E 3268 4563
Apr. 20 162 500 100 105 155 410 670 9 14 3726 5886
May 26 164 515 100 95 150 470 770 12 20 5248 6833
Naturally, in the case of these men the gain in strength recorded cannot be assigned to systematic training. The only change in their mode of living which can in any sense be considered as responsible for the improvement is the change in diet. The main fact to be emphasized, however, is that these men—trained athletes, accustomed to living on relatively large amounts of proteid food—for a period of five months reduced their intake of proteid food more than fifty per cent without loss of bodily strength, but, on the contrary, with a marked improvement in their muscular power.
Most striking is this gain in strength when compared with the very marked decline in the rate of proteid metabolism. Thus, in the case of Jacobus, the excretion of metabolized nitrogen was reduced to 7.43 grams per day as the average for the last two months of the experiment, yet his strength test showed an increase from 4548 in January to 5667 for June. Further, it must be recalled that an excretion of 7.43 grams of nitrogen means the metabolism of only 46.4 grams of proteid matter. Similarly, in the case of Donahue, a very active man whose work on the Varsity basket-ball team called for vigorous exercise, his strength test rose from 4584 to 5917 on a daily diet which led to the metabolism of only 7.39 grams of nitrogen per day, or about 46 grams of proteid matter. Further, Donahue frequently referred to the far greater freedom from fatigue he experienced on the low proteid diet, and he was clearly conscious of a distinct improvement in his physical condition.
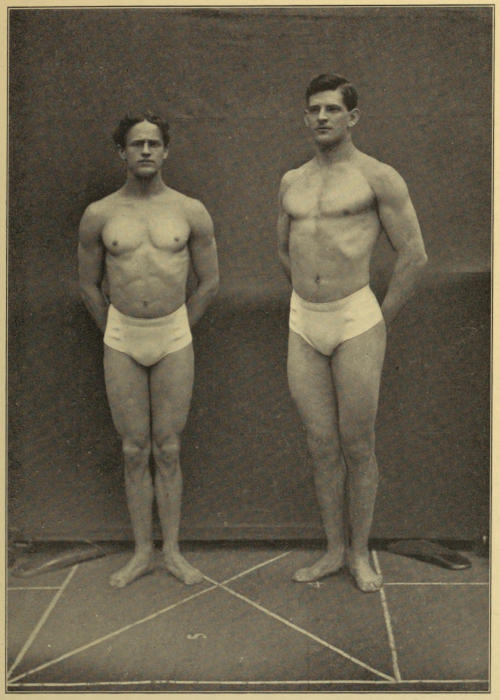
W. L. ANDERSON BELLIS
Photographs taken prior to the experiment.
The following letter from Dr. Anderson, the Director of the Yale Gymnasium, gives his estimate of the men at the end of the first three months of the experiment:
Yale University Gymnasium, New Haven, Conn., April 12, 1904.
Professor Russell H. Chittenden, Director of the Sheffield Scientific School, Yale University.
Dear Sir,—Herewith find a brief report of the physical condition and ability of the eight Yale students who are taking the special diet while engaged in active exercise.
These men, with one exception, Dr. Callahan, are experts in their special lines of avocation.
Mr. G. W. Anderson is a foot-ball, base-ball, and basket-ball player, as well as a crew man (not Varsity), well built and an all round athlete.
Mr. W. L. Anderson, a “Y” athlete (hurdler), the captain of the Yale Gymnastic Team, University Gymnastic Champion, and American Collegiate Gymnastic Champion.
Mr. H. S. Bellis, a member of the Y. G. A., a gymnast and acrobat and in constant training.
Dr. W. H. Callahan, Medical Assistant at the Gymnasium, in daily practice in the gymnasium; bowling, hand-ball, and running.
Mr. M. Donahue, a very muscular and versatile athlete, a foot-ball player and a Varsity basket-ball player.
Mr. C. S. Jacobus, a “Y” athlete, a noted long-distance man, and one of the best University runners.
Mr. H. R. Schenker, an active member of the Y. G. A., a point winner and intercollegiate competitor in gymnastics.
Mr. John Stapleton, a wrestler and gymnast. A professional, a man of large body and great strength.
These eight men are in constant practice and in the “pink of condition.” They were in “training form” when they began the changed diet. All have lost in weight, especially Dr. Callahan, who has dropped from 204 pounds to 185 pounds in two months. Dr. Callahan is not an athlete, but is a vigorous worker in the gymnasium, being in daily and constant practice. He is liberally supplied with adipose tissue and can well afford to drop in weight.
As to the loss of weight in the other cases, it would not be wise to attribute this to the diet alone. We find that most athletes who represent the University in the big contests lose in body-weight, but I attribute this loss as much to worry and responsibility as to strict bodily activity.
These students are in a different class from the soldiers, first, because they are well educated young men, secondly, because their development was towards a specific end, the attainment of strength and skill as representative Yale athletes, and thirdly, on account of college requirements of fifteen hours per week, which time stands for study and laboratory attendance aside from the recitations. We have here a double drain on the body energy. All mental work is expensive, hence the demand upon the corporeal machinery has been very constant and strenuous.
I notice little change in the condition of the men over that of a year ago, when I had most of them with me and under like physical training.
In the case of W. L. Anderson, captain of the Yale Gymnastic Association, there was a noticeable falling off in the strength tests in February and March, but I believe the worry incident to the intercollegiate contests, the steady training, and the business cares of the Association went far towards producing a fatigued state. W. L. Anderson is only a freshman in the Medical School; he did his studying at night, and this combined with his youth doubtless caused the loss of weight as much as any change in diet. He has shown the same symptoms before this year. At this writing he is in good physical condition. I speak with certainty in his case because I have had good opportunity to study him at home. It was while under the restricted diet that he won both championships, these being the Collegiate and All-around Intercollegiate Championship of America.[44]
Schenker won points for the first time in the intercollegiate contests while on the diet; he showed no falling off, rather to the contrary, made a steady gain in ability.
Jacobus complained of a pain in his side but in spite of this he has entered a number of events, has kept up his training and is in good condition. Jacobus is a long-distance runner; great endurance is required for these events, and this endurance he has kept up. He tells me his stomach is in better condition than it has been during his three years of work at Yale.
Donahue has steadily improved in ability. He has kept his position on the Varsity Basket Ball Team, and has put up strong and aggressive games, and says he is as well as ever.
Stapleton shows no falling off at all. He keeps up wrestling, which is a drastic exercise; he works at heavy gymnastics and gains steadily.
One matter must be reported in reference to the strength tests. The first trial was made when all members of the squad were present. College men are very sensitive to competition, hence the great exertion put forth. The other trials were made when the men were by themselves. The “spur” was missing.
I have watched the efforts of these men with interest and care, especially as two of them live in my own family. I fail to see any falling off in strength, the case of W. L. Anderson excepted. The fellows report being in satisfactory shape and claim that the “ups and downs” are no more in evidence this year than in the past.
These picked men, representing several kinds of competitive sports, have gained in ability and skill on the more limited diet they are now using, and are not showing any signs of deterioration from the diminished intake of proteid food. I pronounce them, from a physical standpoint, in good shape.
Respectfully yours,
(Signed) William G. Anderson.
It must be remembered that this letter from Dr. Anderson was written after the March strength test was taken, and prior to the test of April 20. Dr. Anderson was not in New Haven at the close of the experiment, consequently it was not possible to obtain his estimate of the men at that date, but there can be no question that there was a distinct improvement from the middle of April to the middle of June; certainly as marked as the improvement from the beginning of the experiment in January, to April 12, the date of Dr. Anderson’s letter.
Finally, attention may be called to the photographs of Messrs. Stapleton, Bellis, and W. L. Anderson, which are introduced primarily to show the physical makeup and muscular development of the men composing this student group. The photographs of Stapleton were taken in April, 1904, after he had been under experiment for three months. The photographs of Bellis and W. L. Anderson were taken prior to the experiment. They all afford a good illustration of the highly developed muscular mechanism of different types, with a corresponding adaptability for different lines of muscular effort.
Reaction Time.
Through the courtesy and kind co-operation of Dr. Charles H. Judd, in charge of the Yale Psychological Laboratory, these students were subjected to the same careful tests during the five months of their experiment as were applied to the soldier detail. The results which are presented in the following report, kindly prepared by Dr. Judd, indicate quite clearly that there was no general nervous change in the reactors as a result of the low proteid diet. The data presented by Dr. Judd in this connection will be found in the accompanying tables, which, while indicating no noticeable improvement in the nervous condition of the men, make it quite plain that no deterioration whatever occurred as the result of the lowered proteid metabolism.
Report on Reaction.
Reaction tests with the group of University students were conducted in essentially the same way as were the reaction tests with the soldiers. Details in regard to the method and apparatus employed need not be repeated. They can be found on pages 274 to 276.
Two new tests were added to the regular reaction determinations. One of these consisted in taking a record of the number of taps which could be executed in ten seconds. The reactor was seated before a table on which was fastened a telegraph key. He held the key between his thumb and first two fingers, and at a given signal began tapping as rapidly as possible until told to stop. Each time he tapped he closed an electric circuit. The current thus made was carried through a marker which indicated on a smoked paper each make and break at the key. A time line from a rod vibrating at the rate of once every twentieth of a second was traced on the smoked paper parallel with the marker record. By a comparison of the time line with the marker record, it was easy to determine the number of taps made in ten seconds. At first, the number of taps per second were counted, but the results showed such uniformity from second to second on a given day that only the net results for the whole ten seconds are given in the tables.
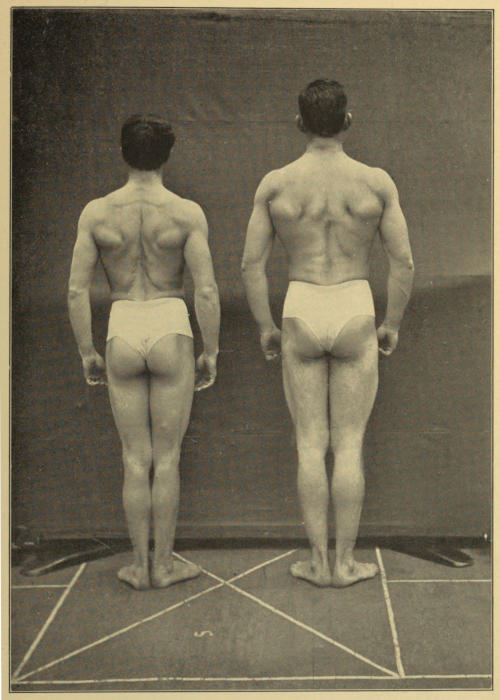
W. L. ANDERSON BELLIS
Photographs taken prior to the experiment.
The second test added to the reaction tests was undertaken to determine the steadiness of the subjects. Two brass rods 40 cm. long were held in a vertical position at a distance of 7 mm. from each other. The subject took in his right hand a brass rod 40 cm. long and 5 mm. in diameter and tried to pass the end of this rod up and down between the vertical rods without touching them. The subject’s relation to the vertical rods may be further defined by saying that he stood directly in front of them and reached out nearly at arm’s length. The vertical rods were at about the height of his chest. In order to get a record of the accuracy with which the subject moved the hand-rod up and down without touching the vertical rods, the vertical rods and the hand-rod were connected with the two poles of an electric circuit. Whenever they touched they closed the circuit, and a marker placed in the same circuit recorded the fact on a smoked paper record. The time was recorded in parallel with this record, so that any long continued contact could be measured. For the most part, contacts were only of very brief duration. In reporting the results of this test, every contact made while passing the rod once downward and once upward is counted as at least one. Continued contacts are recorded as two, three or more, according to the period of duration. Where there are such added counts because of continued contacts, a second quantity is given in the tables after the first. This second quantity, which is enclosed in parenthesis, indicates merely the number of contacts without reference to whether they are long or short.
No special comments are necessary to explain the tables. Tables 1-5 report in sigmas, or thousandths of a second, the average time of ten reactions on the date, and for the subject, indicated. In the third column, is the mean variation for the series of ten reactions.
Table 6 shows the general averages by the month for a given individual, and in the sixth column the general average of all the determinations for each reactor. The fourth column in each of the earlier tables shows how much the results of a given day vary from the final general average. All the tables give, at the bottom, group averages whenever the full series is present.
Table 7 gives the number of taps executed in ten seconds at each successive test. The dates are not given in detail, but are the same as those of the reaction tests.
Table 8 gives the monthly averages of taps.
Table 9 presents the results of the steadiness tests.
The three sets of results, namely, those from reaction, tapping, and steadiness, differ from each other. On the whole, the reactions grow longer; the tapping varies, but shows neither decided improvement nor deterioration; while steadiness improves very decidedly.
The comment made on the results obtained with the soldiers applies here so far as the reaction tests are concerned. These tests were not repeated with sufficient frequency to reduce the reaction to automatic performance.
The tapping is such a simple performance that improvement is not to be expected. The absence of any general improvement or deterioration argues for an absence of any general nervous change in the reactors.
The improvement in steadiness is in part at least, probably in very large measure, due to the fact that the subjects became more familiar with the test and approached it with less of the embarrassment which attends a new and unfamiliar test.
The lengthening of the reaction times indicates a less intense concentration of the subject upon the work in hand. The slightest relaxation of attention puts the subject behind in responding to the signal. It was clear to superficial observation, especially in certain individual cases, that the subject was giving less attention in the later experiments. This lack of concentration is not obviously related to the changes in diet. Indeed, the fact that no corresponding falling off appears in the tapping would seem to argue that the lack of attention in the reaction tests was not due to deep-seated nervous conditions, so much as to growing impatience on the part of the reactors with the ordeal of being tested. The tapping experiment is less likely to be affected by lack of interest on the part of the subject, because here the subject is called upon to be constantly active, and there is no such opportunity for attention to lapse as is furnished by the intervals which intervene between successive reactions. The tapping is accordingly perhaps the best series on which to base final judgment as to the nervous condition of the men. Here, there appear the variations which show in any ordinary series, but there is no steady improvement through growing familiarity with the test, nor any laxness of attention to produce relatively unfavorable results.
Mr. Steele and Dr. McAllister are largely responsible for the actual collection of the data on which this report is based.
(Signed) C. H. Judd.
TABLE 1.—February, 1904.
Name. Date Avg. M.V. Var. from G.A. Date Avg. M.V. Var. from G.A.
I. Anderson, G. W. 19 153.5 13.8 31.4 26 192.2 19.4 7.3
II. Anderson, W. L. 18 261.0 82.5 32.5 27 293.6 71.0 65.1
III. Bellis 16 189.3 40.0 8.2 26 182.3 18.5 0.5
IV. Donahue 17 173.6 43.0 28.4 24 182.7 14.5 19.3
V. Jacobus 17 197.3 14.7 27.6 24 178.2 18.3 46.7
VI. Schenker 17 162.3 29.7 67.6 24 209.8 46.6 20.1
VII. Stapleton 19 185.1 31.6 23.9
Group averages 188.8
VIII. Callahan* 18 156.2 10.4 37.0 25 210.8 27.2 17.6
TABLE 2.—March, 1904.
Name. Date Avg. M.V. Var. from G.A. Date Avg. M.V. Var. from G.A. Date Avg. M.V. Var. from G.A. Date Avg. M.V. Var. from G.A.
I. Anderson G. W. 11 181.6 38.3 3.3 18 181.3 25.1 3.6 26 170.5 26.1 14.4
II. Anderson, W. L. 8 235.4 50.4 69.0 10 207.3 32.2 21.2 17 189.3 41.3 39.2
III. Bellis 8 174.0 44.4 7.8 15 180.8 21.8 1.0 22 193.5 16.5 11.7 29 181.0 8.5 0.8
IV. Donahue 2 201.6 24.8 0.4 9 214.7 29.3 12.7 23 224.9 53.7 22.9
V. Jacobus 2 207.5 14.4 17.4 9 189.9 11.9 35.0 16 239.6 41.0 14.7 23 196.7 27.2 28.2
VI. Schenker 2 283.5 98.0 53.6 9 296.9 74.9 67.0 16 281.9 80.8 52.9
VII. Stapleton 4 211.1 41.7 2.1 11 205.4 14.6 3.6
Group averages 210.9
VIII. Callahan 3 202.0 23.9 8.8 10 197.0 29.0 3.8 17 200.9 23.0 7.7 24 179.9 20.6 13.3
TABLE 3.—April, 1904.
Name. Date Avg. M.V. Var. from G.A. Date Avg. M.V. Var. from G.A.
I. Anderson, G. W. 22 202.8 10.6 17.9 29 182.9 6.7 2.0
II. Anderson, W. L. 29 195.0 20.3 33.5
III. Bellis 19 193.0 27.2 11.2 26 182.5 18.2 0.7
IV. Donahue 20 198.4 7.0 3.6 27 191.6 37.6 10.4
V. Jacobus 20 253.1 70.7 28.2 27 221.3 14.7 3.6
VI. Schenker 21 229.4 33.0 0.5 28 250.1 78.3 20.2
VII. Stapleton 29 217.1 30.5 8.1
Group averages 205.8
VIII. Callahan 21 205.5 12.5 12.3
TABLE 4.—May, 1904.
Name. Date Avg. M.V. Var. from G.A. Date Avg. M.V. Var. from G.A. Date Avg. M.V. Var. from G.A. Date Avg. M.V. Var. from G.A.
I. Anderson, G. W. 13 181.2 16.5 3.7 20 199.6 8.2 14.7 27 190.7 12.1 5.8
II. Anderson, W. L. 10 202.1 12.1 26.4 24 246.4 34.9 17.9
III. Bellis 10 185.5 19.4 3.7 18 185.8 3.4 4.0 24 171.3 10.3 10.5
IV. Donahue 18 217.2 18.0 15.2 25 207.1 19.5 5.1
V. Jacobus 4 240.6 42.4 15.7 11 234.2 40.0 9.3 18 235.5 39.6 10.6 25 245.4 29.7 20.5
VI. Schenker 5 214.3 24.0 15.6 19 234.3 40.5 4.4 26 196.9 16.9 33.0
VII. Stapleton 11 224.4 15.9 15.4 18 201.1 11.7 7.9 25 217.8 16.5 8.8
Group averages 210.8
TABLE 5.—June, 1904.
Name. Date Avg. M.V. Var. from G.A.
I. Anderson, G. W. 3 197.4 16.8 12.5
II. Anderson, W. L. 7 226.8 20.3 1.7
III. Bellis 7 162.0 8.4 19.8
IV. Donahue 1 208.4 31.7 6.4
V. Jacobus 1 284.6 45.6 59.7
VI. Schenker 3 228.6 43.3 1.3
VII. Stapleton 7 210.4 34.2 1.4
Group averages 216.9
TABLE 6.
Name. February. March. April. May. June. General Avg. of all Tests.
Avg. of all Tests for the Month.
I. Anderson, G. W. 177.9 177.8 192.9 190.5 197.4 184.9
II. Anderson, W. L. 277.3 210.7 195.0 224.3 226.8 228.5
III. Bellis 185.8 182.3 187.8 178.5 162.0 181.8
IV. Donahue 178.1 213.4 195.0 212.2 208.4 202.0
V. Jacobus 187.8 208.4 237.2 238.9 284.6 224.9
VI. Schenker 186.1 200.7 239.8 215.2 228.6 229.9
VII. Stapleton 185.0 208.3 217.1 214.4 210.4 209.0
Monthly averages 196.8 200.2 209.3 210.6 216.9
VIII. Callahan 183.5 194.9 205.5 193.2
TABLE 7.
Name. February. March. April. May. June.
No. of taps in 10 sec.
I. Anderson, G. W. 88 78 64 76 72 78 72 78 71 72 76 75.0
II. Anderson, W. L. 81 86 76 84 77 83 78 85 78 80.9
III. Bellis 84 90 78 78 80 76 78 69 80 78 67 72 78.0
IV. Donahue 80 89 81 83 85 86 85 90 86 88 85.3
V. Jacobus 70 82 75 77 72 76 77 78 75 90 75 80 74 77.3
VI. Schenker 62 65 70 64 64 66 63 67 66 70 65 65.6
VII. Stapleton 87 68 71 77 81 79 77 74 77.1
Group averages 78.8 74.4 75.3 76.7 75.4
VIII. Callahan 82 75 89 83 78 88 86 83
TABLE 8.
Name. February. March. April. May. June.
Avg. of all Determinations for the Month.
I. Anderson, G. W. 83 71 75 74 76
II. Anderson, W. L. 84 79 83 81 78
III. Bellis 87 78 69 74 72
IV. Donahue 85 83 85 90 88
V. Jacobus 76 74 78 80 74
VI. Schenker 64 66 65 69 74
VII. Stapleton 87 70 79 78 74
Monthly averages 81 74 76 81 75
VIII. Callahan 79 85 86
TABLE 9.
Name. February. March. April. May. June.
Date. Date. Date. Date. Date. Date. Date.
I. Anderson, G. W. 19 34 (28) 11 27 (23) 26 20 (17) 29 20 (15) 20 15 (13) 3 5
II. Anderson, W. L. 27 48 (37) 10 72 (59) 17 49 (41) 10 26 (19) 7 12 (9)
III. Bellis 16 57 (43) 8 43 (37) 29 30 (24) 26 40 (24) 18 23 (18) 7 16 (12)
IV. Donahue 17 45 (40) 2 27 (21) 23 35 (30) 27 24 (22) 25 18 (16) 1 9
V. Jacobus 17 37 (30) 9 76 (63) 16 35 (31) 20 24 (20) 11 27 (18) 25 20 (15) 1 18 (14)
VI. Schenker 17 75 (66) 9 67 (58) 21 63 (54) 19 45 (39) 3 30 (24)
VII. Stapleton 19 44 (33) 11 32 (26) 29 30 (22) 16 11 (10) 7 0
VIII. Callahan 18 29 (26) 17 24 (20)
General Summary.
It is quite evident from a study of the results obtained in the foregoing experiments that young, vigorous men of the type under observation, trained in athletics, accustomed to the doing of vigorous muscular work, can satisfy all the true physiological needs of their bodies and maintain their physical strength and vigor, as well as their capacity for mental work, with an amount of proteid food equal to one-half, or one-third, that ordinarily consumed by men of this stamp. As the results show, all these men reduced their rate of proteid metabolism in such degree that the amount of nitrogen excreted daily during the period of the experiment averaged 8.8 grams, implying a metabolism of about 55 grams of proteid matter per day.
In other words, these athletes were able to reduce their nitrogenous metabolism to as low a level as many of the men of the professional group and of the soldier group, and this with not only maintenance of health and strength, but with a decided increase in their muscular power.
Metabolized nitrogen per kilo of body-weight for all these men, with one exception, during the experiment amounted to 0.108 to 0.134 gram per day, fully as low as was obtained with the members of the soldier detail on their prescribed diet. It is clear, therefore, that physiological economy in nutrition is as safe for men in athletics as for men not accustomed to vigorous exercise. There is obviously no physiological ground for the use of such quantity of proteid food, or of total nutrients, as the prevalent dietary standards call for.
The athlete, as well as the less active man (physically), or the professional man, can meet all his ordinary requirements with an intake of proteid food far below the quantities generally consumed, and this without increasing in any measure the amount of non-nitrogenous food.