II. EXPERIMENTS WITH VOLUNTEERS FROM THE HOSPITAL CORPS OF THE UNITED STATES ARMY. (continued 2)
Reading edition
Finally, it should be said that the low proteid metabolism on which these men were apparently maintaining body-weight was not associated with any increase of non-nitrogenous food. At no time did the fuel value of the daily food reach 3000 calories; in fact, about January 12 the average fuel value of the food was only a little over 2000 calories per day.
First Nitrogen Balance.
Early in January, the body-weight of the men having become practically stationary and the proteid metabolism, as measured by the output of metabolized nitrogen, having been reduced to a low level, an attempt was made to see if the men were truly in a condition of nitrogenous equilibrium. A six-day period was used, during which all the food for each meal was carefully analyzed, the nitrogen in every sample of food being determined in duplicate by the Kjeldahl-Gunning process. The fæces of the period were separated by lampblack, given at appropriate times in gelatin capsules, and all necessary precautions observed to insure an accurate nitrogen balance. The accompanying tables of results give all the necessary data.
The average nitrogen intake per day was 8.23 grams, and the average fuel value of the food per day was 2078 calories. These are the figures for Oakman. With some of the other men there were slight variations from these figures, as shown in the tables—owing to slight variations in diet. Without exception, all the men showed a minus balance, indicating that on this diet the body was losing nitrogen. In other words, the diet as a whole was insufficient for the needs of the body in every case. Whether this was due to lack of sufficient proteid or to an insufficient amount of fat and carbohydrate, i. e., a too low fuel value, cannot be said definitely, but there is every reason to believe that the amount of non-nitrogenous food was insufficient to furnish the requisite fuel value, and consequently body proteid was drawn upon to supply the deficiency. The loss of nitrogen to the body per day varied as a rule from 0.5 to 2.0 grams. In one case only, viz., Broyles, was there a close approach to a balance. In his case there was a minus balance of only 0.12 gram of nitrogen per day.
The average daily output of nitrogen through the urine for this six-days period (Oakman’s case) was 7.52 grams.
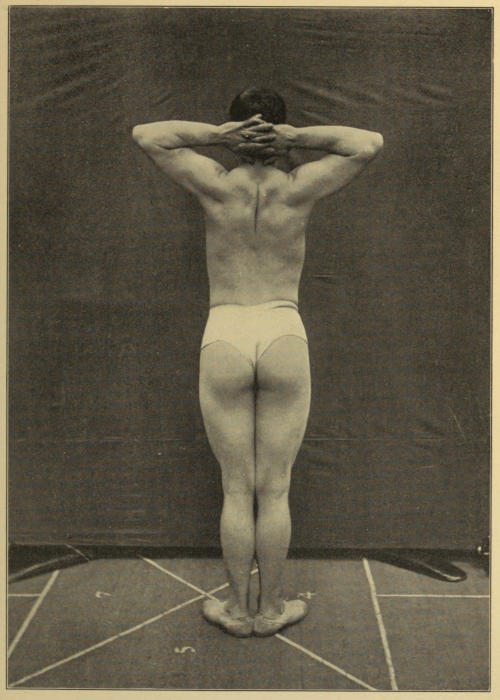
FRITZ
Photograph taken at the close of the experiment.
OAKMAN.
Tuesday, January 12, 1904.
Breakfast.—Fried Indian-meal 100 grams, syrup 50 grams, one cup coffee 350 grams, bread 50 grams, butter 15 grams.
Dinner.—Boiled macaroni 250 grams, stewed tomato 250 grams, bread 75 grams, one cup coffee 350 grams.
Supper.—Potato chips 100 grams, fried bacon 25 grams, bread 75 grams, jam 75 grams, one cup tea 350 grams.
Food. Grams. Per cent Nitrogen. Total Nitrogen.
Fried Indian-meal 100 × 0.38 = 0.380 gram.
Syrup 50 × 0.051 = 0.025
Coffee (breakfast) 350 × 0.075 = 0.262
Butter 15 × 0.10 = 0.015
Macaroni 250 × 0.53 = 1.325
Stewed tomato 250 × 0.15 = 0.375
Bread 50 + 75 + 75 = 200 × 1.48 = 2.960
Potato chips 100 × 1.09 = 1.090
Bacon 25 × 3.13 = 0.780
Jam 75 × 0.039 = 0.029
Tea 350 × 0.067 = 0.234
Coffee (dinner) 350 × 0.091 = 0.318
Total nitrogen in food 7.793 grams.
Total nitrogen in urine 6.000
Fuel value of the food 2404 calories.
Wednesday, January 13, 1904.
Breakfast.—Boiled rice 150 grams, milk 125 grams, sugar 30 grams, butter 10 grams, bread 30 grams, one cup coffee 350 grams.
Dinner.—Hamburg steak with plenty of bread, fat, and onions chopped together 150 grams, boiled potato 200 grams, apple sauce 200 grams, bread 75 grams, one cup coffee 350 grams.
Supper.—Fried rice 100 grams, syrup 50 grams, one cup tea 350 grams, bread 50 grams, butter 15 grams.
Food. Grams. Per cent Nitrogen. Total Nitrogen.
Boiled rice 150 × 0.36 = 0.540 grams.
Milk 125 × 0.55 = 0.687
Sugar 30 × 0.00 = 0.000
Butter (breakfast) 10 × 0.10 = 0.010
Bread (breakfast) 30 × 1.66 = 0.498
Coffee (breakfast) 350 × 0.066 = 0.231
Hamburg steak, etc. 150 × 2.80 = 4.200
Potato 200 × 0.29 = 0.580
Apple sauce 200 × 0.067 = 0.134
Bread (dinner) 75 × 1.66 = 1.245
Coffee (dinner) 350 × 0.076 = 0.266
Fried rice 100 × 0.50 = 0.500
Syrup 50 × 0.051 = 0.025
Tea 350 × 0.066 = 0.231
Bread (supper) 50 × 1.66 = 0.830
Butter 15 × 0.10 = 0.015
Total nitrogen in food 9.992 grams.
Total nitrogen in urine 7.330
Fuel value of the food 2133 calories.
Thursday, January 14, 1904.
Breakfast.—Boiled hominy 150 grams, milk 125 grams, sugar 30 grams, butter 10 grams, bread 30 grams, one cup coffee 350 grams.
Dinner.—Split pea soup (thick) 200 grams, bread 75 grams, mashed potato 100 grams, pickles 30 grams, one cup coffee 350 grams, pie 120 grams.
Supper.—Suet pudding 150 grams, apple sauce 125 grams, crackers 25 grams, one cup tea 350 grams.
Food. Grams. Per cent Nitrogen. Total Nitrogen.
Boiled hominy 150 × 0.21 = 0.315 gram.
Milk 125 × 0.52 = 0.650
Sugar 30 × 0.00 = 0.000
Butter 10 × 0.10 = 0.010
Bread (breakfast) 30 × 1.59 = 0.477
Coffee (breakfast) 350 × 0.096 = 0.336
Split pea soup 200 × 0.69 = 1.380
Bread (dinner) 75 × 1.59 = 1.192
Mashed potato 100 × 0.31 = 0.310
Pickles 30 × 0.054 = 0.016
Coffee (dinner) 350 × 0.075 = 0.262
Pie 120 × 0.50 = 0.600
Suet pudding 150 × 0.78 = 1.170
Apple sauce 125 × 0.058 = 0.072
Crackers 25 × 1.61 = 0.402
Tea 350 × 0.063 = 0.220
Total nitrogen in food 7.412 grams.
Total nitrogen in urine 8.290
Fuel value of the food 2000 calories.
Friday, January 15, 1904.
Breakfast.—Wheat griddle cakes 200 grams, syrup 50 grams, one cup coffee 350 grams.
Dinner.—Codfish-balls (4 parts potato, 1 part fish, fried in pork fat) 150 grams, stewed tomato 200 grams, bread 75 grams, one cup coffee 350 grams, apple pie 95 grams.
Supper.—Apple fritters 200 grams, stewed prunes 125 grams, bread 50 grams, butter 15 grams, one cup tea 350 grams.
Food. Grams. Per cent Nitrogen. Total Nitrogen.
Wheat griddle cakes 200 × 0.78 = 1.560 grams.
Syrup 50 × 0.051 = 0.025
Coffee (breakfast) 350 × 0.075 = 0.262
Codfish-balls, etc. 150 × 1.77 = 2.655
Stewed tomato 200 × 0.14 = 0.280
Bread (dinner) 75 × 1.59 = 1.192
Coffee (dinner) 350 × 0.075 = 0.262
Apple pie 95 × 0.40 = 0.380
Apple fritters 200 × 0.40 = 0.800
Stewed prunes 125 × 0.15 = 0.187
Bread (supper) 50 × 1.59 = 0.795
Butter 15 × 0.10 = 0.015
Tea 350 × 0.042 = 0.147
Total nitrogen in food 8.560 grams.
Total nitrogen in urine 7.140
Fuel value of the food 2030 calories.
Saturday, January 16, 1904.
Breakfast.—Soft oatmeal 150 grams, milk 100 grams, sugar 30 grams, bread 30 grams, butter 10 grams, one cup coffee 350 grams.
Dinner.—Baked macaroni with a little cheese 200 grams, stewed tomato 200 grams, bread 50 grams, tapioca-peach pudding 150 grams, one cup coffee 350 grams.
Supper.—French fried potato 100 grams, fried bacon 20 grams, bread 75 grams, jam 75 grams, one cup tea 350 grams.
Food. Grams. Per cent Nitrogen. Total Nitrogen.
Soft oatmeal 150 × 0.27 = 0.405 grams.
Milk 100 × 0.44 = 0.440
Sugar 30 × 0.00 = 0.000
Bread (breakfast) 30 × 1.61 = 0.483
Butter 10 × 0.10 = 0.010
Coffee (breakfast) 350 × 0.075 = 0.262
Baked macaroni, etc. 200 × 0.72 = 1.440
Stewed tomatoes 200 × 0.15 = 0.300
Bread (dinner) 50 × 1.61 = 0.805
Tapioca-peach pudding 150 × 0.087 = 0.130
Coffee (dinner) 350 × 0.093 = 0.325
French fried potato 100 × 0.47 = 0.470
Fried bacon 20 × 3.15 = 0.630
Bread (supper) 75 × 1.61 = 1.207
Jam 75 × 0.039 = 0.029
Tea 350 × 0.099 = 0.346
Total nitrogen in food 7.282 grams.
Total nitrogen in urine 8.230
Fuel value of the food 1824 calories.
Sunday, January 17, 1904.
Breakfast.—Boiled Indian-meal 125 grams, milk 125 grams, sugar 30 grams, butter 10 grams, bread 30 grams, one cup coffee 350 grams.
Dinner.—Bean soup (thick) 200 grams, bread 75 grams, mashed potato 100 grams, pickles 25 grams, one cup coffee 350 grams, custard pie 105 grams.
Supper.—Crackers 50 grams, butter 15 grams, stewed prunes 125 grams, sponge cake 100 grams, one cup tea 350 grams.
Food. Grams. Per cent Nitrogen. Total Nitrogen.
Boiled Indian-meal 125 × 0.24 = 0.300 grams.
Milk 125 × 0.50 = 0.625
Sugar 30 × 0.00 = 0.000
Butter (breakfast) 10 × 0.10 = 0.010
Bread (breakfast) 30 × 1.61 = 0.483
Coffee (breakfast) 350 × 0.087 = 0.304
Bean soup 200 × 0.86 = 1.720
Bread (dinner) 75 × 1.61 = 1.207
Mashed potato 100 × 0.28 = 0.280
Pickles 25 × 0.054 = 0.013
Coffee (dinner) 350 × 0.081 = 0.283
Custard pie 105 × 0.88 = 0.924
Crackers 50 × 1.61 = 0.805
Butter (supper) 15 × 0.10 = 0.015
Stewed prunes 125 × 0.17 = 0.212
Sponge cake 100 × 1.00 = 1.000
Tea 350 × 0.048 = 0.168
Total nitrogen in food 8.349 grams.
Total nitrogen in urine 8.140
Fuel value of the food 2081 calories.
NITROGEN BALANCE.—Oakman.
Nitrogen Taken in. Output.
Nitrogen in Urine. Weight of Fæces (dry).
Jan. 12 7.793 grams. 6.00 grams.
13 9.992 7.33
14 7.412 8.29 5.0 grams.
15 8.560 7.14 76.0
16 7.282 8.23 13.5
17 8.349 8.14 9.5
104.0 grams contain 7.39% N.
49.388 45.13 + 7.685 grams nitrogen.
49.388 grams nitrogen. 52.815 grams nitrogen.
Nitrogen balance for six days = -3.427 grams.
Nitrogen balance per day = -0.571 gram.
Average Intake.
Calories per day 2078.
Nitrogen per day 8.23 grams.
NITROGEN BALANCE.—Loewenthal.
Nitrogen Taken in. Output.
Nitrogen in Urine. Weight of Fæces (dry).
Jan. 12 7.793 grams. 7.33 grams.
13 9.992 7.64 21 grams.
14 7.388 6.21 26
15 8.560 8.18 52
16 7.282 7.92 37
17 8.349 7.26 11
147 grams contain 6.97% N.
49.364 44.54 + 10.24 grams nitrogen.
49.364 grams nitrogen. 54.78 grams nitrogen.
Nitrogen balance for six days = -5.416 grams.
Nitrogen balance per day = -0.902 gram.
Daily diet same as Oakman’s, except that a smaller amount of coffee was taken at breakfast on the 14th. Nitrogen correction made accordingly.
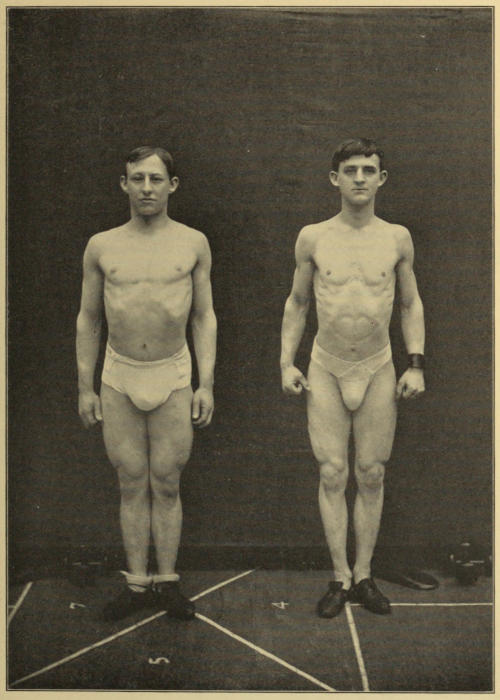
COFFMAN STELTZ
Photographs taken at the close of the experiment.
NITROGEN BALANCE.—Steltz.
Nitrogen Taken in. Output.
Nitrogen in Urine. Weight of Fæces (dry).
Jan. 12 7.793 grams. 4.61 grams. 15.0 grams.
13 9.463 7.90 34.0
14 7.412 4.99 21.0
15 8.560 9.05 31.5
16 7.282 7.56 33.0
17 8.349 8.55 18.0
152.5 grams contain 6.52% N.
48.859 42.66 + 9.94 grams nitrogen.
48.859 grams nitrogen. 52.60 grams nitrogen.
Nitrogen balance for six days = -3.741 grams.
Nitrogen balance per day = -0.623 gram.
Daily diet same as Oakman’s, except on January 13, when 8 grams of boiled rice were uneaten at breakfast and 100 grams of fried rice at supper. Correction in nitrogen-content made accordingly.
NITROGEN BALANCE.—Bates.
Nitrogen Taken in. Output.
Nitrogen in Urine. Weight of Fæces (dry).
Jan. 12 7.706 grams. 7.46 grams.
13 9.916 7.03
14 7.375 7.13 36 grams.
15 8.439 8.04 30
16 7.226 7.66 34
17 8.349 7.38 34
134 grams contain 7.17% N.
49.011 44.70 + 9.61 grams nitrogen.
49.011 grams nitrogen. 54.31 grams nitrogen.
Nitrogen balance for six days = -5.299 grams.
Nitrogen balance per day = -0.883 gram.
Daily diet same as Oakman’s, with the following exceptions:
Jan. 12 Supper: 8 grams Potato chips, uneaten.
13 Dinner: 113 ” Apple sauce, ”
14 ” 50 ” Coffee, ”
15 Supper: 81 ” Prunes, ”
16 Breakfast: 75 ” Coffee, ”
NITROGEN BALANCE.—Coffman.
Nitrogen Taken in. Output.
Nitrogen in Urine. Weight of Fæces (dry).
Jan. 12 7.793 grams. 8.82 grams.
13 9.992 8.28
14 7.412 8.30 57.00 grams.
15 8.560 7.91 41.25
16 7.282 7.32 47.00
17 8.349 7.44 21.50
166.75 grams contain 6.66% N
49.388 48.07 + 11.10 grams nitrogen.
49.388 grams nitrogen. 59.17 grams nitrogen.
Nitrogen balance for six days = -9.782 grams.
Nitrogen balance per day = -1.630 grams.
Daily diet same as Oakman’s.
NITROGEN BALANCE.—Fritz.
Nitrogen Taken in. Output.
Nitrogen in Urine. Weight of Fæces (dry).
Jan. 12 7.793 grams. 8.99 grams.
13 9.992 6.49
14 7.412 10.26 64.0 grams.
15 8.560 7.97 29.5
16 7.282 5.20 62.0
17 8.186 9.40 31.0
186.5 grams contain 6.49% N.
49.225 48.31 + 12.10 grams nitrogen.
49.225 grams nitrogen. 60.41 grams nitrogen.
Nitrogen balance for six days = -11.185 grams.
Nitrogen balance per day = -1.864 grams.
Daily diet same as Oakman’s, except that on the 17th inst. a portion of the prunes was uneaten. Correction made accordingly.
NITROGEN BALANCE.—Henderson.
Nitrogen Taken in. Output.
Nitrogen in Urine. Weight of Fæces (dry).
Jan. 12 7.639 grams. 7.68 grams.
13 9.794 8.22
14 7.487 8.24
15 8.560 7.76 45 grams.
16 7.068 7.56 26
17 8.045 7.87 22
93 grams contain 6.45% N.
48.593 47.33 + 6.00 grams nitrogen.
48.593 grams nitrogen. 53.33 grams nitrogen.
Nitrogen balance for six days = -4.737 grams.
Nitrogen balance per day = -0.789 gram.
Daily diet same as Oakman’s, except that on several days smaller amounts of coffee and tea were taken. Corrections made accordingly.
NITROGEN BALANCE.—Morris.
Nitrogen Taken in. Output.
Nitrogen in Urine. Weight of Fæces (dry).
Jan. 12 7.255 grams. 4.19 grams.
13 9.573 7.92
14 7.325 7.91 4.75 grams.
15 8.638 7.44 38.00
16 7.282 7.38 71.00
17 8.349 5.28 53.00
166.75 grams contain 6.45% N.
48.322 40.12 + 10.75 grams nitrogen.
48.322 grams nitrogen. 50.87 grams nitrogen.
Nitrogen balance for six days = -2.548 grams.
Nitrogen balance per day = -0.424 gram.
Daily diet same as Oakman’s except that on the first three days smaller amounts of tea and coffee were taken. Corrections made accordingly.
NITROGEN BALANCE.—Zooman.
Nitrogen Taken in. Output.
Nitrogen in Urine. Weight of Fæces (dry).
Jan. 12 7.466 grams. 11.31 grams.
13 9.992 11.63
14 7.412 9.38
15 8.560 8.44 27.5 grams.
16 7.282 8.89 28.5
17 8.349 8.99 13.0
69.0 grams contain 6.46% N.
49.061 58.64 + 4.45 grams nitrogen.
49.061 grams nitrogen. 63.09 grams nitrogen.
Nitrogen balance for six days = -14.029 grams.
Nitrogen balance per day = -2.338 gram.
Daily diet same as Oakman’s, except that on January 12th 30 grams potato chips were not eaten. Nitrogen intake corrected accordingly.
NITROGEN BALANCE.—Sliney.
Nitrogen Taken in. Output.
Nitrogen in Urine. Weight of Fæces (dry).
Jan. 12 6.501 grams. 5.94 grams. 22.5 grams.
13 9.975 8.44 26.0
14 7.388 7.42 22.5
15 8.560 7.89 24.0
16 7.282 7.23 13.0
17 8.349 8.15 15.0
123.0 grams contain 6.72% N.
48.055 45.07 + 8.26 grams nitrogen.
48.055 grams nitrogen. 53.33 grams nitrogen.
Nitrogen balance for six days = -5.275 grams.
Nitrogen balance per day = -0.879 gram.
Daily diet same as Oakman’s, except that on the 12th 190 grams stewed tomatoes and 190 grams macaroni were uneaten; on the 13th at breakfast 25 grams of coffee were left, and on the 14th at breakfast 25 grams coffee were not taken. Corrections in intake of nitrogen made accordingly.
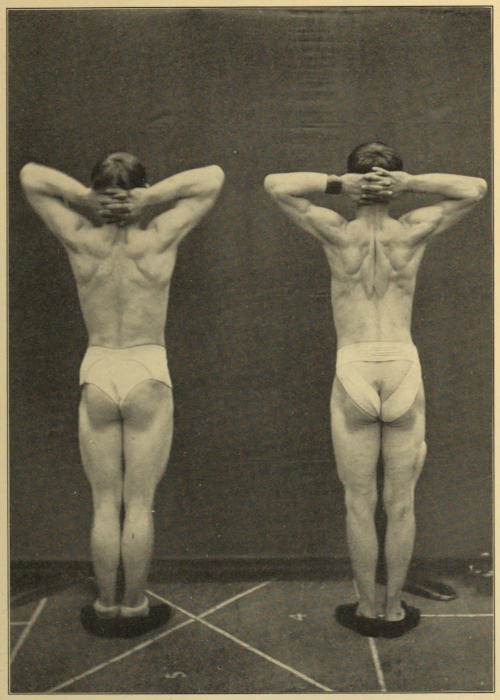
COFFMAN STELTZ
Photographs taken at the close of the experiment.
NITROGEN BALANCE.—Cohn.
Nitrogen Taken in. Output.
Nitrogen in Urine. Weight of Fæces (dry).
Jan. 12 7.793 grams. 6.49 grams.
13 9.957 9.10 29.0 grams.
14 7.412 7.33 8.5
15 8.320 8.04 44.0
16 7.282 8.58 19.0
17 8.349 7.44 5.5
106.0 grams contain 6.48% N.
49.113 46.98 + 6.87 grams nitrogen.
49.113 grams nitrogen. 53.85 grams nitrogen.
Nitrogen balance for six days = -4.737 grams.
Nitrogen balance per day = -0.789 gram.
Daily diet same as Oakman’s, except that on the 15th inst. at supper 60 grams fritters were uneaten, and on the 13th at breakfast 30 grams coffee, and at dinner 22 grams apple sauce were uneaten. Corrections made accordingly.
NITROGEN BALANCE.—Broyles.
Nitrogen Taken in. Output.
Nitrogen in Urine. Weight of Fæces (dry).
Jan. 12 7.475 grams. 5.38 grams.
13 9.495 6.99
14 6.814 7.47
15 8.036 9.67 35 grams.
16 6.695 7.65 14
17 7.762 5.28 20
69 grams contain 6.61% N.
46.277 42.44 + 4.56 grams nitrogen.
46.277 grams nitrogen. 47.00 grams nitrogen.
Nitrogen balance for six days = -0.723 gram.
Nitrogen balance per day = -0.120 gram.
Daily diet same as Oakman’s, except that each day coffee was omitted from breakfast and dinner. Corrections made accordingly.
Second Nitrogen Balance.
Commencing February 29, a second nitrogen balance was attempted with very different results. This balance period extended through seven days and was characterized by an average daily intake of 9.50 grams of nitrogen, an increase of 1.3 grams of nitrogen per day over the preceding period, together with an average fuel value of the food equal to 2500 calories per day.
The daily diet with its content of nitrogen, etc., is detailed under Oakman. Any variations (only slight ones) from this diet are indicated on the individual balance-sheets, corrections being made in the nitrogen intake.
In all of the men, with one exception, a distinct plus balance is seen, showing that under the conditions of this experiment the men were all storing up nitrogen. The plus balance per day varied from 0.132 gram to 1.231 grams of nitrogen.
The average daily output of nitrogen through the urine for this seven days’ period (Oakman’s case) was 7.24 grams, being 0.28 gram less per day than in the preceding period. Sliney, the one man who failed to show a positive balance, was apparently losing nitrogen at the rate of 0.48 gram per day during this period.
All of the individual data are shown in the accompanying tables of results:
OAKMAN.
Monday February 29, 1904.
Breakfast.—Boiled rice 175 grams, milk 125 grams, sugar 25 grams, baked potato 150 grams, one cup coffee 350 grams, butter 10 grams.
Dinner.—Baked spaghetti 250 grams, mashed potato 250 grams, bread 75 grams, boiled tomato 150 grams, apple pie 112 grams, one cup coffee 350 grams.
Supper.—Biscuit 175 grams, fried bacon 20 grams, fried sweet potato 150 grams, butter 20 grams, one cup tea 350 grams.
Food. Grams. Per cent Nitrogen. Total Nitrogen.
Boiled rice 175 × 0.34 = 0.595 grams.
Milk 125 × 0.55 = 0.687
Sugar 25 × 0.00 = 0.000
Baked potato 150 × 0.34 = 0.510
Coffee (breakfast) 350 × 0.082 = 0.287
Butter 10 + 20 = 30 × 0.16 = 0.480
Spaghetti 250 × 0.73 = 1.825
Mashed potato 250 × 0.30 = 0.750
Bread 75 × 1.61 = 1.207
Tomato 150 × 0.16 = 0.240
Apple pie 112 × 0.46 = 0.515
Biscuit 175 × 1.21 = 2.117
Fried bacon 20 × 3.80 = 0.760
Fried sweet potato 150 × 0.22 = 0.330
Tea 350 × 0.06 = 0.210
Coffee (dinner) 350 × 0.11 = 0.385
Total nitrogen in food 10.466 grams.
Total nitrogen in urine 6.880
Fuel value of the food 2670 calories.
Tuesday, March 1, 1904.
Breakfast.—Fried rice 150 grams, syrup 50 grams, baked potato 150 grams, butter 10 grams, one cup coffee 350 grams.
Dinner.—Thick pea soup 250 grams, boiled onions 150 grams, boiled sweet potato 150 grams, bread 75 grams, butter 20 grams, one cup coffee 350 grams.
Supper.—Celery-lettuce-apple salad 120 grams, crackers 32 grams, American cheese 20 grams, Saratoga chips 79 grams, one cup tea 350 grams, rice custard 100 grams.
Food. Grams. Per cent Nitrogen. Total Nitrogen.
Fried rice 150 × 0.34 = 0.510 grams.
Syrup 50 × 0.00 = 0.000
Baked potato 150 × 0.33 = 0.495
Butter 10 + 20 = 30 × 0.16 = 0.048
Coffee (breakfast) 350 × 0.042 = 0.147
Pea soup 250 × 0.54 = 1.350
Boiled onions 150 × 0.27 = 0.405
Boiled sweet potato 150 × 0.13 = 0.195
Bread 75 × 1.65 = 1.237
Coffee (dinner) 350 × 0.084 = 0.294
Salad 120 × 0.14 = 0.168
Crackers 32 × 1.50 = 0.480
Cheese 20 × 3.92 = 0.784
Saratoga chips 79 × 1.22 = 0.963
Tea 350 × 0.054 = 0.189
Rice custard 100 × 0.56 = 0.560
Total nitrogen in food 7.825 grams.
Total nitrogen in urine 7.420
Fuel value of the food 2279 calories.
Wednesday, March 2, 1904.
Breakfast.—Wheat griddle cakes 200 grams, syrup 50 grams, butter 10 grams, one cup coffee 350 grams, banana 75 grams.
Dinner.—Boiled salt mackerel 25 grams, boiled potato 250 grams, boiled turnip 150 grams, bread 75 grams, one cup coffee 350 grams, apple sauce 150 grams.
Supper.—Chopped fresh cabbage with salt, pepper, and vinegar 100 grams, bread 75 grams, butter 20 grams, chocolate cake 150 grams, cranberry sauce 100 grams, one cup tea 350 grams.
Food. Grams. Per cent Nitrogen. Total Nitrogen.
Griddle cakes 200 × 0.80 = 1.600 grams.
Syrup 50 × 0.00 = 0.000
Butter 10 + 20 = 30 × 0.16 = 0.048
Coffee (breakfast) 350 × 0.066 = 0.231
Banana 75 × 0.20 = 0.150
Mackerel 25 × 3.92 = 0.980
Boiled potato 250 × 0.27 = 0.675
Boiled turnip 150 × 0.071 = 0.106
Bread 75 + 75 = 150 × 1.63 = 2.445
Coffee (dinner) 350 × 0.066 = 0.231
Apple sauce 150 × 0.048 = 0.072
Cabbage 100 × 0.28 = 0.280
Chocolate cake 150 × 0.95 = 1.425
Cranberry sauce 100 × 0.045 = 0.045
Tea 350 × 0.057 = 0.199
Total nitrogen in food 8.487 grams.
Total nitrogen in urine 7.580
Fuel value of the food 2391 calories.
Thursday, March 3, 1904.
Breakfast.—Boiled hominy 175 grams, milk 125 grams, sugar 25 grams, baked potato 150 grams, butter 10 grams, one cup coffee 350 grams.
Dinner.—Hamburg steak with much bread, fat, and onions 150 grams, boiled potato 250 grams, bread 75 grams, butter 10 grams, one cup coffee 350 grams.
Supper.—Tapioca-peach pudding 250 grams, bread 75 grams, jam 75 grams, butter 20 grams, one cup tea 350 grams.
Food. Grams. Per cent Nitrogen. Total Nitrogen.
Boiled hominy 175 × 0.19 = 0.330 grams.
Milk 125 × 0.40 = 0.500
Sugar 25 × 0.00 = 0.000
Baked potato 150 × 0.28 = 0.420
Butter 10 + 10 + 20 = 40 × 0.16 = 0.064
Coffee (breakfast) 350 × 0.075 = 0.262
Hamburg steak 150 × 2.12 = 3.180
Boiled potato 250 × 0.27 = 0.675
Bread 75 + 75 = 150 × 1.48 = 2.220
Coffee (dinner) 350 × 0.093 = 0.325
Tapioca-peach pudding 250 × 0.22 = 0.550
Jam 75 × 0.034 = 0.025
Tea 350 × 0.057 = 0.199
Total nitrogen in food 8.750 grams.
Total nitrogen in urine 6.850
Fuel value of the food 2375 calories.
Friday, March 4, 1904.
Breakfast.—Fried hominy 150 grams, syrup 50 grams, baked potato 150 grams, one cup coffee 350 grams, butter 10 grams.
Dinner.—Codfish-balls (1 part fish, 4 parts potatoes, fried in pork fat) 150 grams, stewed tomato 200 grams, stewed potato 150 grams, bread 75 grams, one cup coffee 350 grams, apple pie 130 grams.
Supper.—French fried potato 200 grams, fried sausage 50 grams, butter 10 grams, bread 50 grams, stewed prunes 125 grams, sponge cake 35 grams, one cup tea 350 grams.
Food. Grams. Per cent Nitrogen. Total Nitrogen.
Fried hominy 150 × 0.32 = 0.480 grams.
Syrup 50 × 0.00 = 0.000
Baked potato 150 × 0.37 = 0.555
Coffee (breakfast) 350 × 0.099 = 0.346
Butter 10 + 10 = 20 × 0.16 = 0.032
Fish-balls 150 × 1.73 = 2.595
Stewed tomato 200 × 0.19 = 0.380
Bread 75 + 50 = 125 × 1.54 = 1.925
Coffee (dinner) 350 × 0.069 = 0.241
Apple pie 130 × 0.38 = 0.494
French fried potato 200 × 0.49 = 0.980
Sausage 50 × 2.75 = 1.375
Prunes 125 × 0.17 = 0.212
Sponge cake 35 × 0.83 = 0.290
Tea 350 × 0.072 = 0.252
Stewed potato 150 × 0.18 = 0.270
Total nitrogen in food 10.427 grams.
Total nitrogen in urine 7.950
Fuel value of the food 2374 calories.
Saturday, March 5, 1904.
Breakfast.—Boiled Indian-meal 200 grams, milk 125 grams, sugar 25 grams, one cup coffee 350 grams, fried sweet potato 150 grams, butter 10 grams.
Dinner.—Tomato soup, thick with potatoes and onions boiled together 325 grams, bread 100 grams, scrambled eggs 50 grams, mashed potato 150 grams, one cup coffee 350.
Supper.—Bread pudding with raisins 250 grams, stewed peaches 150 grams, bacon 20 grams, French fried potato 150 grams, bread 50 grams, butter 10 grams, one cup tea 350 grams.
Food. Grams. Per cent Nitrogen. Total Nitrogen.
Boiled Indian-meal 200 × 0.20 = 0.400 gram.
Milk 125 × 0.52 = 0.650
Sugar 25 × 0.00 = 0.000
Coffee (breakfast) 350 × 0.10 = 0.350
Fried sweet potato 150 × 0.22 = 0.330
Butter 10 + 10 = 20 × 0.16 = 0.032
Tomato soup 325 × 0.10 = 0.325
Bread 100 + 50 = 150 × 1.57 = 2.355
Scrambled eggs 50 × 2.22 = 1.110
Mashed potato 150 × 0.25 = 0.375
Coffee (dinner) 350 × 0.075 = 0.262
Bread pudding 250 × 0.80 = 2.000
Stewed peaches 150 × 0.24 = 0.360
Bacon 20 × 4.00 = 0.800
French fried potato 150 × 0.56 = 0.840
Tea 350 × 0.084 = 0.294
Total nitrogen in food 10.483 grams.
Total nitrogen in urine 6.100
Fuel value of the food 2302 calories.
Sunday, March 6, 1904.
Breakfast.—Fried Indian-meal 150 grams, syrup 50 grams, sliced banana 100 grams, baked potato 150 grams, one cup coffee 350 grams, butter 10 grams.
Dinner.—Corned beef 50 grams, boiled cabbage 200 grams, mashed potato 250 grams, bread 75 grams, one cup coffee 350 grams, fried rice 100 grams, jam 75 grams.
Supper.—Sponge cake 150 grams, apple sauce 150 grams, crackers 32 grams, butter 10 grams, one cup tea 350 grams, sardine 14 grams.
Food. Grams. Per cent Nitrogen. Total Nitrogen.
Fried Indian-meal 150 × 0.38 = 0.570 gram.
Syrup 50 × 0.00 = 0.000
Banana 100 × 0.19 = 0.190
Baked potato 150 × 0.37 = 0.555
Coffee (breakfast) 350 × 0.072 = 0.252
Butter 10 + 10 = 20 × 0.16 = 0.032
Corned beef 50 × 5.24 = 2.620
Cabbage 200 × 0.34 = 0.680
Mashed potato 250 × 0.32 = 0.800
Bread 75 × 1.67 = 1.252
Coffee (dinner) 350 × 0.093 = 0.325
Fried rice 100 × 0.23 = 0.230
Jam 75 × 0.034 = 0.025
Sponge cake 150 × 1.02 = 1.530
Apple sauce 150 × 0.044 = 0.066
Crackers 32 × 1.50 = 0.480
Tea 350 × 0.054 = 0.189
Sardine 14 × 3.35 = 0.469
Total nitrogen in food 10.265 grams.
Total nitrogen in urine 7.960
Fuel value of the food 3173 calories.
NITROGEN BALANCE.—Oakman.
Nitrogen Taken in. Output.
Nitrogen in Urine. Weight of Fæces[34] (dry).
Feb. 29 10.466 grams. 6.88 grams.
Mar. 1 7.825 7.42
2 8.487 7.58 17 grams.
3 8.750 6.85 72
4 10.427 7.95 39
5 10.483 6.10 19
6 10.265 7.96 35
182 grams contain 6.81% N.
66.703 50.74 + 12.394 grams nitrogen.
66.703 grams nitrogen. 63.134 grams nitrogen.
Nitrogen balance for seven days = +3.569 grams.
Nitrogen balance per day = +0.509 gram.
Average Intake.
Calories per day 2509.
Nitrogen per day 9.50 grams.
NITROGEN BALANCE.—Henderson.
Nitrogen Taken in. Output.
Nitrogen in Urine. Weight of Fæces (dry).
Feb. 29 10.261 grams. 8.36 grams.
Mar. 1 7.384 6.80
2 8.487 8.28 85 grams.
3 8.555 7.37
4 10.427 8.22
5 10.483 8.09
6 10.265 8.20 28
113 grams contain 6.21% N.
65.862 55.32 + 7.017 grams nitrogen.
65.862 grams nitrogen. 62.337 grams nitrogen.
Nitrogen balance for seven days = +3.525 grams.
Nitrogen balance per day = +0.503 grams.
NITROGEN BALANCE.—Morris.
Nitrogen Taken in. Output.
Nitrogen in Urine. Weight of Fæces (dry).
Feb. 29 10.466 grams. 6.40 grams.
Mar. 1 7.720 6.64 45 grams.
2 8.319 5.40 43
3 8.750 6.55 41
4 10.427 4.99 45
5 10.483 5.38 38
6 10.265 7.01 13
225 grams contain 7.18% N.
66.430 42.37 + 16.155 grams nitrogen.
66.430 grams nitrogen. 58.525 grams nitrogen.
Nitrogen balance for seven days = +7.905 grams.
Nitrogen balance per day = +1.129 grams.
NITROGEN BALANCE.—Coffman.
Nitrogen Taken in. Output.
Nitrogen in Urine. Weight of Fæces (dry).
Feb. 29 10.466 grams. 8.63 grams.
Mar. 1 7.825 7.48
2 8.487 8.62
3 8.750 7.18
4 10.427 7.93 65 grams.
5 10.483 7.67 83
6 10.265 7.95 20
168 grams contain 6.14% N.
66.703 55.46 + 10.315 grams nitrogen.
66.703 grams nitrogen. 65.775 grams nitrogen.
Nitrogen balance for seven days = +0.928 gram.
Nitrogen balance per day = +0.132 gram.
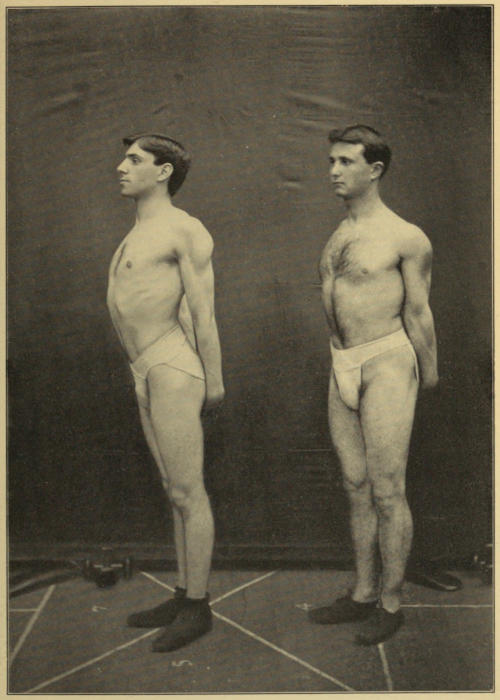
ZOOMAN COHN
Photographs taken at the close of the experiment.
NITROGEN BALANCE.—Steltz.
Nitrogen Taken in. Output.
Nitrogen in Urine. Weight of Fæces (dry).
Feb. 29 9.989 grams. 7.90 grams. 23 grams.
Mar. 1 8.090 5.98 22
2 8.487 6.58 21
3 9.300 8.10 45
4 11.107 4.66 18
5 10.024 8.69 36
6 10.392 8.20 31
10
206 grams contain 6.66% N.
67.389 50.11 + 13.719 grams nitrogen.
67.389 grams nitrogen. 63.829 grams nitrogen.
Nitrogen balance for seven days = +3.560 grams.
Nitrogen balance per day = +0.508 gram.
NITROGEN BALANCE.—Loewenthal.
Nitrogen Taken in. Output.
Nitrogen in Urine. Weight of Fæces (dry).
Feb. 29 10.466 grams. 7.38 grams. 16.5 grams.
Mar. 1 7.825 7.05 38.0
2 8.487 7.07 21.0
3 8.750 7.83
4 10.427 7.35 15.0
5 10.654 4.29 22.0
6 10.886 8.07 56.0
168.5 grams contain 7.11% N.
67.495 49.04 + 11.980 grams nitrogen.
67.495 grams nitrogen. 61.020 grams nitrogen.
Nitrogen balance for seven days = +6.475 grams.
Nitrogen balance per day = +0.925 gram.
NITROGEN BALANCE.—Cohn.
Nitrogen Taken in. Output.
Nitrogen in Urine. Weight of Fæces (dry).
Feb. 29 10.442 grams. 9.74 grams.
Mar. 1 7.825 6.86
2 8.487 7.29 43 grams.
4 10.215 5.59 24
5 10.483 9.55 57
6 8.164 6.77 25
149 grams contain 6.63% N.
= 9.878 gr.
-1.401 [35]
55.616 45.80 + = 8.477 grams nitrogen.
55.616 grams nitrogen. 54.277 grams nitrogen.
Nitrogen balance for six days = +1.339 grams.
Nitrogen balance per day = +0.223 gram.
NITROGEN BALANCE.—Zooman.
Nitrogen Taken in. Output.
Nitrogen in Urine. Weight of Fæces (dry).
Feb. 29 10.466 grams. 7.02 grams. 18 grams.
Mar. 1 7.604 6.66 25
2 8.487 7.26 52
3 8.750 7.56 40
4 10.427 7.51 14
5 10.483 7.08 30
6 10.265 6.81 10
189 grams contain 6.54% N.
66.482 49.90 + 12.36 grams nitrogen.
66.482 grams nitrogen. 62.26 grams nitrogen.
Nitrogen balance for seven days = +4.222 grams.
Nitrogen balance per day = +0.603 gram.
NITROGEN BALANCE.—Sliney.
Nitrogen Taken in. Output.
Nitrogen in Urine. Weight of Fæces (dry).
Feb. 29 10.466 grams. 9.50 grams. 15 grams.
Mar. 1 7.825 8.09 35
2 8.487 7.97 25
3 8.734 7.78 45
4 10.427 7.49 28
5 10.475 7.54 21
6 10.265 8.23 32
201 grams contain 6.70% N.
66.679 56.60 + 13.467 grams nitrogen.
66.679 grams nitrogen. 70.067 grams nitrogen.
Nitrogen balance for seven days = -3.388 grams.
Nitrogen balance per day = -0.484 gram.
NITROGEN BALANCE.—Broyles.
Nitrogen Taken in. Output.
Nitrogen in Urine. Weight of Fæces (dry).
Feb. 29 10.179 grams. 5.74 grams.
Mar. 1 7.468 9.26
2 8.487 6.97 13 grams.
3 8.750 6.18 4
4 10.427 7.68 46
5 10.483 5.56 29
6 10.265 7.69 42
134 grams contain 6.24% N.
66.059 49.08 + 8.361 grams nitrogen.
66.059 grams nitrogen. 57.441 grams nitrogen.
Nitrogen balance for seven days = +8.618 grams.
Nitrogen balance per day = +1.231 grams.
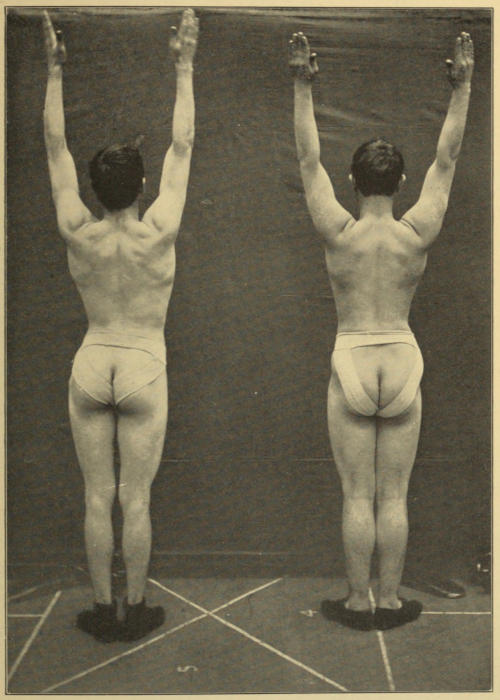
ZOOMAN COHN
Photographs taken at the close of the experiment.
NITROGEN BALANCE.—Fritz.
Nitrogen Taken in. Output.
Nitrogen in Urine. Weight of Fæces (dry).
Feb. 29 10.466 grams. 6.22 grams.
Mar. 1 7.825 7.44
2 8.487 4.00 71
3 8.750 7.05 28
5 10.483 8.71 49
6 10.265 4.78 44
192 grams contain 6.61% N.
= 12.691 gr.
-1.813 [36]
56.276 38.20 + = 10.878 grm. N.
56.276 grams nitrogen. 49.078 grams nitrogen.
Nitrogen balance for six days = +7.198 grams.
Nitrogen balance per day = +1.199 grams.
Third Nitrogen Balance.
The last of March, a third nitrogen balance was tried on a slightly lowered nitrogen intake and with a slight increase in the fuel value of the daily food. In this period of five days, March 28 to April 1, the nitrogen taken in per day averaged 8.62 grams, or nearly one gram per day less than in the preceding period. The fuel value of the food averaged 2840 calories per day, or about 300 calories more than in the preceding period.
The daily diet, with its content of nitrogen, etc., is detailed for each day under Oakman. Any deviation from this diet in the cases of the other men is indicated on the accompanying balance-sheets.
The results obtained in this balance period indicate that the lowest level had been practically reached, at least under the conditions of body-weight, food, and work prevailing. Cohn, Fritz, and Broyles showed a distinct positive balance. Steltz and Loewenthal were practically in equilibrium, the deviation being within the limits of error. The remaining six men showed a minus balance, although in no case was it very marked.
It is interesting to note in this connection that the average daily output of nitrogen through the urine for this five days’ period (Oakman’s case) amounted to 7.04 grams, being 0.2 gram less per day than in the preceding period. This figure for nitrogen in the urine means the metabolism daily of 44 grams of proteid.
Undoubtedly, the rate of proteid metabolism for these men could have been lowered considerably beyond the present level by increasing largely the intake of carbohydrates and fats, but it has been the intent throughout all of these experiments to learn the minimal proteid requirement under conditions precluding the use of any excess of non-nitrogenous foods; also, to study the effect of a general physiological economy in nutrition, with a view to ascertaining the real necessities of the body for both proteid and non-proteid foods with maintenance of bodily strength and vigor. Hence, we may again emphasize the fact that the low proteid metabolism maintained by all these men throughout the period of the experiment, with establishment of nitrogenous equilibrium on a consumption of proteid or albuminous food averaging one-half the amount ordinarily specified as the daily requirement of the healthy man, has been accomplished with even less total food—fats and carbohydrates—than the ordinary standards call for, i. e., considerably less than 3000 calories per day in fuel value.
OAKMAN.
Monday, March 28, 1904.
Breakfast.—Fried rice 150 grams, syrup 75 grams, baked potato 250 grams, butter 20 grams, one cup coffee 350 grams.
Dinner.—Thick pea soup 200 grams, boiled onions 100 grams, boiled sweet potato 250 grams, bread 50 grams, mashed potato 200 grams, butter 20 grams, one cup coffee 350 grams.
Supper.—Sliced banana 150 grams, biscuit 125 grams, fried bacon 20 grams, French fried potato 200 grams, butter 25 grams, one cup tea 350 grams.
Food. Grams. Per cent Nitrogen. Total Nitrogen.
Fried rice 150 × 0.40 = 0.600 grams.
Syrup 75 × 0.051 = 0.038
Baked potato 250 × 0.33 = 0.825
Butter 25 + 20 + 20 = 65 × 0.15 = 0.097
Coffee (breakfast) 350 × 0.10 = 0.350
Pea soup 200 × 0.50 = 1.000
Boiled onion 100 × 0.30 = 0.300
Sweet potato 250 × 0.12 = 0.300
Bread 50 × 1.57 = 0.785
Mashed potato 200 × 0.30 = 0.600
Coffee (dinner) 350 × 0.075 = 0.262
Banana 150 × 0.27 = 0.405
Biscuit 125 × 1.21 = 1.513
Bacon 20 × 3.85 = 0.770
Fried potato 200 × 0.46 = 0.920
Tea 350 × 0.075 = 0.262
Total nitrogen in food 9.027 grams.
Total nitrogen in urine 6.640
Fuel value of the food 2935 calories.
Tuesday, March 29, 1904.
Breakfast.—Boiled hominy 175 grams, milk 75 grams, sugar 25 grams, baked potato 250 grams, butter 20 grams, one cup coffee 350 grams.
Dinner.—Hamburg steak with much bread, fat, and onions 125 grams, boiled potato 300 grams, butter 10 grams, one cup coffee 350 grams, bread 35 grams, boiled carrots 125 grams.
Supper.—Tapioca-peach pudding 300 grams, bread 35 grams, Saratoga chips 75 grams, butter 20 grams, jam 75 grams, one cup tea 350 grams.
Food. Grams. Per cent Nitrogen. Total Nitrogen.
Boiled hominy 175 × 0.23 = 0.403 grams.
Milk 75 × 0.55 = 0.413
Sugar 25 × 0.00 = 0.000
Baked potato 250 × 0.36 = 0.900
Butter 20 + 10 + 20 = 50 × 0.15 = 0.075
Coffee (breakfast) 350 × 0.057 = 0.200
Hamburg steak, etc. 125 × 2.50 = 3.130
Boiled potato 300 × 0.26 = 0.780
Coffee (dinner) 350 × 0.051 = 0.179
Carrots 125 × 0.13 = 0.163
Tapioca-peach pudding 300 × 0.28 = 0.840
Bread 35 + 35 = 70 × 1.51 = 1.057
Saratoga chips 75 × 0.79 = 0.593
Jam 75 × 0.039 = 0.029
Tea 350 × 0.06 = 0.210
Total nitrogen in food 8.972 grams.
Total nitrogen in urine 8.340
Fuel value of the food 2840 calories.
Wednesday, March 30, 1904.
Breakfast.—Fried hominy 150 grams, syrup 75 grams, butter 10 grams, sliced banana 250 grams, one cup coffee 350 grams.
Dinner.—Codfish-balls (1 part fish, 5 parts potatoes, fried in pork fat) 125 grams, mashed potato 250 grams, stewed tomato 200 grams, bread 35 grams, apple sauce 200 grams, one cup coffee 350 grams.
Supper.—Chopped fresh cabbage with salt, pepper, and vinegar 75 grams, bread 50 grams, butter 20 grams, fried sweet potato 250 grams, cranberry sauce 200 grams, sponge cake 50 grams, one cup tea 350 grams.
Food. Grams. Per cent Nitrogen. Total Nitrogen.
Fried hominy 150 × 0.35 = 0.525 grams.
Syrup 75 × 0.051 = 0.038
Butter 10 + 20 = 30 × 0.15 = 0.045
Banana 250 × 0.25 = 0.625
Coffee (breakfast) 350 × 0.066 = 0.231
Codfish-balls, etc. 125 × 3.25 = 4.063
Mashed potato 250 × 0.26 = 0.650
Tomato 200 × 0.18 = 0.360
Bread 35 + 50 = 85 × 1.50 = 1.280
Apple sauce 200 × 0.053 = 0.106
Coffee (dinner) 350 × 0.051 = 0.179
Cabbage 75 × 0.22 = 0.165
Fried sweet potato 250 × 0.15 = 0.375
Cranberry sauce 200 × 0.066 = 0.132
Sponge cake 50 × 0.87 = 0.435
Tea 350 × 0.042 = 0.147
Total nitrogen in food 9.356 grams.
Total nitrogen in urine 6.300
Fuel value of the food 2657 calories.
Thursday, March 31, 1904.
Breakfast.—Fried Indian meal 100 grams, syrup 75 grams, baked potato 250 grams, one cup coffee 350 grams, butter 20 grams.
Dinner.—Tomato soup, thick, with potatoes and onions boiled together 300 grams, mashed potato 200 grams, scrambled egg 50 grams, bread 50 grams, butter 10 grams, one cup coffee 350 grams.
Supper.—Bread pudding 150 grams, sliced banana 200 grams, fried bacon 20 grams, boiled potato 200 grams, butter 10 grams, one cup tea 350 grams.
Food. Grams. Per cent Nitrogen. Total Nitrogen.
Fried Indian meal 100 × 0.44 = 0.440 grams.
Syrup 75 × 0.051 = 0.038
Baked potato 250 × 0.32 = 0.800
Coffee (breakfast) 350 × 0.066 = 0.231
Butter 10 + 20 + 10 = 40 × 0.15 = 0.060
Tomato soup 300 × 0.48 = 1.440
Mashed potato 200 × 0.26 = 0.520
Scrambled egg 50 × 2.15 = 1.075
Bread 50 × 1.48 = 0.740
Coffee (dinner) 350 × 0.057 = 0.200
Bread pudding 150 × 0.92 = 1.380
Banana 200 × 0.24 = 0.480
Bacon 20 × 1.95 = 0.390
Boiled potato 200 × 0.25 = 0.500
Tea 350 × 0.036 = 0.126
Total nitrogen in food 8.420 grams.
Total nitrogen in urine 7.100
Fuel value of the food 2466 calories.
Friday, April 1, 1904.
Breakfast.—Fried hominy 150 grams, syrup 75 grams, baked potato 200 grams, butter 20 grams, one cup coffee 350 grams.
Dinner.—Baked spaghetti 250 grams, mashed potato 250 grams, boiled turnip 150 grams, bread 35 grams, butter 10 grams, apple sauce 200 grams, one cup coffee 350 grams.
Supper.—Apple-tapioca pudding 300 grams, fried sweet potato 200 grams, butter 20 grams, jam 100 grams, fried bacon 25 grams, bread 35 grams, one cup tea 350 grams.
Food. Grams. Per cent Nitrogen. Total Nitrogen.
Fried hominy 150 × 0.24 = 0.360 grams.
Syrup 75 × 0.051 = 0.038
Baked potato 200 × 0.33 = 0.660
Butter 20 + 10 + 20 = 50 × 0.15 = 0.075
Coffee (breakfast) 350 × 0.06 = 0.210
Spaghetti 250 × 0.64 = 1.600
Mashed potato 250 × 0.28 = 0.700
Boiled turnip 150 × 0.61 = 0.915
Bread 35 + 35 = 70 × 1.56 = 1.092
Apple sauce 200 × 0.053 = 0.106
Coffee (dinner) 350 × 0.072 = 0.252
Apple-tapioca pudding 300 × 0.043 = 0.129
Fried sweet potato 200 × 0.15 = 0.300
Jam 100 × 0.039 = 0.039
Bacon 25 × 2.96 = 0.740
Tea 350 × 0.036 = 0.126
Total nitrogen in food 7.342 grams.
Total nitrogen in urine 6.830
Fuel value of the food 3248 calories.
NITROGEN BALANCE.—Oakman.
Nitrogen Taken in. Output.
Nitrogen in Urine. Weight of Fæces (dry).
Mar. 28 9.027 grams. 6.64 grams.
29 8.972 8.34 39 grams.
30 9.356 6.30 38
31 8.420 7.10 31
Apr. 1 7.342 6.83 29
137 grams contain 6.84% N.
43.117 35.21 + 9.37 grams nitrogen.
43.117 grams nitrogen. 44.580 grams nitrogen.
Nitrogen balance for five days = -1.463 grams.
Nitrogen balance per day = -0.292 gram.
Average Intake.
Calories per day 2840.
Nitrogen per day 8.62 grams.
NITROGEN BALANCE.—Broyles.
Nitrogen Taken in. Output.
Nitrogen in Urine. Weight of Fæces (dry).
Mar. 28 9.027 grams. 6.79 grams. 27.0 grams.
29 8.972 7.06 45.5
30 9.356 7.27 41.0
31 8.640 6.21 25.0
Apr. 1 7.342 5.86 20.0
158.5 grams contain 5.92% N.
43.337 33.19 + 9.383 grams nitrogen.
43.337 grams nitrogen. 42.573 grams nitrogen.
Nitrogen balance for five days = +0.764 gram.
Nitrogen balance per day = +0.153 gram.
NITROGEN BALANCE.—Fritz.
Nitrogen Taken in. Output.
Nitrogen in Urine. Weight of Fæces (dry).
Mar. 29 7.229 grams. 5.09 grams.
30 9.235 7.10 25 grams.
31 8.640 5.18 43
Apr. 1 7.439 5.74 34
102 grams contain 6.42% N.
32.543 23.11 + 6.548 grams nitrogen.
32.543 grams nitrogen. 29.658 grams nitrogen.
Nitrogen balance for four days = +2.885 grams.
Nitrogen balance per day = +0.721 gram.
NITROGEN BALANCE.—Loewenthal.
Nitrogen Taken in. Output.
Nitrogen in Urine. Weight of Fæces (dry).
Mar. 28 9.027 grams. 6.27 grams. 13.5 grams.
29 8.760 7.54 52.0
30 9.341 7.07 41.0
31 8.112 5.24 21.0
Apr. 1 7.342 6.43 17.0
144.5 grams contain 7.00% N.
42.582 32.55 + 10.115 grams nitrogen.
42.582 grams nitrogen. 42.665 grams nitrogen.
Nitrogen balance for five days = -0.083 gram.
Nitrogen balance per day = -0.016 gram.
NITROGEN BALANCE.—Cohn.
Nitrogen Taken in. Output.
Nitrogen in Urine. Weight of Fæces (dry).
Mar. 28 8.825 grams. 6.61 grams.
29 8.151 6.48 27 grams.
30 9.211 6.36 25
31 8.030 7.47 23
Apr. 1 7.246 4.35 39
114 grams contain 6.84% N.
41.463 31.27 + 7.797 grams nitrogen.
41.463 grams nitrogen. 39.067 grams nitrogen.
Nitrogen balance for five days = +2.396 grams.
Nitrogen balance per day = +0.479 gram.
NITROGEN BALANCE.—Coffman.
Nitrogen Taken in. Output.
Nitrogen in Urine. Weight of Fæces (dry).
Mar. 28 9.027 grams. 8.38 grams.
29 8.972 8.06 42 grams.
30 9.356 6.88 24
31 8.640 7.78 29
Apr. 1 7.342 7.22 32
127 grams contain 6.54% N.
43.337 38.32 + 8.306 grams nitrogen.
43.337 grams nitrogen. 46.626 grams nitrogen.
Nitrogen balance for five days = -3.289 grams.
Nitrogen balance per day = -0.657 gram.
NITROGEN BALANCE.—Sliney.
Nitrogen Taken in. Output.
Nitrogen in Urine. Weight of Fæces (dry).
Mar. 28 8.527 grams. 7.09 grams. 28.0 grams.
29 8.630 7.37 31.5
30 9.356 8.10 33.0
31 8.420 7.47 26.0
Apr. 1 7.342 6.78 50.0
168.5 grams contain 6.42% N.
42.275 36.81 + 10.82 grams nitrogen.
42.275 grams nitrogen. 47.63 grams nitrogen.
Nitrogen balance for five days = -5.355 grams.
Nitrogen balance per day = -1.071 grams.
NITROGEN BALANCE.—Steltz.
Nitrogen Taken in. Output.
Nitrogen in Urine. Weight of Fæces (dry).
Mar. 28 8.026 grams. 3.60 grams. 32.0 grams.
29 8.252 6.79 29.0
30 9.255 7.20 44.0
31 8.720 7.11 22.0
Apr. 1 7.357 7.82 30.5
157.5 grams contain 5.97% N.
41.610 32.52 + 9.403 grams nitrogen.
41.610 grams nitrogen. 41.923 grams nitrogen.
Nitrogen balance for five days = -0.313 gram.
Nitrogen balance per day = -0.062 gram.
NITROGEN BALANCE.—Zooman.
Nitrogen Taken in. Output.
Nitrogen in Urine. Weight of Fæces (dry).
Mar. 28 9.027 grams. 7.47 grams. 33.0 grams.
29 8.379 7.80 45.0
30 9.356 5.40 30.0
31 8.420 8.04 28.0
Apr. 1 7.269 8.44 11.5
147.5 grams contain 6.39% N.
42.451 37.15 + 9.425 grams nitrogen.
42.451 grams nitrogen. 46.575 grams nitrogen.
Nitrogen balance for five days = -4.124 grams.
Nitrogen balance per day = -0.824 gram.
NITROGEN BALANCE.—Henderson.
Nitrogen Taken in. Output.
Nitrogen in Urine. Weight of Fæces (dry).
Mar. 28 9.027 grams. 8.40 grams.
29 8.972 9.04
30 9.356 5.95 83 grams.
31 8.640 5.42 36
Apr. 1 7.342 6.60 58
177 grams contain 6.48% N.
43.337 35.41 + 11.469 grams nitrogen.
43.337 grams nitrogen. 46.879 grams nitrogen.
Nitrogen balance for five days = -3.542 grams.
Nitrogen balance per day = -0.708 gram.
NITROGEN BALANCE.—Morris.
Nitrogen Taken in. Output.
Nitrogen in Urine. Weight of Fæces (dry).
Mar. 28 8.877 grams. 6.68 grams. 12 grams.
29 8.774 5.69 48
30 8.941 6.06 34
31 8.420 6.96 34
Apr. 1 7.286 7.10 33
161 grams contain 7.08% N.
42.298 32.49 + 11.399 grams nitrogen.
42.298 grams nitrogen. 43.889 grams nitrogen.
Nitrogen balance for five days = -1.591 grams.
Nitrogen balance per day = -0.317 gram.
Summary Regarding Nitrogen Requirement.
These results obtained with this body of United States soldiers, living on a prescribed diet and exposed to the stress and strain of military discipline with its attendant duties, together with the gymnastic work and training required each day, confirm in every detail the conclusions arrived at with the preceding group of professional workers. Once accustomed to a more sparing proteid diet, less rich in nitrogen, each one of these subjects had no difficulty in maintaining body-weight on the simpler and lighter food provided. No great difficulty was experienced in establishing a condition of nitrogenous equilibrium with this lowered intake of proteid food, neither was it necessary to increase the amounts of non-nitrogenous foods (fats and carbohydrates) to accomplish this end. The bodies of these men were quite able to adjust themselves to a lowered proteid metabolism, and physiologically speaking, one might well conjecture whether we have not in this condition a nearer approach to the normal and ideal state of the body than when the latter is struggling daily with 118 grams of proteid food, reinforced by fats and carbohydrates correspondingly increased in amount. However this may be, the members of the soldier detail were able to live for five consecutive months with a proteid metabolism corresponding to 7 to 8 grams of nitrogen per day, with maintenance of body-weight and without discomfort or loss of bodily vigor.
It was easy in most instances to prove the establishment of nitrogen equilibrium with a daily intake of 8.5 to 9.5 grams of nitrogen, and with a total fuel value of the daily food equal to 2500 to 2800 calories. In other words, a metabolism of less than 50 grams of proteid per day was quite sufficient for the needs of the body, and a fuel value of 2500 to 2600 calories was ample to meet the requirements of the men under the then existing conditions of bodily and mental activity. Are we not justified, therefore, in again asking the question, why should we hold and teach the doctrine that the healthy adult needs to metabolize 105 grams of proteid food daily? As Voit has well said, the smallest amount of food that will serve to maintain physiological equilibrium and keep up health and strength is the ideal diet. The eleven subjects of this Hospital detachment, who remained throughout the experiment, were apparently able to maintain physiological equilibrium and preserve their health and strength under the conditions of diet as described, thereby demonstrating the possibilities of a physiological economy corresponding to a saving of full fifty per cent or more in proteid food; a saving of possibly great physiological import, to say nothing of the possible economic and sociological importance of the saving. Further, we may add that the minimal proteid requirement as evidenced by the results of these experiments is more than fifty per cent lower than the figures quoted by most physiologists as necessary for the maintenance of life and strength; and we are certainly justified in the additional statement that if the figures obtained in these experiments truly represent the minimal proteid requirement of the men under observation, then this minimal requirement is quite sufficient to meet the physiological needs of the body for an indefinite period.
Physical Condition of the Men.
Recalling the fact that this condition of lowered proteid metabolism was maintained for a period of five months, we may next consider the effect of this changed nutritive condition upon the health and strength of the men. The question of body-weight we have already considered. More pertinent is the question, to how great an extent was the strength and bodily vigor of the men modified by the diminished amount of proteid food? The answer to this question is found in the subjoined report from Dr. William G. Anderson, Director of the Yale University Gymnasium.
Yale University Gymnasium, New Haven, Conn., April 6, 1904.
To Professor Russell H. Chittenden, Director of the Sheffield Scientific School, Yale University, New Haven, Conn.
Dear Sir,—I hand you herewith a report of the physical training of the squad of soldiers sent by you to the Yale Gymnasium.
These men have taken one hour’s exercise daily for six months, Sundays excepted,—October 1, 1903, to April 1, 1904.
Before beginning the bodily development of the men we measured each one and took what are known as the American Collegiate Strength Tests. These measurements and tests have been taken twice each month. For details as to measurements and methods of testing the strength of the body, see the “Notes” attached to this report.
The members of the squad were called to the floor each morning as soon after nine-thirty as they could don the required suit. For twenty minutes they were put through a series of setting up exercises and body-building movements; then followed exercises on the apparatus, such as bars, rings, ladders, etc. This was followed by a jump or game.
The exercises were progressive as to duration, force, extent, and number of movements. At the end of the six months the men were being put through gymnastics that were exacting and fatiguing. As the progression was carefully made, the men did not suffer from soreness to any marked degree. By way of comparison it may be said, the gymnastic training given the soldiers was much more severe than is given to the Freshmen of Yale in their required physical training. Perhaps the Varsity Crew are “put through” as rigid gymnastic training as any of the athletes in college, so we copied the exercises taken by oarsmen in order to “try out” the soldiers. This work was easily taken by all the “Dieters,”—no complaint, so far as I know, having been entered.
The improvement in accuracy and grace of movement has been noticeable, while there has been a gain in skill as well.
I do not consider these men, as a body, well put up. They did not rank favorably with applicants for policeman or fireman and were noticeably timid in exercises that called for courage. In the vault over a fence there was a very marked fear. This was the poorest and least satisfactory test of all we made. At the end of the six months the hesitancy to vault had entirely disappeared, the event being looked upon by the men as a “cinch.”
The gain in self-reliance and courage has been as evident as the increase in the figures of the strength test. I consider this a valuable acquisition as it stands for a good body condition. Among athletes, especially gymnasts, a weakened or tired body is made known by fear or uncertainty. Our students, as well as professional athletes, admit this.
I attribute the timidity of the soldiers in these seemingly simple tests to their general physical condition at the outset, and the increase in self-reliance to the better condition of their bodies at the end of the six months’ training. The story told by the measurements is both interesting and significant, but of less importance than the ability to improve under training, which ability cannot be measured with a tape or weighed with scales.
In the majority of cases there was a loss in body-weight, but this we look for, as the larger number of soldiers were fairly well supplied with adipose tissue. Both Sliney and Oakman are exceptions, these men being “fine” at the outset. I mean thin and muscular with little fat. The latter, Oakman, is an old man judged from the physical activity standpoint, and lost noticeably during the tests and exercise. I refer to weight and girth measurements only. He made a very large gain in his strength tests and was among the leading men in all that called for courage and self-control. Sliney, nervous, irritable, and aggressive, balanced his losses with his gains in the tape and scale events, but made great improvement in the use of the dynamometers. Fritz and Cohn were quite fat and showed the expected loss in weight, but not in other respects.
For comparison I have quoted from Dr. J. W. Seaver’s anthropometric charts and have selected the “Average Student Measurements” (2390 men) as well as the mean measurements of 500 athletes and gymnasts. A glance at either set of figures will give an idea of how the soldiers compare with men living on a regular diet and surrounded with the very best environment.
The strength tests stand for mental states more than the tape line and calipers, and are suggestive of improvement in body conditions for the reasons mentioned above. These records are far above those made by Academic Freshmen in Yale, but it must be added that the soldiers have taken more exercise than the collegians.
The hearts and lungs of the men are in excellent condition, while the soldiers as a body are in better shape physically, are stronger and healthier than in October. The skin of the men is clear and ruddy.
The figures for comparison in the Strength Test Table are from the records sent me by Dr. Geo. Meylan, the Director of the Columbia University Gymnasium. I understand that others than college men are represented in his data. In the figures given in my own tables I have omitted the small fractions in the main body of the tables, but have recorded them in the totals.
The greater portion of the training of the soldiers has been under the personal supervision of Wm. H. Callahan, M. D., the Medical Assistant at the Gymnasium, to whom I am indebted for help and suggestions. Mr. Wm. Chase, Mr. Anton Muller, Mr. John Stapleton, and Mr. H. R. Gladwin, Assistant Instructors in the Gymnasium, have led the drills and have looked after the actual muscular training of the men. I gladly acknowledge the co-operation of these gentlemen in the physical development of the squad.
A brief summary of my conclusions:—
The men were not above the average standard, physically, when they began their work, this standard being set by applicants for firemen and policemen, not by college students. At the end of their training they were much above the same standard, while their strength tests were far greater than the averages made by college men. They showed less improvement in increase in size than University men do under like gymnastic treatment, but the gain in self-confidence and in body-fibre was very evident. The gain in accuracy and skill was marked. The men showed interest in their work throughout the six months. At the end of the period of training the soldiers were in excellent condition in spite of the fact that in some cases there was a slight loss of body-weight. This loss is not to be attributed necessarily to the diet, because most men who exercise lose slightly if there is an excess of adipose tissue.
Respectfully yours,
(Signed) W. G. Anderson.
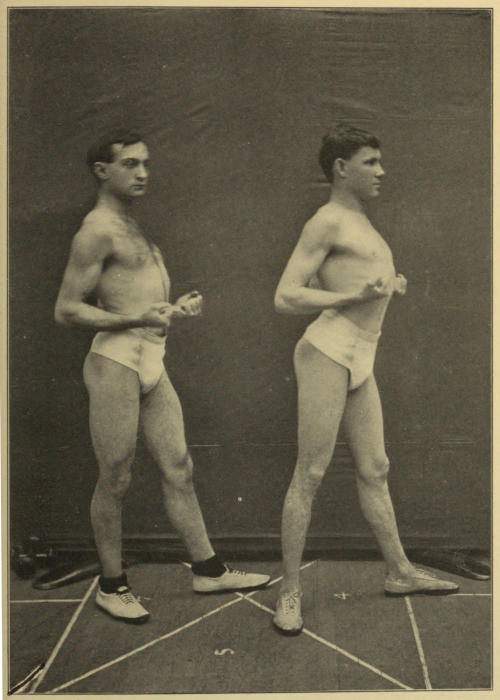
LOEWENTHAL MORRIS
Photographs taken at the close of the experiment.
Dr. Anderson furnishes the following “Notes” descriptive of the methods by which the strength tests were made:
“Strength of Back. The subject, standing upon the iron foot-rest with the dynamometer so arranged that when grasping the handles with both hands his body will be inclined forward at an angle of 60 degrees, should take a full breath and, without bending the knees, give one hard lift, mostly with the back.
“Strength of Legs. The subject while standing on the foot-rest with body and head erect, and chest thrown forward, should sink down, by bending the knees, until the handle grasped rests against the thighs, then taking a full breath, he should lift hard principally with the legs, using the hands to hold the handle in place.
“Strength of Chest. The subject with his elbows extended at the sides until the forearms are on the same horizontal plane and holding the dynamometer so that the dial will face outward and the indicator point upward, should take a full breath and push vigorously against the handles, allowing the back of the instrument to press on the chest.
“Strength of Upper Arms, Triceps. The subject, while holding the position of rest upon the parallel bars, supporting his weight with arms straight, should let the body down until the chin is level with the bars, and then push it up again until the arms are fully extended. Note the number of times that he can lift himself in this manner.
“Strength of Upper Arms, Biceps. The subject should grasp a horizontal bar or pair of rings and hang with the feet clear from the floor while the arms are extended. Note the number of times that he can haul his body up until his chin touches the bar or ring.
“Strength of Forearms. The subject, while holding the dynamometer so that the dial is turned inward, should squeeze the spring as hard as possible, first with the right hand then with the left. The strength of the muscles between the shoulders may be tested with the same instrument. The subject, while holding the dynamometer on a level with the chest, should grasp it with handles and pull both arms from the centre outward.
“The total strength is ascertained by multiplying the weight by the number of times it has been raised (push up and pull up), to this product we add the strength of hands, legs, back, and chest. The result is the total strength of the man. In some cases the product obtained by multiplying the weight by push up and pull up is divided by ten to reduce the size of the figures. We have not done so here.
“The run, vault, and ladder tests are not figured in. The lung capacity is also omitted from the final figures.”
The following tables furnished by Dr. Anderson and Dr. Callahan give (1) the measurements of the eleven men who completed the experiment, taken on October 12, 1903, and April 2, 1904. For comparison are also given measurements of Yale College students, athletes, etc. (2) Strength or dynamometer tests, i. e., the first test taken in October and the final test taken in April, 1904, together with Columbia University strength tests for comparison. (3) A series of eleven tables giving for each man the individual strength tests, two or three each month, taken during the stay of the detachment in New Haven. Study of these individual results is quite interesting, since it shows very strikingly the gradual gain in strength of the men, and at the same time illustrates how temporary conditions, bodily or mental, may influence a record of this character, more noticeable in some individuals than in others. Mental stimulus, as is well known, counts for much in the manifestation of muscular power, but the neuro-muscular mechanism depends for its highest efficiency upon the nutritive condition of the tissues as much as does the muscle tissue alone. In the obtaining of a strength test, it is usually found that the best results are recorded when there is competition among the men; i. e., under the influence of an outside stimulus.
MEASUREMENTS.
(October 12—April 2.)
Weight.* Girth Neck. Waist. Chest Normal. Chest Inflated. Chest Deflated. Right Biceps. Right Thigh. Left Biceps. Left Calf. Left Thigh. Right Calf.
Henderson 157 362 755 953 1035 890 316 510 291 362 500 351
153 369 731 942 1025 886 311 503 287 357 495 347
Oakman 145 344 738 888 947 793 305 508 289 335 512 330
137 336 727 869 938 795 297 502 282 331 507 331
Morris 129 340 713 850 932 831 280 519 283 327 502 325
131 351 719 862 938 834 285 525 290 333 509 332
Zooman 120 350 713 868 920 804 290 479 286 312 478 313
122 360 712 859 914 803 307 486 293 315 484 314
Coffman 129 352 738 860 923 815 309 518 311 354 520 350
127 349 716 857 931 818 314 527 316 359 529 354
Steltz 116 330 713 815 850 779 291 487 283 319 483 318
115 330 717 821 857 771 287 492 281 324 478 322
Loewenthal 133 338 680 835 881 822 315 510 311 338 512 333
130 341 684 840 890 819 306 504 302 342 505 337
Sliney 135 359 718 824 930 823 314 476 302 331 473 330
133 361 702 834 926 813 306 475 298 333 475 332
Fritz 167 390 860 880 930 860 360 560 343 377 562 375
161 361 795 892 997 855 358 555 340 372 559 373
Cohn 142 363 810 871 912 832 326 536 310 374 528 375
138 354 771 878 914 818 324 529 308 371 520 371
Broyles 130 356 710 851 941 805 281 500 282 341 498 334
133 370 720 864 966 798 283 506 284 344 501 338
Yale College† 139 350 730 861 910 295 515 350 509 350
Yale College‡ 147 357 747 886 940 308 534 358 527 361
STRENGTH OR DYNAMOMETER TESTS.
First Trials October, 1903; Final Test April, 1904.
Weight. Lung Capacity. Right Hand. Left Hand. Chest. Back. Legs. Pull up, Biceps. Push up, Triceps. One-fourth mile Run. Vault. Ladder. Total.
153 555 135 105 135 600 865 9 9 1.08 E E 4598 Apr.
Oakman 145 365 110 115 95 305 500 12 4 1.24 D D 3445
137 410 130 100 120 560 720 15 10 1.21 E E 5055
Morris 129 320 90 75 75 270 350 9 4 1.30 D D 2543
131 360 100 85 105 450 710 14 12 1.09 E E 4869
Zooman 120 400 110 90 130 350 350 8 9 1.40 F E 3070
122 420 115 95 100 440 910 13 18 1.13 E E 5457
Coffman 129 290 105 103 100 320 530 7 6 1.20 F F 2835
127 400 105 85 110 440 830 20 17 1.13 E E 6269
Steltz 116 300 80 85 105 300 400 10 6 1.30 E E 2838
115 380 100 90 135 410 490 19 10 1.06 E E 4581
Loewenthal 133 365 100 95 85 260 460 6 5 1.20 E E 2463
130 425 130 115 115 570 700 16 12 1.08 E E 5277
Sliney 135 380 125 130 100 400 600 8 6 1.15 E E 3245
133 420 145 135 115 508 800 15 12 1.08 E E 5307
Fritz 167 480 121 85 120 310 615 4 3 2.40 D D 2504
161 495 140 110 115 720 1030 11 8 1.17 E E 5178
Cohn 142 320 50 75 80 245 340 3 6 2.30 D D 2210
138 400 90 90 97 370 580 9 11 1.14 E E 4002
Broyles 130 485 105 95 90 340 560 6 4 1.45 D F 2560
134 515 105 110 135 560 875 15 13 1.15 E E 5530
Columbia University* 138 410 103 100 332 417 9 8
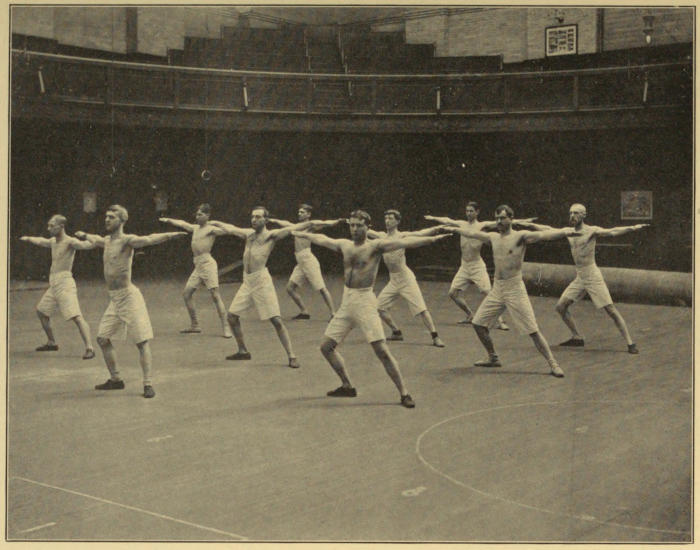
Soldiers exercising in the gymnasium.
INDIVIDUAL STRENGTH TESTS.
MORRIS.
Weight. Pull up. Push up. Right Hand. Left Hand. Chest. Back. Legs. Vault and Ladder. Lung Capacity. One-fourth Mile Run. Product. Total.
Oct. 1, ’03 129 9 4 90 75 75 270 350 D 320 1.30 1683 2543
Oct. 12, ’03 130 7 2 95 75 75 250 430 D 310 1.40 1170 2095
Oct. 26, ’03 132 8 5 85 70 80 250 400 D 320 1120 2667
Nov. 9, ’03 133 12 7 108 84 85 340 457 F 380 1.45 2536 3620
Nov. 23, ’03 132 12 3 95 70 90 315 450 F 325 1.18 2046 3066
Dec. 1, ’03 134 10 6 95 85 75 350 455 F 350 1.14 2152 3212
Dec. 15, ’03 130 7 4 100 100 85 400 490 F 340 1.12 1430 2605
Dec. 29, ’03 129 10 6 100 85 90 260 475 E 330 1.11 2075 3085
Jan. 12, ’04 131 10 6 95 69 90 260 445 E 345 1.15 2108 3067
Jan. 24, ’04 132 10 5 80 80 85 340 510 E 350 1.18 1980 3075
Feb. 9, ’04 130 7 6 80 70 85 280 E 345 1.14 1699 2214
Feb. 23, ’04 134 5 6 100 100 90 310 450 E 360 1.09 1479 2529
Mar. 8, ’04 131 10 10 90 85 95 375 550 E 320 1.14 2620 3815
Mar. 22, ’04 132 10 9 98 82 100 370 500 E 360 1.15 2508 3658
April 2, ’04 131 14 12 100 85 105 450 710 E 360 1.09 3419 4869
COFFMAN.
Weight. Pull up. Push up. Right Hand. Left Hand. Chest. Back. Legs. Vault and Ladder. Lung Capacity. One-fourth Mile Run. Product. Total.
Oct. 1, ’03 129 7 6 105 103 100 320 530 D 290 1.20 1677 2835
Oct. 12, ’03 129 9 8 110 85 120 350 500 F 310 1.09 2193 3358
Oct. 26, ’03 129 9 12 100 100 110 350 610 F 345 1.11 2719 4119
Nov. 9, ’03 131 13 12 105 100 125 370 725 E 350 1.12 3287 4727
Nov. 23, ’03 130 12 11 95 85 120 320 620 E 360 1.12 2990 4230
Dec. 1, ’03 133 13 13 107 83 111 330 530 E 380 1.12 3471 4632
Dec. 15, ’03 129 15 12 100 98 120 390 649 E 375 1.12 3483 4840
Dec. 29, ’03 126 12 12 100 85 100 250 580 E 365 1.07 3042 4157
Jan. 12, ’04 127 12 12 100 86 107 350 575 E 360 1.12 3060 4278
Jan. 26, ’04 127 15 11 105 97 100 465 680 E 400 1.13 3312 4759
Feb. 9, ’04 126 15 14 95 85 100 410 725 E 390 1.11 3675 5090
Feb. 23, ’04 126 17 14 100 95 90 460 555 E 380 1.09 3921 5221
Mar. 8, ’04 126 18 16 90 95 100 425 675 E 390 1.14 4284 5669
Mar. 22, ’04 129 19 16 115 93 100 430 600 E 400 1.10 4515 5913
Apr. 2, ’04 127 20 17 105 85 110 440 830 E 400 1.13 4699 6269
OAKMAN.
Weight. Pull up. Push up. Right Hand. Left Hand. Chest. Back. Legs. Vault and Ladder. Lung Capacity. One-fourth Mile Run. Product. Total.
Oct. 1, ’03 145 12 4 110 115 95 305 500 D 365 1.24 2320 3445
Oct. 12, ’03 146 9 5 112 111 120 360 507 D 375 1.30 2044 3254
Oct. 26, ’03 148 10 6 120 115 120 480 580 F 400 1.40 2368 3783
Nov. 9, ’03 150 13 9 123 121 125 390 620 F 406 1.40 3150 4529
Nov. 23, ’03 147 12 5 125 125 410 620 F 360 1.25 2499 3779
Dec. 1, ’03 147 12 9 135 105 112 340 590 F 405 1.24 3092 4374
Dec. 15, ’03 141 10 6 125 120 115 390 570 E 400 1.25 2264 3584
Dec. 29, ’03 139 13 9 105 100 110 350 540 E 380 1.29 3058 4263
Jan. 12, ’04 143 9 6 106 104 112 345 545 E 370 1.27 2152 3365
Jan. 26, ’04 142 12 6 120 102 105 350 610 E 410 1.29 2556 3843
Feb. 9, ’04 138 13 8 110 105 100 425 700 E 435 1.26 2913 4353
Feb. 23, ’04 143 12 7 120 110 100 380 800 E 430 1.28 2716 4226
Mar. 8, ’04 137 12 8 105 110 120 400 700 E 440 1.26 2755 4190
Mar. 22, ’04 143 12 5 115 90 105 400 575 E 440 1.25 2439 3724
Apr. 2, ’04 137 15 10 130 100 120 560 720 E 410 1.21 3425 5055
ZOOMAN.
Weight. Pull up. Push up. Right Hand. Left Hand. Chest. Back. Legs. Vault and Ladder. Lung Capacity. One-fourth Mile Run. Product. Total.
Oct. 1, ’03 120 8 9 110 90 130 350 350 D 400 1.40 2040 3070
Oct. 12, ’03 121 9 12 100 95 130 360 370 F 410 1.28 2551 3616
Oct. 26, ’03 124 11 17 115 75 130 400 400 F 440 1.11 3472 4592
Nov. 9, ’03 126 9 18 115 107 125 365 540 E 420 1.14 3415 4681
Nov. 23, ’03 120 13 20 110 100 117 350 470 E 400 1.12 3968 5115
Dec. 1, ’03 123 12 18 120 105 103 445 520 E 380 1.10 3690 4983
Dec. 15, ’03 120 12 17 100 90 110 360 490 E 410 1.14 3540 4690
Dec. 29, ’03 119 12 17 105 90 115 350 495 E 420 1.14 3472 4627
Jan. 12, ’04 122 11 15 112 102 117 320 520 E 420 1.21 3172 4303
Jan. 26, ’04 121 11 14 105 95 115 422 535 E 405 1.13 3043 4315
Feb. 9, ’04 122 10 17 95 85 115 460 545 E 420 1.10 3313 4613
Feb. 23, ’04 121 10 17 100 105 112 350 570 E 408 1.12 3260 4497
Mar. 8, ’04 119 12 18 105 95 100 425 700 E 410 1.12 3570 4995
Mar. 22, ’04 125 12 19 105 94 105 375 650 E 420 1.13 3875 5204
Apr. 2, ’04 122 13 18 115 95 100 440 910 E 420 1.13 3797 5457
STELTZ.
Weight. Pull up. Push up. Right Hand. Left Hand. Chest. Back. Legs. Vault and Ladder. Lung Capacity. One-fourth Mile Run. Product. Total.
Oct. 1, ’03 116 10 6 80 85 105 300 400 D 300 1.30 1868 2838
Oct. 12, ’03 118 11 5 95 78 120 310 520 D 320 1.22 1888 2911
Oct. 26, ’03 118 15 10 80 80 120 320 450 F 360 1.12 2962 4012
Nov. 9, ’03 120 15 10 91 96 127 375 505 F 345 1.20 3000 4194
Nov. 23, ’03 118 17 7 95 110 115 310 430 E 375 1.20 2844 3904
Dec. 1, ’03 119 10 8 93 85 78 330 365 E 400 1.24 2148 3099
Dec. 15, ’03 116 12 4 85 62 115 380 335 E 400 1.15 1984 2961
Dec. 29, ’03 116 15 10 75 65 95 250 300 E 380 1.09 2912 3697
Jan. 12, ’04 119 11 11 85 90 115 270 415 E 380 1.10 2618 3593
Jan. 26, ’04 118 13 7 72 82 135 365 440 E 380 1.07 2370 3464
Feb. 9, ’04 118 17 11 100 80 130 360 500 E 405 1.08 3304 4474
Feb. 23, ’04 117 17 8 80 95 120 370 360 E 420 1.08 2937 3962
Mar. 8, ’04 116 17 9 90 100 95 375 500 E 400 1.06 3016 4176
Mar. 22, ’04 117 19 7 90 90 100 300 320 E 400 1.06 3055 3955
Apr. 2, ’04 116 19 10 100 90 135 410 490 E 380 1.06 3356 4581
HENDERSON.
Weight. Pull up. Push up. Right Hand. Left Hand. Chest. Back. Legs. Vault and Ladder. Lung Capacity. One-fourth Mile Run. Product. Total.
Oct. 1, ’03 157 8 3 103 105 130 340 560 F 465 1.25 1727 2965
Oct. 12, ’03 159 6 5 115 115 135 300 500 F 485 1.19 1749 2914
Nov. 9, ’03 162 9 9 105 105 140 420 700 E 525 1.07 2925 4428
Nov. 23, ’03 157 11 9 135 115 145 500 750 E 515 1.07 3140 3145
Dec. 15, ’03
Dec. 29, ’03 153 5 4 105 125 250 365 E 520 1.16 1379 2109
Jan. 12, ’04 153 5 5 85 60 135 320 595 E 530 1.18 1535 2730
Jan. 26, ’04 155 5 3 100 65 105 350 460 E 540 1.14 1244 2332
Feb. 9, ’04 151 5 5 85 80 115 350 400 E 465 1.12 1512 2542
Feb. 23, ’04 153 9 7 110 115 125 450 610 E 535 1.13 2460 3870
Mar. 8, ’04 151 8 7 130 110 120 550 875 E 540 1.13 2265 4050
Mar. 22, ’04 155 9 8 122 100 125 370 570 E 550 1.12 2635 3922
Apr. 2, ’04 153 9 9 135 105 135 600 865 E 555 1.08 2758 4598
LOEWENTHAL.
Weight. Pull up. Push up. Right Hand. Left Hand. Chest. Back. Legs. Vault and Ladder. Lung Capacity. One-fourth Mile Run. Product. Total.
Oct. 1, ’03 133 6 5 100 95 85 260 460 D 365 1.20 1463 2463
Oct. 12, ’03 133 12 6 120 115 90 340 470 F 370 1.11 2403 3538
Oct. 26, ’03 134 7 125 110 105 370 490 F 360 1.25 938 2138
Nov. 9, ’03 135 6 8 126 123 120 365 555 F 365 1.20 1897 3179
Nov. 23, ’03 134 7 8 110 100 120 370 420 E 365 1.14 2021 3137
Dec. 1, ’03 135 13 11 125 105 85 350 390 E 380 3240 4195
Dec. 15, ’03 130 8 4 115 105 85 345 480 E 360 1.15 1560 2690
Dec. 29, ’03 130 10 6 90 80 105 230 300 E 380 2080 2885
Jan. 12, ’04 130 12 9 106 104 117 360 480 E 380 1.12 2740 3908
Jan. 26, ’04 130 60 108 80 410 465 E 385 1.15
Feb. 9, ’04 130 13 8 115 120 115 455 550 E 420 1.09 2730 4085
Feb. 23, ’04 133 14 6 115 105 100 430 500 E 385 1.08 2670 3920
Mar. 8, ’04 130 14 9 125 120 115 450 700 E 420 1.14 3007 4517
Mar. 22, ’04 132 6 11 103 113 120 370 500 E 420 1.10 2244 3450
Apr. 2, ’04 130 16 12 130 115 115 570 700 E 425 1.08 3647 5277
SLINEY.
Weight. Pull up. Push up. Right Hand. Left Hand. Chest. Back. Legs. Vault and Ladder. Lung Capacity. One-fourth Mile Run. Product. Total.
Oct. 12, ’03 135 8 6 125 130 100 400 600 D 380 1.15 1890 3245
Oct. 26, ’03 136 8 9 140 110 100 350 370 F 370 1.13 2260 3450
Nov. 9, ’03 139 12 10 150 135 105 460 560 F 420 1.14 3127 4537
Nov. 23, ’03 136 7 11 130 110 95 330 570 E 365 1.11 2448 3683
Dec. 1, ’03 136 11 11 135 125 110 445 620 E 400 1.13 3071 4506
Dec. 15, ’03 131 6 11 130 155 95 400 590 E 400 1.09 2231 3591
Dec. 29, ’03 131 14 12 130 120 130 370 555 E 420 1.09 3419 4724
Jan. 12, ’04 138 11 12 140 135 115 355 690 E 410 1.15 3174 4609
Jan. 26, ’04 137 10 10 140 122 100 400 745 E 410 1.12 2745 4252
Feb. 9, ’04 138 11 11 138 132 105 450 575 E 405 1.08 3105 4405
Feb. 23, ’04 139 12 10 140 145 99 430 650 E 405 1.08 3063 4527
Mar. 8, ’04 135 14 13 150 130 110 525 825 E 440 1.08 3651 5391
Mar. 22, ’04 139 14 9 145 138 115 340 565 E 440 1.07 3197 4500
Apr. 2, ’04 133 15 12 145 135 115 508 800 E 420 1.08 3604 5307
FRITZ.
Weight. Pull up. Push up. Right Hand. Left Hand. Chest. Back. Legs. Vault and Ladder. Lung Capacity. One-fourth Mile Run. Product. Total.
Oct. 31, ’03 167 4 3 121 85 120 310 615 D 480 2.40 1252 2504
Nov. 23, ’03 168 6 4 140 90 120 370 1050 F 480 1.30 1685 3455
Dec. 1, ’03 172 10 6 130 95 124 345 565 F 480 1.20 2752 4011
Dec. 15, ’03 165 7 4 135 85 120 350 720 F 485 1.19 1820 3230
Dec. 29, ’03 164 8 9 110 85 90 250 415 E 500 1.20 2788 3538
Jan. 12, ’04 165 6 11 118 72 115 425 560 E 525 1.18 2809 4099
Feb. 9, ’04 165 11 5 142 117 125 600 880 E 510 1.25 2640 4504
Feb. 23, ’04 165 12 5 130 95 120 580 960 E 520 1.18 2813 4678
Mar. 8, ’04 162 11 7 125 80 110 550 875 E 500 1.21 2916 4656
Mar. 22, ’04 165 10 2* 125 85 110 600 830 E 500 1.16 1986 3736
Apr. 2, ’04 161 11 8 140 110 115 720 1030 E 495 1.17 3063 5178
COHN.
Weight. Pull up. Push up. Right Hand. Left Hand. Chest. Back. Legs. Vault and Ladder. Lung Capacity. One-fourth Mile Run. Product. Total.
Nov. 13, ’03 142 3 6 50 75 80 245 340 D 320 2.30 1420 2188
Nov. 23, ’03 144 7 5 105 95 87 270 430 D 360 1.38 1802 2687
Dec. 1, ’03 145 7 8 85 70 105 310 490 D 350 1.28 2253 3313
Dec. 15, ’03 141 89 65 80 270 370 D 360 1.25
Dec. 29, ’03 142 6 7 80 60 87 230 380 D 320 1.33 1846 2513
Jan. 12, ’04 141 1 9 70 70 80 280 370 F 350 1.20 1410 2290
Jan. 26, ’04 140 6 5 112 73 100 300 370 F 365 1.18 1542 2497
Feb. 9, ’04 142 6 10 90 75 90 350 475 F 360 1.19 2280 3360
Feb. 23, ’04 143 7 11 85 90 100 260 450 F 370 1.16 2583 3568
Mar. 22, ’04 142 8 10 85 99 100 260 360 E 360 1.16 2556 3460
Apr. 1, ’04 138 9 11 90 90 97 370 580 E 400 1.14 2775 4002
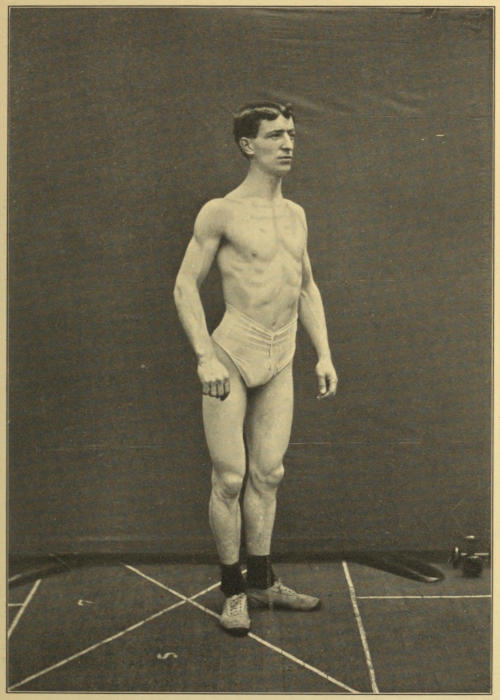
SLINEY
Photograph taken at the close of the experiment.
BROYLES.
Weight. Pull up. Push up. Right Hand. Left Hand. Chest. Back. Legs. Vault and Ladder. Lung Capacity. One-fourth Mile Run. Product. Total.
Nov. 13, ’03 130 6 4 105 95 90 340 560 D 485 1.45 1870 2560
Nov. 23, ’03 127 9 10 95 100 95 370 630 F 465 1.17 2422 3007
Dec. 1, ’03 130 13 11 130 120 105 420 680 F 480 1.14 3126 4581
Dec. 15, ’03 129 9 13 110 110 125 370 470 F 510 1.12 2843 4023
Dec. 29, ’03 123 15 11 105 90 125 300 600 E 480 1.14 3204 4424
Jan. 12, ’04 126 15 12 101 95 130 370 580 E 485 1.14 3415 4691
Jan. 26, ’04 130 10 8 103 95 120 470 890 E 480 1.15 2345 4022
Feb. 9, ’04 130 10 10 105 105 115 510 625 E 500 1.15 2615 4075
Feb. 23, ’04 134 12 6 115 100 115 550 850 E 505 1.15 2425 4155
Mar. 8, ’04 132 15 8 110 110 120 525 900 E 510 1.17 3047 4812
Mar. 22, ’04 138 12 12 110 110 125 470 850 E 510 1.14 3320 4989
Apr. 2, ’04 133 15 13 105 110 135 560 875 E 515 1.15 3745 5530
The main things in Dr. Anderson’s report especially to be emphasized are (1) the gain in self-reliance and courage of the men under training, indicative as they are of the better physical condition of their bodies, and (2) the marked increase in their strength as indicated by the steady improvement in the strength or dynamometer tests. Obviously, the daily training to which the men were subjected in the Gymnasium is not to be overlooked as one factor in bringing about the gain in accuracy and skill, and indeed this factor must count for something in explaining the general gain in bodily strength, but increased skill alone will not account for the great gain in muscular power.
The results of these systematic tests make it very evident that the men were not being weakened by the lowered intake of proteid food. On the contrary, their ability to do muscular work was greatly increased; a fact which cannot well be connected with anything other than the physiological economy which was being practised. There must be enough food to make good the daily waste of tissue, enough food to furnish the energy of muscular contraction, but any surplus over and above what is necessary to supply these needs is not only a waste, but may prove an incubus, retarding the smooth working of the machinery and detracting from the power of the muscular mechanism to do its best work.
The figures showing the total strength of the men in October, 1903, on their ordinary diet, and on the second day of April, 1904, when the experiment was nearing completion are certainly very impressive.
TOTAL STRENGTH
October April
Henderson 2970 4598
Oakman 3445 5055
Morris 2543 4869
Zooman 3070 5457
Coffman 2835 6269
Steltz 2838 4581
Loewenthal 2463 5277
Sliney 3245 5307
Fritz 2504 5178
Cohn 2210 4002
Broyles 2560 5530
Here we see gains in strength of 100 per cent in some cases, while Coffman shows an improvement so marked as to be almost marvellous. While there can be no question that a certain amount of this gain is to be attributed to the practice incidental to these months of work in the Gymnasium, it is equally clear that a large part of the gain is due to the improved physical condition of the men’s bodies, for which the change in diet must be considered as responsible. In any event, the change from the ordinary diet to a diet comparatively poor in proteid has not resulted in any physical deterioration. On the contrary, there is every indication of a marked improvement in physical condition. In this connection the following note from Dr. DeWitt, commanding the detachment, is of interest:
332 Temple Street, New Haven, Conn., March 30, 1904.
Professor Russell H. Chittenden, Director Sheffield Scientific School, New Haven, Conn.
Sir,—In compliance with your verbal request I have the honor to inform you that at this date the men of this detachment are all in good physical condition.
Very respectfully,
(Signed) Wallace Dewitt, 1st Lieut. and Asst. Surgeon U. S. Army, Commdg. Det. H. C.
Finally, attention may be called to the photographs of the men, taken just prior to the close of the experiment, from which may be gained some idea of their physical condition so far as it can be judged by external appearance. Certainly, there is no indication in these photographs of any lack of bodily vigor. On the contrary, there is good muscular development, without any undue amount of fat, and indeed every indication of a good bodily condition, coupled with that appearance of quickness and alertness that belongs to the well-developed man, in a state of physiological balance. The photographs scattered through this section of the book, showing the soldiers at work in the gymnasium, likewise give some idea of the lighter forms of exercise they followed each day in the training of bodily movements.
What now is to be said regarding the nervous condition of the men; i. e., their ability to respond to stimulation or, in other words, their mental quickness or reaction time? To study this question, the soldiers were sent with regularity to the Yale Psychological Laboratory, where their reaction time was studied with great care. The results of this investigation are contained in the following report made by Dr. Charles H. Judd, in charge of the Yale Psychological Laboratory.
REPORT ON REACTION TIME.
In order to test the quickness of the members of the Hospital Corps Detachment, and to determine whether the changes in diet affected in any way their ability to respond promptly to sensory stimulation, each man was carried through a series of reaction experiments at the Yale Psychological Laboratory. The method of the experiments was that regularly employed in simple reaction time experiments. The person whose reaction time is to be measured is seated in a comfortable position with his finger pressing on an electric key. He is told that he is to lift his finger from the key as quickly as possible when he hears a given sound-signal. The sounder which produces this signal and the electric key are placed in a circuit with a standard time-measuring apparatus—the Hipp Chronoscope. This chronoscope is arranged so that it begins to record the instant the sound is given and stops the instant the reactor lifts his finger. The dial of the chronoscope shows in thousandths of a second (hereafter designated by the technical term sigmas) the time that elapses between the sound to which the reactor is to respond and the movement of response. The chronoscope was tested at frequent intervals by means of a standard pendulum and errors in the record are well under two sigmas.
The time which is measured by this method is occupied chiefly by nervous processes. The following factors may be specified: First, the auditory organ is aroused by the sound; second, the afferent nerve transmits the stimulation to the central nervous system; third, the central nervous system carries the energy to the motor nerves; fourth, the efferent motor nerves transmit the stimulus to the muscles; and finally, some time is required by the muscle for its contraction. It will be seen, accordingly, that the chief factors of a reaction are nervous processes, and since the external conditions of successive reactions are in all respects uniform, any variations in the time of a given person’s reactions may be regarded as indicating variations in the nervous condition of the reactor. In view of the instability of nervous conditions, it is necessary to eliminate any slight or merely temporary fluctuations by taking each time a given reactor is tested a series of reactions. For this reason, a series of ten reactions was taken with each of the men every two weeks during November, December, and January. After an interval of two months, namely, on March 30, 31, and April 1, two final series were made with each man.
The results are presented in tables 1 to 5. The dates in the first column indicate the day on which each individual set of ten reactions was taken. The second column presents the averages of each ten reactions in sigmas. The third column gives the mean variations of the various single reaction times from the average. The fourth column gives the variations of the day’s average, recorded in column 2, from the general average of that individual for all his experiments. These general averages are presented in table 6. At the bottom of each complete column of averages will be found the group average. This quantity is obtained by averaging the results from all the members of the squad for periods of, approximately, two weeks.
The mean variations in the third column make it clear that the subjects did not settle down into what could be regarded as trained subjects. Trained subjects are expected to give mean variations which are consistently within the limits of 10 per cent of the average. While there are, of course, instances in which the mean variation falls within this limit, there is no consistent exhibition of the regularity indicative of thorough practice. This fact is further confirmed by a comparison of the results of March 30, 31, and April 1 with those of the earlier months. At the end of March, all effects of practice in November, December, and January, except the most general, may be regarded as having disappeared; and yet the averages and variations for the March and April dates resemble closely those of the month immediately preceding and also those of November. The effects of practice may, accordingly, be regarded as insignificant.
This lack of special training accounts for the large variations which appear in some cases. As is usual in reaction experiments, the signal to which the reactors were to respond was in each case preceded by about two seconds by a bell signal to arouse attention. Conditions were thus rendered as nearly uniform as possible, but the variations indicate in three or four cases exceptional lapses of attention. Such exceptional cases can be eliminated without prejudicing the final validity of the results by substituting the median for the averages. In table 7, the medians are grouped together and show even more than the tables of average the absence of any general variation during the period of the tests.
The obvious conclusion from these tests is that the quickness of the members of the squad underwent no general change during the whole period covered by the test. Individual members showed variations from time to time, but these variations are clearly accidental in character, for they show no regular tendencies and are in no way related to the changes in the character and amount of the diet.
(Signed) Charles H. Judd.
April 12, 1904.
The following tables give all the data upon which the foregoing conclusions are based, being furnished by Dr. Judd and Mr. Warren M. Steele, Assistant in Psychology, by whom the observations were made. Dr. Cloyd N. McAllister, Instructor in Psychology, was also associated in the making of these observations.
TABLE 1.—October, 1903.
Name. Date Avg. M.V. Var. from G.A. Date Avg. M.V. Var. from G.A.
I. Coffman 17 207.4 34.1 8.7
II. Henderson 17 179.9 31.5 21.2
III. Loewenthal 17 216.9 43.5 7.8
IV. Morris 17 227.7 19.8 3.7
V. Oakman 17 222.7 65.4 4.8 27 223.5 28.8 5.6
VI. Sliney 22 262.4 33.1 49.9 29 204.5 46.2 8.0
VII. Steltz 17 167.7 16.3 20.4 27 195.0 21.1 6.9
VIII. Zooman 17 264.9 32.1 50.0
IX. Fritz
X. Broyles
XI. Cohn
Group average (8 only) 218.7
TABLE 2.—November, 1903.
Name. Date Avg. M.V. Var. from G.A. Date Avg. M.V. Var. from G.A. Date Avg. M.V. Var. from G.A.
I. Coffman 6 303.7 37.9 87.6 20 215.9 22.8 0.5
II. Henderson 5 248.5 72.9 47.4 19 198.2 22.0 2.9
III. Loewenthal 13 190.1 23.7 34.6 30 229.7 37.4 5.0
IV. Morris 25 248.6 45.0 17.2
V. Oakman 10 185.9 13.9 32.0 24 212.1 21.9 5.8
VI. Sliney 12 200.1 25.3 11.0 26 209.2 24.6 3.3
VII. Steltz 10 203.2 45.7 15.1 24 163.8 31.4 24.3
VIII. Zooman 5 192.0 29.2 22.9 19 183.8 23.4 31.1
IX. Fritz 2 240.1 17.3 19.5 17 204.8 18.2 15.8 30 223.8 52.3 3.2
X. Broyles 17 184.7 23.0 3.2
XI. Cohn 23 279.1 50.7 70.3
Group average 211.8
TABLE 3.—December, 1903.
Name. Date Avg. M.V. Var. from G.A. Date Avg. M.V. Var. from G.A. Date Avg. M.V. Var. from G.A.
I. Coffman 4 230.1 22.5 14.0 18 184.7 21.4 31.4
II. Henderson 31 187.0 10.0 14.1
III. Loewenthal 11 224.6 33.0 0.1 26 217.9 10.5 6.8
IV. Morris 9 237.7 16.4 6.3 23 276.6 80.8 45.2
V. Oakman 8 233.5 19.5 15.6 22 220.5 17.5 2.6
VI. Sliney 10 218.3 25.4 5.8 24 197.1 24.1 15.4
VII. Steltz 8 178.3 15.9 9.8 22 201.7 20.3 13.6
VIII. Zooman 3 292.7 42.4 77.8 17 248.1 71.1 33.2 31 206.9 35.0 8.0
IX. Fritz 14 187.4 16.1 33.2 28 200.7 22.4 19.9
X. Broyles 1 180.3 13.8 7.6 15 188.0 25.8 0.1
XI. Cohn 7 243.3 111.1 34.5 21 177.0 16.2 31.8
Group averages 222.6 209.0
TABLE 4.—January and February, 1904.
Name. Date Avg. M.V. Var. from G.A. Date Avg. M.V. Var. from G.A. Date Avg. M.V. Var. from G.A.
I. Coffman 1 188.5 22.4 27.6 15 246.4 60.5 30.3 29 198.2 14.2 17.9
Feb.
II. Henderson 7 206.8 14.2 5.7 21 180.9 8.9 20.2 4 172.1 15.0 29.0
III. Loewenthal 8 208.0 13.2 16.7 22 201.8 16.5 12.9
IV. Morris 6 260.4 39.9 29.0 20 222.3 36.0 9.1 3 244.0 15.6 12.6
V. Oakman 5 235.7 33.4 17.8 19 215.5 17.8 2.4 2 197.0 19.8 20.9
VI. Sliney 14 186.6 20.0 25.9 28 167.9 11.3 44.6
VII. Steltz 5 211.5 9.1 23.4 19 200.4 29.2 12.3 2 169.9 13.9 18.2
VIII. Zooman 7 237.6 106.2 22.7 21 197.0 13.0 17.9 4 164.5 6.9 50.4
IX. Fritz 11 240.5 73.9 19.9 25 183.9 15.9 36.7
X. Broyles 12 211.6 33.3 23.7 26 203.6 21.7 15.7
XI. Cohn 4 187.1 34.3 21.7 18 195.8 23.7 13.0 1 195.4 47.2 13.4
Group averages 215.8 202.3
TABLE 5.—March and April, 1904.
Name. Date Avg. M.V. Var. from G.A. Date Avg. M.V. Var. from G.A.
I. Coffman 30 191.9 13.7 24.2 1 194.4 25.9 21.7
II. Henderson 31 195.2 15.2 5.9 1 241.3 27.2 40.2
III. Loewenthal 31 231.9 45.9 7.2 1 291.0 49.6 66.3
IV. Morris 31 174.4 11.4 57.0 1 190.7 18.6 40.7
V. Oakman 31 223.2 47.2 5.3 1 226.3 52.0 8.4
VI. Sliney 30 239.3 47.1 16.8 31 239.6 11.8 17.1
VII. Steltz 30 193.5 34.0 5.4 1 193.3 29.3 5.2
VIII. Zooman 30 196.6 11.6 18.3 1 179.8 15.6 35.1
IX. Fritz 31 244.5 48.9 23.9 1 259.7 39.3 39.1
X. Broyles 30 180.0 19.4 0.1 1 182.6 23.6 5.3
XI. Cohn 31 210.8 21.7 2.0 1 181.7 12.0 27.1
Group averages 207.4 216.4
TABLE 6.
Individual General Average. Av. Var. from Gen. Av.
I. Coffman 216.1 26.4
II. Henderson 201.1 20.7
III. Loewenthal 224.7 17.5
IV. Morris 231.4 24.5
V. Oakman 217.9 11.0
VI. Sliney 212.5 19.7
VII. Steltz 188.1 14.0
VIII. Zooman 214.9 33.4
IX. Fritz 220.6 23.5
X. Broyles 187.9 8.8
XI. Cohn 208.8 26.7
General group average 211.6
TABLE 7.
I. Coffman. II. Henderson. III. Loewenthal. IV. Morris. V. Oakman. VI. Sliney. VII. Steltz. VIII. Zooman. IX. Fritz. X. Broyles. XI. Cohn.
Month. Date. Median. Date. Median. Date. Median. Date. Median. Date. Median. Date. Median. Date. Median. Date. Median. Date. Median. Date. Median. Date. Median.
Oct. 17 207.4 17 181.5 17 196.0 17 238.0 17 171.0 22 272.0 17 168.0 17 260.0
Nov. 6 305.5 5 214.0 13 181.0 10 180.5 12 191.0 10 173.5 5 185.0 17 199.0 17 152.0
Nov. 20 216.0 19 198.0 30 217.0 25 224.5 24 199.0 26 201.5 24 174.5 19 184.0 30 214.0 23 251.5
Dec. 4 224.5 11 213.5 9 230.0 8 234.0 10 210.0 8 178.0 3 284.5 14 179.5 1 178.0 7 197.0
Dec. 18 176.0 31 185.5 26 219.5 23 233.5 22 227.0 24 188.0 22 199.5 17 229.5 28 188.0 15 187.5 21 179.0
Jan. 1 178.5 7 204.5 8 212.0 6 251.0 5 239.5 14 180.5 5 210.0 7 185.0 11 209.0 12 203.5 4 180.5
Jan. 15 204.4 21 181.5 22 209.0 20 222.5 19 209.5 28 171.0 19 193.0 21 199.5 25 184.0 26 204.0 18 187.0
Jan. 29 201.5
Feb. 4 172.5 3 243.0 2 193.0 2 168.0 4 164.5 1 190.5