APPENDIX
Reading edition
Value of 100-Calorie Portions of Common Foods
Edible Portion, Uncooked
Food Material Weight[40] Common Measures[41] Prot.[41] Fat[41] Cbhy.[41] Lime[40] Phos.[40] Iron[40]
Oz. Gr. Calories Calories Calories Grams Grams Grams
Almonds .54 15.5 8-12 13 77 10 .046 .132 .0003
Apples 5.61 159. 1 large 3 7 90 .022 .05 .0005
Apricots (dried) 1.27 36. 4 large 7 3 90 .031 .1
Bacon .56 16. 2 thin slices 7 93 0 .001 .04 .0002
Bananas 3.58 101.4 1 large 5 5 90 .01 .055 .0006
Barley flour 1. 28. 2 T.[44] 10 3 87 .083 .00028
Beans (dried), Lima 1.01 28.6 1½ T. 21 4 75 .028 .219 .00195
Beans, string 8.5 241. 1 qt. 15 48 37 .177 .284 .0038
Beef, round, lean 2.26 64. ½ × 2 × 2 in. 55 45 0 .01 .313 .002
Beets 7.66 217.1 2 med. 2 23 75 .06 .19 .0013
Bread, white 1.38 39.0 1 thick slice 13 6 81 .011 .075 .0003
Bread, whole wheat 1.44 40.7 1 thick slice 15 5 80 .016 .16 .0006
Butter .46 13. 1 T. scant .5 99.5 0 .003 .004
Chicken 3.27 92.6 ½ × 3 × 3 in. 90 10 0 .007 .25
Carrots 7.80 221.2 2 med. 10 8 82 .168 .22 .0016
Celery 19.07 540.6 2 heads 24 5 71 .54 .54 .0027
Cheese, American .8 22.8 1½ cub. in. 25 73 2 .25 .329
Cheese, cottage 3.21 91.1 3½ T. 76 8 16 .3 .4
Chestnuts 1.46 41.3 9 10 20 70 .017 .08 .0004
Cocoa .71 20.1 3 T. 17 52 31 .027 .22 .0005
Corn, green 3.49 99. 3 T. 13 10 77 .008 .21 .00075
Crackers, soda .85 24.2 2½ 9 20 71 .006 .054 .00035
Crackers, wheatsworth .81 23. 3 15 20 65 .016 .243 .0014
Crackers, oatmeal .81 23. 2 11 24 65 .03 .216 .0009
Crackers, graham .82 23. 2 9 20 71 .016 .243 .0014
Corn meal, granular .99 28.1 3 T. 10 5 85 .004 .08 .0003
Corn meal, unbolted[42] .92 3 T. 9
Cream, 20 per cent 1.49 40. 2 T. 5 86 9 .07 .10 .0001
Dates 1.02 28.8 4-6 2 7 91 .03 .03 .001
Eggs 2.38 67.5 1¼ 32 68 0 .06 .24 .0019
Egg white 6.92 196.1 7-8 100 0 0 .028 .05 .0002
Egg yolk .97 27.6 2 17 83 0 .05 .27 .0023
Figs 1.12 31.6 1 large 5 0 95 .089 .099 .001
Fish, cod (salt) 3.1 88. 1 c.[45] not packed 97 3 0 .036 .601 .001
Fish, haddock (fresh) 4.94 139.9 1 slice 1×2×3 in. 96 4 0 .04 .5
Fish, halibut (fresh) 2.93 82.5 1 slice ½×2×3 in. 61 39 0 .01 .3 .0002
Grape juice 3.53 100. 7 T. 0 0 100 .021 .04
Honey 1.03 30.6 4 t.[46] 1 0 99 .001 .01 .0003
Lady finger .96 27. 1 10 12 78 .01 .05 .0003
Lentils 1.01 28.7 2 T. 21 7 72 .03 .18 .0024
Lettuce 18.47 523.6 1 large head 25 14 61 .26 .47 .005
Macaroni .99 28. 16 sticks 15 0 85
Maple syrup 1.2 35. 4 t. 0 0 100 .06 .02 .0009
Milk, whole 5.1 144.5 ⅔ c. 19 52 29 .239 .303 .00034
Milk, skimmed 9.61 272.5 1⅓ c. 37 7 56 .478 .606 .00068
Molasses 1.23 34.9 1½ T. .5 0 95.5 .3 .1
Molasses cookie .95 27. 1 6 23 71 .01 .05 .0003
Oatmeal .88 25.1 4 T. 18 7 75 .03 .216 .0009
Olives (ripe) 1.3 38. 7 2 91 7 .06 .01 .0009
Onions 7.24 205.4 2½ large 13 5 82 .12 .24 .0011
Orange juice 8.17 231.5 1 large 0 0 100 .12 .07
Peaches (fresh) 8.53 242.1 2 large 7 2 91 .02 .113 .0007
Peanuts .62 18. 13 double 20 63 17 .018 .160 .00035
Peanut butter .58 16. 1 T. 19 64 17 .018 .160 .00035
Pears (fresh) 5.57 158. 1 large 4 7 89 .032 .09 .0005
Peas, dried .99 28.1 2 T. 28 2 70 .04 .25 .0015
Peas, green 3.52 99.9 4 T. 28 4 68 .032 .24 .0016
Pecans .46 13. 8 6 87 7 .016 .104 .00035
Pineapple (fresh) 8.18 232. ½ c. scant 4 6 90 .04 .14 .0011
Plums 4.18 118.5 3-4 large 4 6 90 .029 .064 .0006
Potatoes 4.23 120. 1 med. 11 1 88 .019 .166 .0015
Potatoes, sweet 2.86 81.2 1 small 6 5 89 .02 .08 .0004
Prunes (dried) 1.17 33.2 4-6 (30’s-40’s) 3 0 97 .02 .08 .0009
Raisins 1.02 29. 20 3 9 88 .02 .08 .001
Rhubarb 15.27 433. 8 stalks 10 27 63 .26 .3
Rice (polished)[43] 1.01 28.5 2 T. 9 1 90 .003 .057 .0003
Rye flour 1.01 28.5 3½ T. 8 0 92 .005 .22
Spinach 14.76 418.4 scant qt. 36 10 54 .37 .54 .0133
Squash 7.4 210. 9 T. 12 10 78 .054 .17 .0017
Sugar .86 25. 5 t. 0 0 100 0 0
Tomatoes fresh 15.47 438.6 2-4 med. 15 16 69 .087 .257 .0017
Tapioca .99 28.2 2 T. 0 0 100 0 0
Walnuts, Calif. .48 14. 6 10 83 7 .01 .108 .0003
Wheat flour entire .98 27.8 3½ T. 15 5 80 .01 .12 .0006
Wheat flour, wht., process 1. 28.3 3½ T. 12 3 85 .007 .05 .0004
Wheat, shredded .94 27. 1 13 4 83 .016 .243 .0014
Composition of Common Measure Portions of Food[41]
Edible Portion, Uncooked
Oz. Grams Total Cal. Prot. Fat Cbhy. Lime Phos. Iron
Calories Calories Calories Grams Grams Grams
Egg, whole 1.8 57 74 24 50 0 .044 .175 .0014
Egg, white 1.2 33 14 14 0 0 .004 .01 .00003
Egg, yolk .6 17 60 10 50 0 .03 .16 .0014
Wheat flour, entire, 1 T. .28 9.7 28 4 1 23 .017 .227 .0015
Wheat flour, entire, 1 cup 4.48 155.6 448 67 12 359 .268 4.076 .027
Wheat flour, white, 1 T. .3 8 28 3 1 24 .002 .014 .0001
Wheat flour, white, 1 cup 5. 142 500 60 15 425 .035 .25 .002
Milk, whole, 1 T. .7 20 14 3 7 4 .033 .042 .00005
Milk, whole, 1 pt. 17.2 487 337 64 175 98 .805 1.021 .0011
Milk, whole, 1 qt. 34.4 975 675 128 350 196 1.61 2.042 .0023
Milk, skimmed, 1 T. .7 20 7 2.5 .5 4 .035 .044 .00005
Milk, skimmed, 1 pt. 17.2 487 179 66 13 100 .85 .108 .0012
Sugar, gran., 1 t. .2 5 20 20
Sugar. gran., 1 T. .7 15 60 60
Sugar, gran., 1 cup 7.5 210 840 840
Foods with Acid Balance [47]
Figures are per 100-Calorie portion
Cereals and Grains Meats Eggs
Lentils 1.7 Beef 2 to 10 Yolk 7
Rice 2.7 Mutton 3 to 4 White 9.5
Corn 1.8 Veal 4 to 10 Whole 7.5
Wheat flour 2.7 Chicken 4 to 10
Whole Wheat 3.3 Fish 4 to 12
Possibly: prunes, plums, cranberries.[48]
Foods with Potential Alkalinity[47]
Figures are per 100-Calorie portion
Less than 5 5 TO 15
Dates Apples Peaches
Grapes Apricots Pineapple
Milk (2.6) Bananas Potatoes
Nuts (except peanuts) Beans Raisins
Onions Cherries Radishes
Pears Lemons Raspberry juice
Peas Oranges Squash
15 TO 25 Very High
Beets Celery 42.1
Cabbage Chard 41.1
Carrots Figs (dried) 32
Cauliflower Cucumbers 45
Cantaloupe Lettuce 38.6
Olives Rhubarb 37
Tomatoes Spinach 113
Principles of Growth
Height and weight are only one index of physical condition. They must be interpreted in connection with other factors, as organic and muscular conditions, appetite, energy.
Growth is not constant and regular but by spurts. Increase in height and in weight usually do not proceed together but alternate.
Two types of individuals are distinguished:
a. Rapid growth in height and weight until 9 to 12 years
Slower growth 12 to 16 years
Early maturity (12 to 14 years, girls; 13 to 15 years, boys);
b. Slow growth in height and weight until 12 to 12 years
Rapid growth after acceleration begins
Late maturity (14 to 16 years, girls; 15 to 18 years, boys).
Growth is influenced by various factors.
I. Heredity.
1. Race. Americans average heavier than Europeans, and taller than Europeans except Swedish, Danish, and Dutch. Children of Irish parentage average taller than children of German parentage. Children of American-born parents are in this country taller and heavier than children of foreign-born parents.
2. Family. Children tend to approximate height and build of family; good hygiene slightly increases average above immediate ancestors.
3. Sex. See pages 372-375.
II. Environment and Hygiene.
1. Hygiene. Good hygiene promotes growth in height and weight. Breastfed babies are usually found to increase more rapidly than those artificially fed, and this growth impulse continues through life. See page 100.
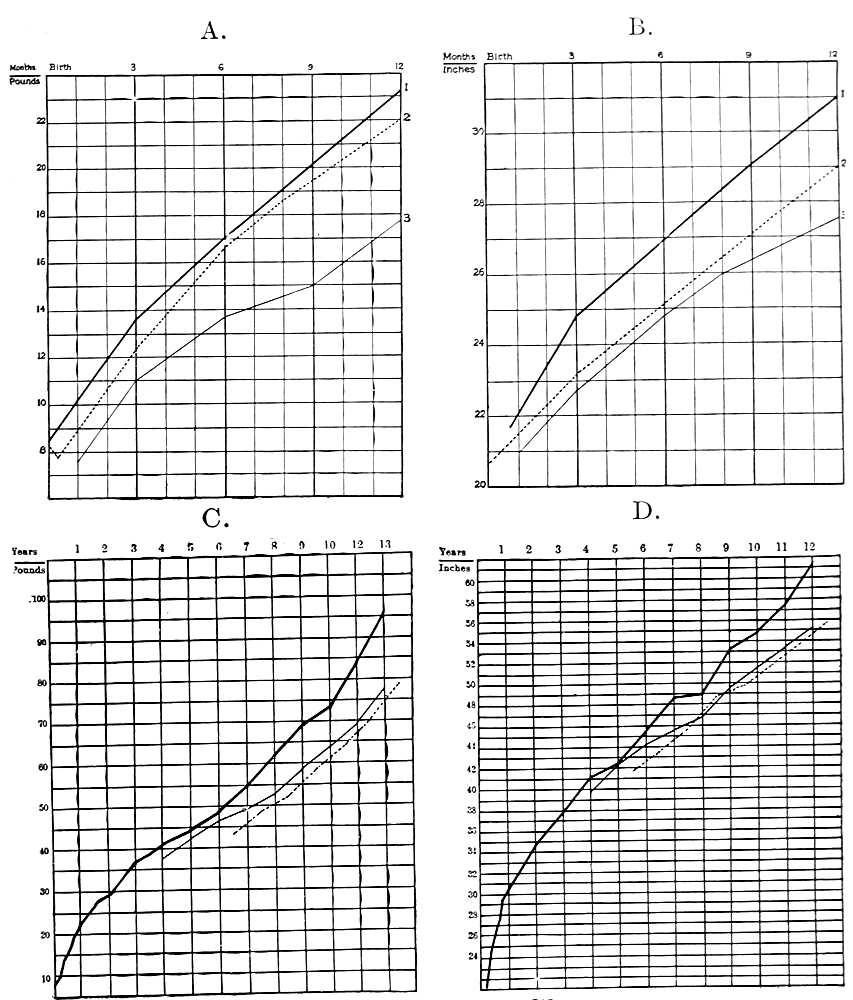
Height and Weight Charts.
A. Weight during the first year of 120 well-cared-for children (1) ====; compared with the average given by Dr. Holt (2) ....; and that of 500 institution children (3) ——.
B. Height during the first year of 120 well-cared-for children (1) ====; compared with the average given by Dr. Holt (2) ....; and that of 500 institution children (3) ——.
C. Weight of 278 well-cared-for children, ====; compared with 1,000 orphan asylum children, ——; and 69,000 school children, .....
D. Height of 278 well-cared-for children, ====; compared with 1,000 orphan asylum children, ——; and 98,000 school children, .....
A comparative study recently made of (a) 278 children in well-nourished families, (b) 1,000 orphan asylum inmates, (c) 69,000 public school children, revealed a difference of six (6) inches average height and twenty (20) pounds average weight, at twelve years of age, in favor of the first group, living under good conditions of nourishment, exercise, and hygiene, above the public-school group, the asylum group being intermediate.[49]
Illness retards growth, especially weight; adenoids retard growth in height and weight.
2. Urban or rural environment. Country children average taller, heavier, and greater lung capacity than city children.
3. Season. In the North Temperate Zone, increase in height is greatest from December to July, least from June to January; growth in weight is the reverse.
Maturity. Various factors influence the age of physiological maturity.
1. Sex. Girls mature at from 12 to 16 years, two years earlier than boys,—from 14 to 18 years. The period of adjustment is longer, slower, and with less stress and upheaval with boys than with girls.
2. Growth. Children above the average in height and weight at 12 years mature earlier than those at or below average height and weight.
3. Climate. Maturity is earlier in warm climates, and later in cold climates.
4. Urban or rural environment. Maturity is earlier with city children, later with country children.
5. Stimulation. Stimulating physical or psychical influences, as a stimulating diet, use of alcohol, early social dissipation, reading and plays that stimulate sex interest, tend to cause earlier maturity.
Children mentally defective, retarded, or laggards in school, are usually shorter and lighter weight and smaller lung capacity than the median for normal children.
Children above the median in height, weight, and lung capacity (the three are usually found together) are usually above the average in school grades of other children the same chronological age. Such children may be from 1 to 5 years older physiologically and mentally than children of the same chronological age who are below the median in height and weight.
Proportions.
During the entire growth period the proportions of different parts are constantly changing because of their uneven rate of growth. The awkwardness, easy fatigue, and weakness during childhood and adolescence are in no small measure due to these changing proportions and their inadequacy as compared with their adjustment in maturity.
The following variations from the average are indices of weakness, and measures should be taken for bringing them to normal.[50]
1. Over average weight with under average height.[50]
2. Under average weight with over average height.[50]
3. Chest circumference less than head circumference after two years, or less by more than one-fourth inch under two years; or chest circumference less than the following proportions of the body length: first year, 60%; 1 to 6 years, 56%; 6 to 9 years, 52%.[51]
4. Circumference of abdomen more than chest.
The Tables for the first five years are a composite of the figures by Holt (compiled from several hundred hospital and private practice cases in New York City), the American Medical Association (compiled from several thousand cases in 23 States), the Life Extension Institute, and the Better Babies’ Bureau of the Woman’s Home Companion. In the main, the minimum figures are those of Dr. Holt, the maximum those of the Woman’s Home Companion. The figures of Dr. Freeman from 278 children in private practice (see page of Charts) are from 5 to 10 per cent higher than the maximum given in the Tables, for height and weight.
All measurements are without clothing.
Height—Boys[52]
Age Range Inches Gain Inches Age Range Inches Gain Inches
Birth 19½-20½ 2 yr 31-33¾ 3-4
3 mo 21-23½ 3½ 3 yr 34-37 3-3½
6 mo 25-26½ 3¼ 4 yr 36-39½ 1-3
1 yr 29-29½ 9-10 5 yr 39-42½ 1-3
Until acceleration period, annual gain 1-2 inches. During acceleration, annual gain 2-3 inches.
Acceleration period: girls, 11 to 14 years; boys, 13 to 15.
Slight gains after acceleration period.
After three years, height varies during day, being greatest on rising, shortest at night.
Weight—Boys[53]
Age Range Pounds Gain Pounds
Birth 6½-7½ Weight doubled: 5 months
3 mo 12½- Weight trebled: 1 year
6 mo 16-17½ Weight quadrupled: 2½ years
9 mo 17½-20 Weight fivefold: 4 years
1 yr 20½-22 12-15 Loss of weight first 3 days
2 yr 26½-27½ 5½-6 Regained by 7th to 10th day
3 yr 31½-33½ 4½-6 Weekly gain:
4 yr 35-38 3½-4½ 1st 5 months, 6 to 8 ounces
5 yr 41-43 5-6 To 1 year, 4 to 6 ounces
Acceleration period: girls, 11 to 16 years; boys, 13 to 18.
Weight varies during day, being greatest after supper, lowest before breakfast.
Girls nearly cease growing at about 17 years, boys at about 23 years.
Lung capacity is greater in boys than girls, all ages.
Relative Weight and Height Table—Boys [54]
The figures represent weight in pounds
Height in Inches 5 Yrs. 6 Yrs. 7 Yrs. 8 Yrs. 9 Yrs. 10 Yrs. 11 Yrs. 12 Yrs. 13 Yrs. 14 Yrs. 15 Yrs. 16 Yrs. 17 Yrs. 18 Yrs. 19 Yrs. 20 Yrs.
39 35
40 38 36
41 39 39
42 41 41
43 42 42 42
44 46 44 43
45 46 46 45
46 48 48 48
47 49 50 50
48 54 53 53 53
49 54 55 55
50 57 58 58
51 59 60 60 61
52 62 62 61 63
53 62 65 65 67 67 67
54 65 68 68 70 71 71
55 69 71 75 75 76
56 71 77 76 78 79 79
57 77 79 80 82 82
58 78 84 85 86 87
59 84 86 90 91
60 85 91 94 95 90
61 98 97 99 96
62 99 103 106 104 104
63 100 107 112 112 110 118
64 114 118 120 117 120 120
65 122 119 122 122 120 126 125
66 121 125 125 126 129 130
67 128 129 128 131 134 132
68 133 133 130 136 136 136
69 134 136 139 139 139
70 136 140 143 144 145
71 140 146 146 146
72 149 154
73 165
Relative Weight and Height Table—Girls[54]
The figures represent weight in pounds
Height in Inches 5 Yrs. 6 Yrs. 7 Yrs. 8 Yrs. 9 Yrs. 10 Yrs. 11 Yrs. 12 Yrs. 13 Yrs. 14 Yrs. 15 Yrs. 16 Yrs. 17 Yrs. 18 Yrs. 19 Yrs. 20 Yrs.
39 34
40 37 35
41 38 37
42 41 39 39
43 41 41 42
44 45 43 44 42
45 45 45 45
46 48 47 47
47 50 49 49
48 51 51
49 53 53 54
50 56 56 57
51 59 58 60
52 63 62 62 63
53 64 63 66 65
54 69 68 69 68
55 70 71 73
56 75 75 76 78
57 78 80 83
58 83 86 88 89
59 88 89 93 97 100
60 94 94 96 100 104 109 103 99 99
61 99 100 102 109 109 106 105 111
62 104 104 106 111 110 107 111 114
63 107 109 116 110 112 113 114
64 112 118 116 117 114 119 115
65 114 118 121 125 120 123 125
Pulse[55]
Age Per Minute
Birth 130
6-12 mo. 105-115
2-6 yr. 90-105
7-10 yr. 80-90
11-14 yr. 75-85
Respiration[56]
(During sleep)
Age Per Minute
Birth 35
1 yr. 27
2 yr. 25
6 yr. 22
12 yr. 20
Adult 16-18
Pulse and respiration in infants may be normally irregular and the rate greatly modified by apparently slight causes. In very young infants regular rhythmic breathing is seen only in sleep, and rhythm is not fully established before two years.
Temperature in young children is normally 98°-99.5°F., taken by rectum; it occasionally rises to 100.5 in apparently perfect health. It is normally higher in late afternoon.[57]
The rate of circulation (time required from leaving the heart till return to the heart) is in the newly born 12 seconds, at 3 years 15 seconds, in the adult 22 seconds.[57]
Infant Mortality
The infant mortality rate is the number of deaths of babies which occur for every 1,000 live births. Figures in the United States are available only for that part of the country known as the registration area, where the reporting of births and deaths is legally required. It is important that the birth of every child should be registered, and that laws requiring registration should be enforced in every State.
Deaths of Infants Under One Year of Age Per 1,000 Live Births in Foreign Countries[58]
Country Year Rate
Russia 1909 248
Ceylon 1912 215
German Empire 1911 192
Austria 1912 180
Italy 1911 153
Switzerland 1911 123
England and Wales 1912 95
Ireland 1912 86
France 1912 78
Australia 1912 72
Norway 1911 65
New Zealand 1912 51
The New York Milk Committee states that an infant mortality rate above 50 per 1,000 is preventable by sanitation, hygiene, prenatal care, and the instruction of mothers; and that a rate beyond this is unfair to the babies, and a disgrace to the community for its negligence.
Principal Causes of Death During Growth
Registration Area, United States, including about 65 per cent. of population. For the year 1913.
Cause of Death Under 1 Yr. 1-2 Yrs. 2-3 Yrs. 3-4 Yrs. 4-5 Yrs. 5-9 Yrs. 10-20 Yrs.
1. Congenital debility 60,551
2. Premature birth 27,359
3. Injuries at birth 5,131
4. Digestive 43,243 9,942 2,653 1,124 697 1,968 2,939
5. Respiratory (except tuberculosis, chiefly pneumonia) 25,274 9,272 3,567 1,724 1,055 2,296 2,502
Tuberculosis 2,491 1,879 1,053 693 507 1,702 8,350
6. Whooping cough 3,442 1,516 596 301 152 246 40
7. Measles 2,011 2,562 1,117 584 302 660 346
8. Diphtheria and croup 913 1,857 1,781 1,498 1,293 3,171 918
9. Scarlet fever 255 618 798 684 603 1,563 621
10. Influenza 608 171 105 47 42 126 202
11. Smallpox[59] 27 4 4 3 5 8
The death rate is higher during the first five years than at any other five-year period; higher during the first year than any other year; highest during the first month; and its maximum is during the first week of life.
It is estimated that about fifty per cent. of all children die before they are born. Life is conferred at conception, and miscarriage is really death before birth. The registration of stillbirths, with causes, should be required by law, as it now is in some foreign countries.
Diarrhea and other digestive disorders are prevalent causes in summer; pneumonia and colds in winter.
Of the deaths from summer diarrhea, about 90 per cent. are babies artificially fed, compared with 10 per cent. naturally fed.
Mortality in Pregnancy
United States Registration Area, 1913
Puerperal septicemia (blood poisoning, due to lack of surgical cleanliness in care) 4,542
Albuminaria and convulsions (usually preventable by regular examination of urine) 2,397
Accidents (frequently preventable by prenatal hygiene and skilful medical supervision) 2,703
Other causes 368
10,010
Most of these deaths were due to preventable causes.
Even with these preventable deaths, the chances of death in childbirth were only 1 in about 200 births.
In every community where instruction has been provided in prenatal hygiene and the care of infants, a marked reduction has resulted, both in prenatal deaths, in mortality in pregnancy, in infant mortality and in the inability of mothers to nurse their babies.