Volume 2 — I. METEOROLOGY AND CLIMATOLOGY. (continued 2)
Reading edition
The recent great advances in meteorology have rendered the old textbooks obsolete, while the new data, especially those regarding the upper regions of the atmosphere, have not yet been built into a coherent system. Sir Napier Shaw’s ‘Forecasting Weather’ (London, Constable & Co.) is a pioneer discussion, and the numerous publications of the Meteorological Office, South Kensington, London, S.W.7, may be consulted with much advantage.
Daily synoptical weather-maps are published by the Weather Service of almost every civilised country. Those for the United Kingdom may be obtained from the Meteorological Office of the Air Ministry. The only weather-maps of large areas produced regularly are the Pilot Charts of the North Atlantic and the North Pacific, published monthly by the Hydrographic Office at Washington, and those of the North Atlantic and Mediterranean published monthly by the Meteorological Office in London. These show the tracks of cyclones, and give a great deal of information as to the meteorology and currents of the oceans. They are intended primarily for the use of sailors.
The following list gives the name of the official weather service of all countries outside Europe and the town in which the head office is situated. Application might be made to any of these offices for information as to the stations where standard instruments are established in the country in question.
Extra-European Weather Services.
Country. Name. Place.
America:—
Canada Meteorological Service of the Dominion of Canada Toronto.
United States and West Indies Weather Bureau Washington.
Mexico Observatorio meteorologico magnetico central Mexico.
Salvador Observatorio Astronomico y Meteorologico San Salvador.
Guatemala Instituto fisico-geografico San José.
Cuba Real Colegio de Belen de la compania de Jesus Havana.
Brazil Central Meteorological Department of the Navy Rio de Janeiro.
Uruguay Observatorio meteorologico del colegio pio de Villa Colon Montevideo.
Argentina Oficina meteorologica Argentina Buenos Aires.
Chile Oficina meteorologica Santiago.
Peru Harvard College Observatory Arequipa.
Africa:—
Algeria Service météorologique Algiers.
British Central Africa Zomba.
Egypt Observatory Helwan.
Madagascar Observatoire Tananarive.
Mauritius Royal Alfred Observatory Pamplemousses.
Union of South Africa Meteorological Branch, Irrigation Department Johannesburg.
Asia:—
India Meteorological Department Calcutta.
Japan Central Meteorological Observatory Tokyo.
Ceylon Surveyor-General’s Office Colombo.
Hongkong Observatory Hongkong.
China Imperial Maritime Customs Peking.
” Observatoire de Zi-ka-wei Shanghai.
Philippine Islands Weather Bureau Manila.
Dutch East Indies Magnetic and Meteorological Observatory Batavia.
Australasia and Pacific:—
Australia Commonwealth Meteorological Service Melbourne.
New Zealand Meteorological Office Wellington.
Hawaii Weather Bureau Honolulu.
In addition to the above, which are regular government services specially organised for publishing and utilising the data from numerous observing stations, there are many isolated stations in all parts of the world. There are no colonies which do not possess some meteorological stations, and at many mission stations meteorological observations are made. It would always be well for a traveller to try to ascertain where in the vicinity of his route meteorological stations have been established and over what period of time their records extend.
In the Table (pp. 44-49), taken from Marriott’s “Hints to Meteorological Observers,” is given the relative humidity for every 2° of temperature from 20° to 80°, and for every two-tenths of a degree of difference between the dry and wet-bulb readings from 0°·2 to 18°·0.
To use the Table: Look in the column on the left or right for the nearest degree to the dry-bulb reading; then carry the eye horizontally along until the column is reached corresponding to the difference between the readings of the dry and wet-bulb thermometers, when the relative humidity will be found. Intermediate readings can be interpolated in the usual way.
Example: Dry-bulb 58°·5, wet-bulb 52°·7, the difference is 5°·8. Having found 58° in the column on the left or right, run the eye along this line until the column under 5°·8 is reached, when the relative humidity will be found, viz., 67.
Table of Relative Humidity.
Dry Bulb Reading. Difference between the Readings of the Dry and Wet Bulb Thermometers.
° ° ° ° ° ° ° ° ° ° ° ° ° ° °
0.2 0.4 0.6 0.8 1.0 1.2 1.4 1.6 1.8 2.0 2.2 2.4 2.6 2.8 3.0
°
20 93 86 80 74 68 63 59 55 51 47 44 41 37 34 32
22 94 88 82 76 70 65 60 56 53 50 47 44 41 38 36
24 94 88 83 78 73 69 65 61 57 53 50 47 44 42 39
26 95 90 85 80 76 72 68 64 61 57 54 51 48 45 43
28 96 92 88 84 80 76 72 69 66 63 60 57 54 52 50
30 96 93 90 87 84 81 78 75 72 70 67 64 62 60 58
32 97 94 91 89 87 84 82 80 78 76 73 71 69 67 65
34 97 95 93 91 89 87 85 83 81 80 78 76 74 72 71
36 98 96 94 93 91 89 87 86 84 82 80 79 77 76 74
38 98 96 94 93 91 89 87 86 85 83 81 80 78 77 76
40 98 97 95 94 92 90 88 87 86 84 82 81 79 78 76
42 98 97 95 94 92 90 88 87 86 84 83 81 80 78 77
44 98 97 95 94 92 90 88 87 86 84 83 82 81 79 78
46 99 97 95 94 92 91 89 88 87 85 84 82 81 79 78
48 99 97 95 94 92 91 89 88 87 85 84 82 81 80 79
50 99 97 96 94 93 92 90 89 88 86 85 83 82 80 79
52 99 97 96 94 93 92 90 89 88 86 85 83 82 81 80
54 99 97 96 94 93 92 90 89 88 86 85 83 82 81 80
56 99 97 96 94 93 92 90 89 88 87 86 84 83 82 81
58 99 97 96 94 93 92 90 89 88 87 86 85 84 83 82
60 99 97 96 94 93 92 91 90 89 88 86 85 84 83 82
62 99 98 96 95 94 93 91 90 89 88 86 85 84 83 82
64 99 98 96 95 94 93 91 90 89 88 86 85 84 83 82
66 99 98 96 95 94 93 91 90 89 88 87 86 85 84 83
68 99 98 96 95 94 93 92 91 90 89 87 86 85 84 83
70 99 98 96 95 94 93 92 91 90 89 87 86 85 84 83
72 99 98 96 95 94 93 92 91 90 89 87 86 85 84 83
74 99 98 96 95 94 93 92 91 90 89 88 87 85 85 84
76 99 98 97 96 95 93 92 91 90 89 88 87 86 85 84
78 99 98 97 96 95 94 93 92 91 90 89 88 87 86 85
80 99 98 97 96 95 94 93 92 91 90 89 88 87 86 85
Dry Bulb Reading. Difference between the Readings of the Dry and Wet Bulb Thermometers.
° ° ° ° ° ° ° ° ° ° ° ° ° ° °
3.2 3.4 3.6 3.8 4.0 4.2 4.4 4.6 4.8 5.0 5.2 5.4 5.6 5.8 6.0
°
20 29 27 25 23 21 19 18 17 16 15 14 13 12 11 10
22 33 31 29 27 25 23 21 19 18 17 15 14 13 12 11
24 36 34 32 30 29 27 25 23 21 19 18 17 16 15 14
26 41 39 37 35 33 31 29 27 26 25 23 21 20 19 18
28 48 46 44 42 40 38 36 34 33 32 30 29 27 26 25
30 55 53 51 49 47 45 44 42 40 39 37 36 35 33 32
32 63 61 60 58 56 54 53 51 50 48 47 45 44 42 41
34 69 67 65 63 62 60 59 57 56 55 53 52 51 50 49
36 72 71 69 68 66 64 63 61 60 59 58 57 55 54 53
38 74 73 71 70 69 67 66 64 63 62 61 60 58 57 56
40 75 74 72 71 70 68 67 65 64 63 62 61 60 59 58
42 76 75 73 72 70 69 68 66 65 64 63 62 61 60 59
44 77 76 74 73 72 71 70 68 67 65 64 63 62 61 60
46 77 76 74 73 72 71 70 68 67 66 65 64 63 62 61
48 78 77 75 74 73 72 71 69 68 67 66 65 64 63 62
50 78 77 75 74 73 72 71 70 69 68 66 65 64 63 62
52 79 78 76 75 74 73 72 71 70 69 67 66 65 64 62
54 79 78 77 76 75 73 72 71 70 69 68 67 66 65 64
56 80 79 77 76 75 74 73 72 71 70 69 68 67 66 65
58 81 80 78 77 76 75 74 73 72 71 70 69 68 67 66
60 81 80 78 77 76 75 74 73 72 71 70 69 68 67 66
62 81 80 79 78 77 76 75 74 73 72 71 70 69 68 67
64 81 80 79 78 77 76 75 74 73 72 71 70 69 68 68
66 82 81 80 79 78 77 76 75 74 73 72 71 70 69 68
68 82 81 80 79 78 77 76 75 74 73 72 71 70 69 69
70 82 81 80 79 78 77 76 75 74 74 73 72 71 70 69
72 82 81 80 79 79 78 77 76 75 74 73 72 71 70 70
74 83 82 81 80 79 78 77 76 75 74 73 72 71 70 70
76 83 82 81 80 80 79 78 77 76 75 74 73 72 71 71
78 84 83 82 81 80 79 78 77 76 75 74 73 72 71 71
80 84 83 82 81 80 79 78 77 76 76 75 74 73 72 72
Dry Bulb Reading. Difference between the Readings of the Dry and Wet Bulb Thermometers.
° ° ° ° ° ° ° ° ° ° ° ° ° ° °
6.2 6.4 6.6 6.8 7.0 7.2 7.4 7.6 7.8 8.0 8.2 8.4 8.6 8.8 9.0
°
20 9 8 7 6 6 6 5 5 5 5 .. .. .. .. ..
22 10 9 9 8 8 7 7 6 6 5 5 5 5 4 4
24 13 12 11 10 10 9 9 8 8 7 7 6 6 6 5
26 17 16 15 14 14 13 12 11 10 10 9 9 8 8 7
28 24 23 21 20 19 18 17 16 15 15 14 14 13 13 12
30 31 30 29 28 28 27 26 25 24 23 22 21 20 19 18
32 39 38 37 36 35 34 33 32 31 30 29 29 28 27 27
34 47 46 45 44 43 41 40 39 38 37 36 36 35 34 33
36 52 51 49 48 47 46 45 44 43 42 41 40 39 39 38
38 55 54 52 51 50 49 48 47 46 45 44 43 42 42 41
40 57 56 54 53 52 51 50 49 48 47 46 45 44 44 43
42 58 57 56 55 54 53 52 51 50 49 48 47 46 45 44
44 59 58 57 56 55 54 53 52 51 50 49 48 47 46 46
46 60 59 58 57 56 55 54 53 52 51 50 49 48 47 47
48 61 60 59 58 57 56 55 54 53 52 51 50 49 48 48
50 61 60 59 58 58 57 56 55 54 53 52 51 50 49 49
52 62 61 60 59 59 58 57 56 55 54 53 52 51 50 50
54 63 62 61 60 59 58 57 56 55 55 54 53 52 51 51
56 64 63 62 61 60 59 58 57 56 56 55 54 53 52 52
58 65 64 63 62 61 60 59 58 57 57 56 55 54 53 53
60 65 64 63 62 62 61 60 59 59 58 57 56 55 54 54
62 66 65 64 63 63 62 61 60 59 58 57 56 56 55 55
64 67 66 65 64 63 62 61 60 59 59 58 57 57 56 55
66 67 66 65 64 64 63 62 61 60 60 59 58 58 57 56
68 68 67 66 65 65 64 63 62 61 60 59 58 58 57 56
70 68 67 66 65 65 64 63 62 61 61 60 59 59 58 57
72 69 68 67 66 65 64 63 62 61 61 60 60 59 58 58
74 69 68 67 66 66 65 64 63 62 62 61 61 60 59 59
76 70 69 68 67 66 65 65 64 63 63 62 61 61 60 59
78 70 69 68 67 67 66 65 64 63 63 62 61 61 60 60
80 71 70 69 68 67 67 66 65 64 64 63 62 62 61 60
Dry Bulb Reading. Difference between the Readings of the Dry and Wet Bulb Thermometers.
° ° ° ° ° ° ° ° ° ° ° ° ° ° °
9.2 9.4 9.6 9.8 10.0 10.2 10.4 10.6 10.8 11.0 11.2 11.4 11.6 11.8 12.0
°
20 .. .. .. .. .. .. .. .. .. .. .. .. .. .. ..
22 .. .. .. .. .. .. .. .. .. .. .. .. .. .. ..
24 5 5 5 5 4 .. .. .. .. .. .. .. .. .. ..
26 7 6 6 6 5 5 5 5 5 4 .. .. .. .. ..
28 12 11 10 10 9 9 8 8 7 7 7 6 6 6 5
30 17 16 15 15 14 14 13 13 12 12 12 11 11 10 10
32 26 25 24 23 23 22 21 20 20 19 19 18 17 17 16
34 33 32 31 30 30 29 28 27 27 26 26 25 24 24 23
36 37 36 35 34 34 33 32 31 31 30 30 29 28 28 27
38 40 39 38 37 36 35 34 33 33 32 32 31 30 30 29
40 42 41 40 39 38 37 36 35 35 34 34 33 32 32 31
42 43 42 41 40 40 39 38 37 36 36 35 34 33 32 32
44 45 44 43 42 41 41 40 39 39 38 37 36 35 34 34
46 46 45 44 43 43 42 41 40 39 39 38 37 36 35 35
48 47 46 45 44 44 43 42 41 40 40 39 38 37 36 36
50 48 47 46 45 45 44 43 42 41 41 40 40 39 39 38
52 49 48 47 46 46 45 44 44 43 43 42 41 40 40 39
54 50 49 48 47 47 46 45 45 44 44 43 42 41 41 40
56 51 50 49 48 48 47 46 46 45 45 44 43 42 42 41
58 52 51 50 49 49 48 47 47 46 46 45 45 44 44 43
60 53 52 51 50 50 49 48 47 46 46 45 45 44 44 43
62 54 53 52 51 51 50 49 48 47 47 46 46 45 45 44
64 55 54 53 52 52 51 50 49 48 48 47 47 46 46 45
66 55 54 53 52 52 51 51 50 49 49 48 48 47 47 46
68 56 55 54 53 53 52 52 51 50 50 49 48 47 47 46
70 57 56 55 54 54 53 52 51 50 50 49 49 48 48 47
72 57 56 55 54 54 53 53 52 51 51 50 50 49 49 48
74 58 57 56 55 55 54 54 53 52 52 51 50 49 49 48
76 59 58 57 56 56 55 54 53 52 52 51 51 50 50 49
78 59 58 57 56 56 55 55 54 53 53 52 52 51 51 50
80 60 59 58 57 57 56 55 54 53 53 52 52 51 51 50
Dry Bulb Reading. Difference between the Readings of the Dry and Wet Bulb Thermometers.
° ° ° ° ° ° ° ° ° ° ° ° ° ° °
12.2 12.4 12.6 12.8 13.0 13.2 13.4 13.6 13.8 14.0 14.2 14.4 14.6 14.8 15.0
°
20 .. .. .. .. .. .. .. .. .. .. .. .. .. .. ..
22 .. .. .. .. .. .. .. .. .. .. .. .. .. .. ..
24 .. .. .. .. .. .. .. .. .. .. .. .. .. .. ..
26 .. .. .. .. .. .. .. .. .. .. .. .. .. .. ..
28 5 5 5 5 4 .. .. .. .. .. .. .. .. .. ..
30 10 9 9 9 8 8 7 7 7 6 6 6 6 5 5
32 16 15 15 15 14 14 13 13 13 12 12 11 11 11 10
34 23 22 21 21 20 20 19 18 18 17 17 16 16 15 15
36 27 26 25 25 24 24 23 23 23 22 22 21 21 20 20
38 29 28 27 27 26 26 25 25 24 24 23 23 22 22 21
40 31 30 29 29 28 28 27 27 26 25 25 25 24 24 23
42 31 31 30 30 29 29 28 28 27 26 26 26 25 25 24
44 33 33 32 32 31 31 30 30 29 28 28 27 26 26 25
46 34 34 33 33 32 32 31 31 30 29 29 28 27 27 26
48 35 35 34 34 33 33 32 32 31 30 30 29 29 29 28
50 37 36 35 35 34 34 33 33 32 32 31 31 30 30 29
52 38 38 37 37 36 36 35 35 34 33 32 32 31 31 30
54 39 39 38 38 37 37 36 36 35 34 33 33 32 32 31
56 40 40 39 39 38 37 36 36 35 35 34 34 33 33 33
58 42 41 40 40 39 39 38 38 37 36 35 35 34 34 34
60 42 42 41 41 40 39 38 38 37 37 36 36 35 35 35
62 43 43 42 42 41 40 39 39 38 38 37 37 36 36 35
64 44 44 43 43 42 41 40 40 39 39 38 38 37 37 36
66 45 45 44 44 43 42 41 41 40 40 39 39 38 38 37
68 45 45 44 44 43 42 41 41 40 40 39 39 38 38 38
70 46 46 45 45 44 43 42 42 41 41 40 40 39 39 38
72 47 47 46 46 45 44 43 43 42 42 41 41 40 40 39
74 47 47 46 46 45 45 44 44 43 43 42 42 41 41 40
76 48 48 47 47 46 46 45 45 44 43 43 43 42 42 41
78 49 49 48 48 47 47 46 46 45 44 43 43 42 42 41
80 49 49 48 48 47 47 46 46 45 45 44 44 43 43 42
Dry Bulb Reading. Difference between the Readings of the Dry and Wet Bulb Thermometers.
° ° ° ° ° ° ° ° ° ° ° ° ° ° °
15.2 15.4 15.6 15.8 16.0 16.2 16.4 16.6 16.8 17.0 17.2 17.4 17.6 17.8 18.0
°
20 .. .. .. .. .. .. .. .. .. .. .. .. .. .. ..
22 .. .. .. .. .. .. .. .. .. .. .. .. .. .. ..
24 .. .. .. .. .. .. .. .. .. .. .. .. .. .. ..
26 .. .. .. .. .. .. .. .. .. .. .. .. .. .. ..
28 .. .. .. .. .. .. .. .. .. .. .. .. .. .. ..
30 5 5 5 4 4 .. .. .. .. .. .. .. .. .. ..
32 10 10 10 9 9 9 8 8 8 7 7 7 7 6 6
34 15 14 14 14 13 13 13 12 12 12 11 11 11 10 10
36 19 19 18 18 17 17 16 16 15 15 14 14 14 13 13
38 21 20 20 20 19 19 18 18 17 17 16 16 16 15 15
40 23 22 22 22 21 21 20 20 19 19 18 18 18 17 17
42 24 23 23 23 22 22 21 21 20 20 19 19 19 18 18
44 25 24 24 24 23 23 22 22 21 21 20 20 20 19 19
46 26 25 25 25 24 24 23 23 22 21 21 21 21 20 20
48 27 27 26 26 25 24 23 23 22 22 22 21 21 20 20
50 28 28 27 27 26 26 25 25 24 24 23 22 22 21 21
52 29 29 28 28 27 27 26 26 25 25 24 24 24 23 23
54 30 30 29 29 28 28 27 27 26 26 25 25 25 24 24
56 32 32 31 31 30 29 29 28 28 27 27 26 26 25 25
58 33 33 32 32 31 31 30 30 29 29 28 28 28 27 27
60 34 34 33 33 32 32 31 31 30 30 29 29 28 28 27
62 35 34 34 33 33 33 32 32 31 31 30 30 29 29 28
64 36 35 35 34 34 33 32 32 31 31 30 30 29 29 29
66 36 36 35 35 34 34 33 33 32 32 32 31 31 30 30
68 37 37 36 36 35 35 34 34 33 33 33 32 32 31 31
70 38 37 37 36 36 35 35 35 34 34 33 33 32 32 31
72 39 38 38 37 37 36 36 35 35 34 34 34 33 33 32
74 40 39 39 38 38 37 37 36 36 35 35 35 34 34 33
76 40 40 39 39 38 38 37 37 37 36 36 36 35 35 34
78 41 40 40 39 39 39 38 38 37 37 36 36 35 35 34
80 41 41 40 40 39 39 38 38 37 37 36 36 35 35 35
Table showing the Pressure of Saturated Aqueous Vapour in inches of Mercury at Latitude 45° for each degree Fahrenheit from -30° to 119°.
° Inch. ° Inch. ° Inch. ° Inch. ° Inches.
-30 0.0099 0 0.0440 30 0.1665 60 0.5192 90 1.4128
-29 0.0105 1 0.0461 31 0.1738 61 0.5379 91 1.4578
-28 0.0111 2 0.0482 32 0.1815 62 0.5572 92 1.5040
-27 0.0117 3 0.0504 33 0.1888 63 0.5771 93 1.5514
-26 0.0123 4 0.0527 34 0.1964 64 0.5976 94 1.6001
-25 0.0130 5 0.0551 35 0.2043 65 0.6187 95 1.6502
-24 0.0137 6 0.0577 36 0.2125 66 0.6405 96 1.7017
-23 0.0144 7 0.0604 37 0.2210 67 0.6630 97 1.7546
-22 0.0152 8 0.0632 38 0.2297 68 0.6862 98 1.8088
-21 0.0160 9 0.0661 39 0.2388 69 0.7101 99 1.8646
-20 0.0168 10 0.0691 40 0.2482 70 0.7347 100 1.922
-19 0.0177 11 0.0723 41 0.2579 71 0.7601 101 1.980
-18 0.0186 12 0.0756 42 0.2679 72 0.7862 102 2.041
-17 0.0196 13 0.0790 43 0.2783 73 0.8131 103 2.103
-16 0.0206 14 0.0825 44 0.2890 74 0.8409 104 2.166
-15 0.0217 15 0.0862 45 0.3001 75 0.8695 105 2.231
-14 0.0228 16 0.0901 46 0.3116 76 0.8989 106 2.298
-13 0.0239 17 0.0942 47 0.3235 77 0.9292 107 2.366
-12 0.0251 18 0.0985 48 0.3358 78 0.9604 108 2.437
-11 0.0263 19 0.1030 49 0.3485 79 0.9925 109 2.509
-10 0.0276 20 0.1076 50 0.3616 80 1.0255 110 2.583
- 9 0.0289 21 0.1124 51 0.3751 81 1.0595 111 2.659
- 8 0.0303 22 0.1174 52 0.3891 82 1.0945 112 2.736
- 7 0.0318 23 0.1226 53 0.4036 83 1.1305 113 2.817
- 6 0.0333 24 0.1282 54 0.4186 84 1.1675 114 2.898
- 5 0.0349 25 0.1339 55 0.4341 85 1.2056 115 2.982
- 4 0.0366 26 0.1399 56 0.4501 86 1.2447 116 3.067
- 3 0.0383 27 0.1461 57 0.4666 87 1.2850 117 3.156
- 2 0.0401 28 0.1526 58 0.4836 88 1.3264 118 3.246
- 1 0.0420 29 0.1594 59 0.5011 89 1.3690 119 3.338
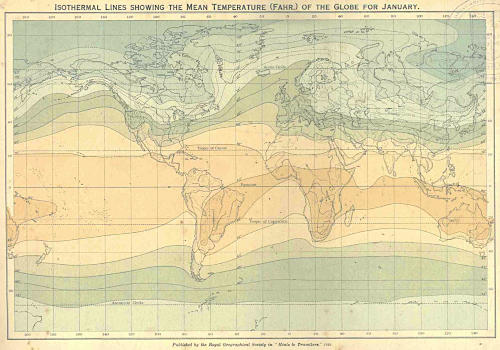
ISOTHERMAL LINES SHOWING THE MEAN TEMPERATURE (FAHR.) OF THE GLOBE FOR JANUARY.
Published by the Royal Geographical Society in “Hints to Travellers.” 1921.
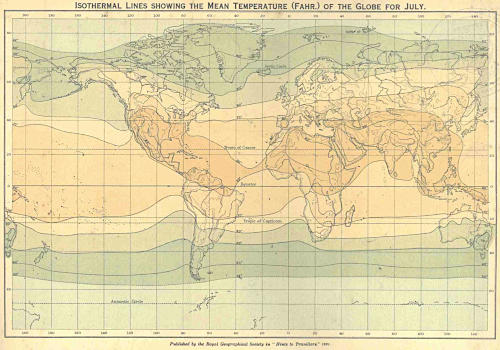
ISOTHERMAL LINES SHOWING THE MEAN TEMPERATURE (FAHR.) OF THE GLOBE FOR JULY.
Published by the Royal Geographical Society in “Hints to Travellers.” 1921.
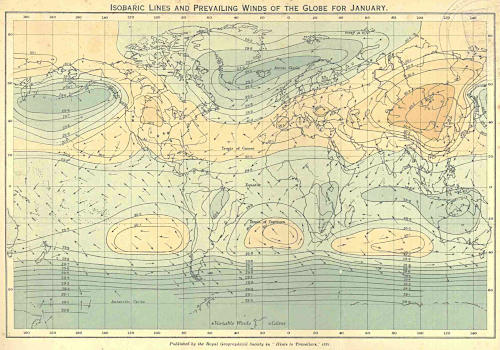
ISOBARIC LINES AND PREVAILING WINDS OF THE GLOBE FOR JANUARY.
Published by the Royal Geographical Society in “Hints to Travellers.” 1921.
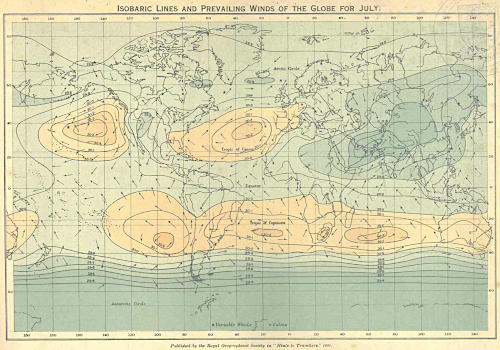
ISOBARIC LINES AND PREVAILING WINDS OF THE GLOBE FOR JULY.
Published by the Royal Geographical Society in “Hints to Travellers.” 1921.
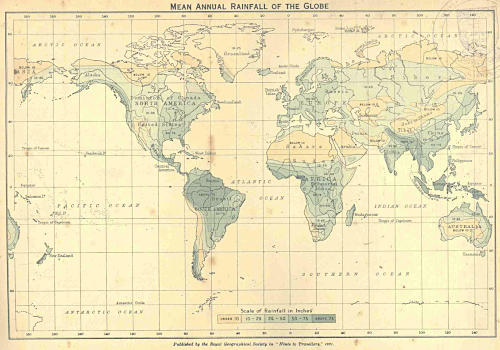
MEAN ANNUAL RAINFALL OF THE GLOBE.
Published by the Royal Geographical Society in “Hints to Travellers.” 1921.