Samuel MacClintock, Ph. D. (continued 8)
Reading edition
1905 13,085,333
Tennessee 1900 92,749,129
1905 137,960,476
Texas 1900 92,894,433
1905 150,528,389
Utah 1900 17,981,648
1905 38,926,464
Vermont 1900 51,515,228
1905 63,083,611
Virginia 1900 108,644,150
1905 148,856,525
Washington 1900 70,831,345
1905 128,821,667
West Virginia 1900 67,006,822
1905 99,040,676
Wisconsin 1900 326,752,878
1905 411,139,681
Wyoming 1900 3,268,555
1905 3,523,260
Chief Manufacturing Industries of the United States, Showing Sums Paid in Wages, Number of Employes, Capital Invested and Value of Product, 1880 to 1905.
[From reports of the Bureau of the Census, Department of Commerce and Labor.]
Industry. Census year. Number of estab- lish- ments. Capital. Wage-earners. Value of products, including custom work and repairing.
Average number Total wages.
Dollars. Dollars. Dollars.
Agricultural 1880 1,943 62,109,668 39,580 15,359,610 68,640,486
implements 1890 910 145,313,997 38,827 18,107,094 81,271,651
1900 715 157,707,951 46,582 22,450,880 101,207,428
1905 648 196,740,700 47,394 25,002,650 112,007,344
Boots and shoes 1880 1,959 42,994,028 111,152 43,001,438 166,050,354
1890 2,082 95,282,311 133,690 60,667,145 220,649,358
1900 1,599 99,819,233 141,830 58,440,883 258,969,580
1905 1,316 122,526,093 149,924 69,059,680 320,107,458
Bread and other 1880 6,396 19,155,286 22,488 9,411,328 65,824,806
bakery products 1890 10,484 45,758,489 38,841 19,120,529 128,421,535
1900 14,836 80,901,926 60,192 27,864,024 175,368,682
1905 18,227 122,363,327 81,284 43,179,822 269,609,061
Carriages and 1880 3,841 37,973,493 45,394 18,988,615 64,951,617
wagons 1890 4,572 93,455,257 56,525 28,972,401 102,680,341
1900 6,204 109,875,885 58,425 27,578,046 113,234,590
1905 4,956 126,320,604 60,722 30,878,229 125,332,976
Cars, shop construction 1890 716 76,192,477 106,632 60,213,433 129,461,698
and repairs by 1900 1,293 119,580,273 173,652 96,062,329 218,238,277
steam railroad companies 1905 1,141 146,943,729 236,900 142,188,336 309,863,499
Cars, shop construction 1890 78 2,351,162 2,009 1,411,205 2,966,347
and repairs by steam 1900 108 10,781,939 7,025 4,404,593 9,370,811
street railway companies 1905 86 12,905,853 11,052 7,012,798 13,437,121
Cars, steam and 1880 130 9,272,680 14,232 6,507,753 27,997,591
street railroad, not 1890 88 46,109,625 33,139 17,168,099 73,385,852
including operations 1900 85 95,939,249 37,038 18,938,170 97,815,648
of railway companies 1905 87 101,154,750 38,788 23,087,400 122,019,506
Cheese, butter and 1880 3,932 9,604,803 7,903 1,548,495 25,742,510
condensed milk 1890 4,552 16,016,573 12,219 4,248,854 60,635,705
1900 9,242 36,303,164 12,799 6,145,561 130,783,349
1905 8,926 47,255,556 15,557 8,412,937 168,182,789
Chemicals 1880 595 28,983,458 9,724 4,222,663 38,640,458
1890 563 55,032,452 15,038 7,308,411 59,352,548
1900 433 89,069,450 19,020 9,393,236 62,637,008
1905 448 119,890,193 24,525 13,361,972 92,088,378
Clothing, men’s 1880 6,166 79,861,696 160,813 45,940,353 209,548,460
1890 4,867 128,253,547 144,926 51,075,837 251,019,609
1900 5,729 120,547,851 120,927 45,496,728 276,717,357
1905 4,504 153,177,500 137,190 57,225,506 355,796,571
Clothing, women’s 1880 562 8,207,273 25,192 6,661,005 32,004,794
1890 1,224 21,259,528 39,149 15,428,272 68,164,019
1900 2,701 48,431,544 83,739 32,586,101 159,339,539
1905 3,351 73,947,823 115,705 51,180,193 247,661,560
Confectionery 1880 1,450 8,486,874 9,801 3,242,852 25,637,033
1890 2,921 23,326,799 21,724 7,783,007 55,997,101
1900 962 26,319,195 26,866 8,020,453 60,643,946
1905 1,348 43,125,408 36,239 11,699,257 87,087,253
Cooperage 1880 3,898 12,178,726 25,973 8,992,603 33,714,770
1890 2,652 17,806,554 22,555 10,056,249 38,617,956
1900 1,694 21,777,636 22,117 8,786,428 38,439,745
1905 1,517 29,532,614 21,149 9,485,455 49,424,394
Cordage and twine 1880 165 7,140,475 5,435 1,558,676 12,492,171
1890 150 23,351,883 12,385 3,976,232 38,812,559
1900 105 29,275,470 13,114 4,113,112 37,849,651
1905 102 37,110,521 14,614 5,338,178 48,017,139
Cotton goods 1880 1,005 219,504,794 185,472 45,614,419 210,950,383
1890 905 354,020,843 218,876 66,024,538 267,981,724
1900 1,055 467,240,157 302,861 86,689,752 339,200,820
1905 1,154 613,110,655 315,874 96,205,796 450,467,704
Electrical 1880 76 1,509,758 1,271 683,164 2,655,036
machinery, 1890 189 18,997,337 8,802 4,517,050 19,114,714
apparatus 1900 581 83,659,924 42,013 20,579,194 92,434,435
and supplies 1905 784 174,066,026 60,466 31,841,521 140,809,369
Flour and gristmill 1880 24,338 177,361,878 58,407 17,422,316 505,185,712
products 1890 18,470 208,473,500 47,403 18,138,402 513,971,474
1900 9,476 189,281,330 32,226 16,285,163 501,896,304
1905 10,051 265,117,434 39,110 19,822,196 713,033,395
Foundry and 1880 4,984 155,021,734 145,650 66,093,920 215,442,011
machine shop 1890 6,500 383,257,473 231,331 129,282,263 413,197,118
products 1900 9,316 663,414,323 350,103 182,096,007 644,456,216
1905 9,428 936,416,978 402,914 229,869,297 799,862,588
Furnishing goods, 1880 161 3,724,664 11,174 2,644,155 11,506,357
men’s 1890 586 12,299,011 20,773 6,078,036 29,870,946
1900 457 20,575,961 30,322 9,730,066 44,346,482
1905 547 28,043,584 27,185 8,760,108 49,031,582
Furniture 1880 5,227 44,946,128 59,304 23,695,080 77,845,725
1890 1,919 80,780,939 72,869 35,068,979 111,743,080
1900 1,814 104,484,394 87,262 35,632,523 125,315,986
1905 2,482 152,712,732 110,133 49,883,235 170,446,825
Glass 1880 169 18,804,599 24,177 9,144,100 21,154,571
1890 294 40,966,850 44,892 20,885,961 41,051,004
1900 355 61,423,903 52,818 27,084,710 56,539,712
1905 399 89,389,151 63,969 37,288,148 79,607,998
Hardware 1880 492 15,363,551 16,801 6,846,913 22,653,693
1890 350 26,271,840 18,495 8,656,067 26,726,463
1900 381 39,311,745 26,463 11,422,758 35,846,656
1905 445 52,884,078 31,713 14,580,589 45,770,171
Jewelry 1880 739 11,431,164 12,697 6,441,688 22,201,621
1890 783 22,246,508 13,880 8,038,327 34,761,458
1900 851 27,871,924 20,468 10,643,887 46,128,659
1905 1,023 39,678,956 22,080 12,592,846 53,225,681
Leather, tanned, 1880 5,628 73,383,911 40,282 16,503,828 200,264,944
curried, 1890 1,787 98,088,698 42,392 21,249,989 172,136,092
and finished 1900 1,306 173,977,421 52,109 22,591,091 204,038,127
1905 1,049 242,584,254 57,239 27,049,152 252,620,986
Liquors, malt 1880 2,191 91,208,224 26,220 12,198,053 101,058,385
1890 1,248 232,471,290 30,257 20,713,383 182,731,622
1900 1,507 413,767,233 39,459 25,776,468 236,914,914
1905 1,531 515,636,792 48,139 34,542,897 298,358,732
Lumber and 1880 25,758 181,465,392 148,290 31,893,098 233,608,886
timber products 1890 22,617 557,881,054 311,964 87,934,284 437,957,382
1900 23,053 400,857,337 413,335 148,007,845 555,197,271
1905 19,127 517,224,128 404,626 183,021,519 580,022,690
Lumber, planing- 1880 2,491 38,070,593 37,187 14,431,654 73,424,681
mill products, 1890 3,670 120,271,440 79,923 42,221,856 183,681,552
including sash, doors, 1900 4,198 118,948,556 73,510 32,621,704 167,786,122
and blinds 1905 5,009 177,145,734 97,674 50,713,607 247,441,956
Marble and 1880 2,846 16,498,221 21,471 10,238,885 31,415,150
stone work 1890 1,321 24,041,961 21,950 15,314,598 41,924,264
1900 1,655 39,559,146 30,641 16,328,174 42,230,457
1905 1,642 66,526,724 40,905 25,032,725 63,059,842
Paper and wood 1880 742 48,139,652 25,631 8,970,133 57,366,860
pulp 1890 649 89,829,548 31,050 13,204,828 78,937,184
1900 763 167,507,713 49,646 20,746,426 127,326,162
1905 761 277,444,471 65,964 32,019,212 188,715,189
Petroleum, refining 1890 94 77,416,296 11,403 5,872,467 85,001,198
1900 67 95,327,892 12,199 6,717,087 123,929,384
1905 98 136,280,541 16,770 9,989,367 175,005,320
Silk and silk goods 1880 382 19,125,300 31,337 9,146,705 41,033,045
1890 472 51,007,537 49,382 17,762,441 87,298,454
1900 483 81,082,201 65,416 20,982,194 107,256,258
1905 624 109,556,621 79,601 26,767,943 133,288,072
Slaughtering and 1880 872 49,419,213 27,297 10,508,530 303,562,413
meat packing, 1890 611 98,190,766 37,502 20,304,029 433,252,315
wholesale 1900 557 173,866,377 64,681 31,033,850 697,056,065
1905 559 219,818,627 69,593 37,090,399 801,757,137
Slaughtering, wholesale, 1890 507 18,696,738 6,473 4,000,947 128,359,353
not including 1900 325 14,933,804 3,705 2,358,403 86,723,126
meat packing 1905 370 17,896,063 4,541 3,236,573 112,157,487
Smelting and 1900 47 53,063,395 11,324 8,529,021 165,131,670
refining, copper 1905 40 76,824,640 12,752 10,827,043 240,780,216
Smelting and 1900 39 72,148,933 8,319 5,088,684 175,466,304
refining, lead 1905 32 63,822,810 7,573 5,374,691 185,826,839
Structural 1880 220 1,400,197 1,934 844,614 3,410,086
ironwork 1890 724 21,968,172 17,158 10,235,701 37,745,294
1900 697 43,442,877 24,903 13,588,779 66,927,305
1905 775 76,598,507 34,276 19,760,210 90,944,697
Sugar and 1880 49 27,432,500 5,857 2,875,032 155,484,915
molasses, 1890 393 24,013,008 7,043 2,385,654 123,118,259
refining 1900 657 184,033,304 14,129 6,917,829 239,711,011
1905 344 165,468,320 13,549 7,575,650 277,285,449
Tinware, copper- 1880 7,693 23,167,392 27,116 11,243,276 50,183,811
smithing, and 1890 7,002 38,434,900 31,377 15,610,265 66,653,746
sheet iron 1900 1,846 35,724,739 28,315 13,193,307 63,812,787
working 1905 2,366 124,500,133 39,475 20,608,179 97,974,838
Tobacco, chewing 1880 477 17,207,401 32,756 6,419,024 52,793,056
and smoking, 1890 395 30,841,316 29,790 6,947,158 65,843,587
and snuff 1900 437 43,856,570 29,161 7,109,821 103,754,362
1905 433 178,847,556 23,990 6,775,325 116,767,630
Tobacco, cigars 1880 7,145 21,698,549 63,297 18,464,562 63,979,575
and cigarettes 1890 10,956 59,517,827 87,000 36,475,060 129,693,275
1900 14,522 67,660,748 103,365 40,865,510 159,958,811
1905 16,395 145,135,945 135,418 55,864,978 214,350,051
Woolen goods 1880 1,990 96,095,564 86,504 25,836,392 160,606,721
1890 1,811 130,989,940 76,915 26,139,194 133,577,977
1900 1,035 124,386,262 68,893 24,757,006 118,430,158
1905 792 140,302,488 72,747 28,827,556 142,196,658
Worsted goods 1880 76 20,374,043 18,803 5,683,027 33,549,942
1890 143 68,085,116 42,978 14,944,966 79,194,652
1900 186 132,168,110 57,008 20,092,738 120,314,344
1905 226 162,464,929 69,251 26,269,787 165,745,052
Industry. Census year. Number of establish- ments. Capital.
Dollars.
Agricultural implements 1880 1,943 62,109,668
1890 910 145,313,997
1900 715 157,707,951
1905 648 196,740,700
Boots and shoes 1880 1,959 42,994,028
1890 2,082 95,282,311
1900 1,599 99,819,233
1905 1,316 122,526,093
Bread and other bakery products 1880 6,396 19,155,286
1890 10,484 45,758,489
1900 14,836 80,901,926
1905 18,227 122,363,327
Carriages and wagons 1880 3,841 37,973,493
1890 4,572 93,455,257
1900 6,204 109,875,885
1905 4,956 126,320,604
Cars, shop construction and repairs 1890 716 76,192,477
by steam railroad companies 1900 1,293 119,580,273
1905 1,141 146,943,729
Cars, shop construction and repairs 1890 78 2,351,162
by street railway companies 1900 108 10,781,939
1905 86 12,905,853
Cars, steam and street railroad, not 1880 130 9,272,680
including operations of railway 1890 88 46,109,625
companies 1900 85 95,939,249
1905 87 101,154,750
Cheese, butter and condensed milk 1880 3,932 9,604,803
1890 4,552 16,016,573
1900 9,242 36,303,164
1905 8,926 47,255,556
Chemicals 1880 595 28,983,458
1890 563 55,032,452
1900 433 89,069,450
1905 448 119,890,193
Clothing, men’s 1880 6,166 79,861,696
1890 4,867 128,253,547
1900 5,729 120,547,851
1905 4,504 153,177,500
Clothing, women’s 1880 562 8,207,273
1890 1,224 21,259,528
1900 2,701 48,431,544
1905 3,351 73,947,823
Confectionery 1880 1,450 8,486,874
1890 2,921 23,326,799
1900 962 26,319,195
1905 1,348 43,125,408
Cooperage 1880 3,898 12,178,726
1890 2,652 17,806,554
1900 1,694 21,777,636
1905 1,517 29,532,614
Cordage and twine 1880 165 7,140,475
1890 150 23,351,883
1900 105 29,275,470
1905 102 37,110,521
Cotton goods 1880 1,005 219,504,794
1890 905 354,020,843
1900 1,055 467,240,157
1905 1,154 613,110,655
Electrical machinery, apparatus 1880 76 1,509,758
and supplies 1890 189 18,997,337
1900 581 83,659,924
1905 784 174,066,026
Flour and gristmill products 1880 24,338 177,361,878
1890 18,470 208,473,500
1900 9,476 189,281,330
1905 10,051 265,117,434
Foundry and machine shop products 1880 4,984 155,021,734
1890 6,500 383,257,473
1900 9,316 663,414,323
1905 9,428 936,416,978
Furnishing goods, men’s 1880 161 3,724,664
1890 586 12,299,011
1900 457 20,575,961
1905 547 28,043,584
Furniture 1880 5,227 44,946,128
1890 1,919 80,780,939
1900 1,814 104,484,394
1905 2,482 152,712,732
Glass 1880 169 18,804,599
1890 294 40,966,850
1900 355 61,423,903
1905 399 89,389,151
Hardware 1880 492 15,363,551
1890 350 26,271,840
1900 381 39,311,745
1905 445 52,884,078
Jewelry 1880 739 11,431,164
1890 783 22,246,508
1900 851 27,871,924
1905 1,023 39,678,956
Leather, tanned, curried, 1880 5,628 73,383,911
and finished 1890 1,787 98,088,698
1900 1,306 173,977,421
1905 1,049 242,584,254
Liquors, malt 1880 2,191 91,208,224
1890 1,248 232,471,290
1900 1,507 413,767,233
1905 1,531 515,636,792
Lumber and timber products 1880 25,758 181,465,392
1890 22,617 557,881,054
1900 23,053 400,857,337
1905 19,127 517,224,128
Lumber, planing-mill products, 1880 2,491 38,070,593
including sash, doors, and blinds 1890 3,670 120,271,440
1900 4,198 118,948,556
1905 5,009 177,145,734
Marble and stone work 1880 2,846 16,498,221
1890 1,321 24,041,961
1900 1,655 39,559,146
1905 1,642 66,526,724
Paper and wood pulp 1880 742 48,139,652
1890 649 89,829,548
1900 763 167,507,713
1905 761 277,444,471
Petroleum, refining 1890 94 77,416,296
1900 67 95,327,892
1905 98 136,280,541
Silk and silk goods 1880 382 19,125,300
1890 472 51,007,537
1900 483 81,082,201
1905 624 109,556,621
Slaughtering and meat packing, 1880 872 49,419,213
wholesale 1890 611 98,190,766
1900 557 173,866,377
1905 559 219,818,627
Slaughtering, wholesale, not 1890 507 18,696,738
including meat packing 1900 325 14,933,804
1905 370 17,896,063
Smelting and refining, copper 1900 47 53,063,395
1905 40 76,824,640
Smelting and refining, lead 1900 39 72,148,933
1905 32 63,822,810
Structural ironwork 1880 220 1,400,197
1890 724 21,968,172
1900 697 43,442,877
1905 775 76,598,507
Sugar and molasses, refining 1880 49 27,432,500
1890 393 24,013,008
1900 657 184,033,304
1905 344 165,468,320
Tinware, copper-smithing, 1880 7,693 23,167,392
and sheet iron working 1890 7,002 38,434,900
1900 1,846 35,724,739
1905 2,366 124,500,133
Tobacco, chewing and smoking, 1880 477 17,207,401
and snuff 1890 395 30,841,316
1900 437 43,856,570
1905 433 178,847,556
Tobacco, cigars and cigarettes 1880 7,145 21,698,549
1890 10,956 59,517,827
1900 14,522 67,660,748
1905 16,395 145,135,945
Woolen goods 1880 1,990 96,095,564
1890 1,811 130,989,940
1900 1,035 124,386,262
1905 792 140,302,488
Worsted goods 1880 76 20,374,043
1890 143 68,085,116
1900 186 132,168,110
1905 226 162,464,929
Industry. Census year. Wage-earners.
Average number. Total wages.
Dollars.
Agricultural implements 1880 39,580 15,359,610
1890 38,827 18,107,094
1900 46,582 22,450,880
1905 47,394 25,002,650
Boots and shoes 1880 111,152 43,001,438
1890 133,690 60,667,145
1900 141,830 58,440,883
1905 149,924 69,059,680
Bread and other 1880 22,488 9,411,328
bakery products 1890 38,841 19,120,529
1900 60,192 27,864,024
1905 81,284 43,179,822
Carriages and wagons 1880 45,394 18,988,615
1890 56,525 28,972,401
1900 58,425 27,578,046
1905 60,722 30,878,229
Cars, shop construction 1890 106,632 60,213,433
and repairs by steam 1900 173,652 96,062,329
railroad companies 1905 236,900 142,188,336
Cars, shop construction 1890 2,009 1,411,205
and repairs by street 1900 7,025 4,404,593
railway companies 1905 11,052 7,012,798
Cars, steam and street 1880 14,232 6,507,753
railroad, not including 1890 33,139 17,168,099
operations of 1900 37,038 18,938,170
railway companies 1905 38,788 23,087,400
Cheese, butter 1880 7,903 1,548,495
and condensed milk 1890 12,219 4,248,854
1900 12,799 6,145,561
1905 15,557 8,412,937
Chemicals 1880 9,724 4,222,663
1890 15,038 7,308,411
1900 19,020 9,393,236
1905 24,525 13,361,972
Clothing, men’s 1880 160,813 45,940,353
1890 144,926 51,075,837
1900 120,927 45,496,728
1905 137,190 57,225,506
Clothing, women’s 1880 25,192 6,661,005
1890 39,149 15,428,272
1900 83,739 32,586,101
1905 115,705 51,180,193
Confectionery 1880 9,801 3,242,852
1890 21,724 7,783,007
1900 26,866 8,020,453
1905 36,239 11,699,257
Cooperage 1880 25,973 8,992,603
1890 22,555 10,056,249
1900 22,117 8,786,428
1905 21,149 9,485,455
Cordage and twine 1880 5,435 1,558,676
1890 12,385 3,976,232
1900 13,114 4,113,112
1905 14,614 5,338,178
Cotton goods 1880 185,472 45,614,419
1890 218,876 66,024,538
1900 302,861 86,689,752
1905 315,874 96,205,796
Electrical machinery, 1880 1,271 683,164
apparatus and supplies 1890 8,802 4,517,050
1900 42,013 20,579,194
1905 60,466 31,841,521
Flour and gristmill 1880 58,407 17,422,316
products 1890 47,403 18,138,402
1900 32,226 16,285,163
1905 39,110 19,822,196
Foundry and machine 1880 145,650 66,093,920
shop products 1890 231,331 129,282,263
1900 350,103 182,096,007
1905 402,914 229,869,297
Furnishing goods, men’s 1880 11,174 2,644,155
1890 20,773 6,078,036
1900 30,322 9,730,066
1905 27,185 8,760,108
Furniture 1880 59,304 23,695,080
1890 72,869 35,068,979
1900 87,262 35,632,523
1905 110,133 49,883,235
Glass 1880 24,177 9,144,100
1890 44,892 20,885,961
1900 52,818 27,084,710
1905 63,969 37,288,148
Hardware 1880 16,801 6,846,913
1890 18,495 8,656,067
1900 26,463 11,422,758
1905 31,713 14,580,589
Jewelry 1880 12,697 6,441,688
1890 13,880 8,038,327
1900 20,468 10,643,887
1905 22,080 12,592,846
Leather, tanned, 1880 40,282 16,503,828
curried, and finished 1890 42,392 21,249,989
1900 52,109 22,591,091
1905 57,239 27,049,152
Liquors, malt 1880 26,220 12,198,053
1890 30,257 20,713,383
1900 39,459 25,776,468
1905 48,139 34,542,897
Lumber and 1880 148,290 31,893,098
timber products 1890 311,964 87,934,284
1900 413,335 148,007,845
1905 404,626 183,021,519
Lumber, planing- 1880 37,187 14,431,654
mill products, 1890 79,923 42,221,856
including sash, 1900 73,510 32,621,704
doors, and blinds 1905 97,674 50,713,607
Marble and stone work 1880 21,471 10,238,885
1890 21,950 15,314,598
1900 30,641 16,328,174
1905 40,905 25,032,725
Paper and wood pulp 1880 25,631 8,970,133
1890 31,050 13,204,828
1900 49,646 20,746,426
1905 65,964 32,019,212
Petroleum, refining 1890 11,403 5,872,467
1900 12,199 6,717,087
1905 16,770 9,989,367
Silk and silk goods 1880 31,337 9,146,705
1890 49,382 17,762,441
1900 65,416 20,982,194
1905 79,601 26,767,943
Slaughtering and 1880 27,297 10,508,530
meat packing, 1890 37,502 20,304,029
wholesale 1900 64,681 31,033,850
1905 69,593 37,090,399
Slaughtering, wholesale, 1890 6,473 4,000,947
not including 1900 3,705 2,358,403
meat packing 1905 4,541 3,236,573
Smelting and 1900 11,324 8,529,021
refining, copper 1905 12,752 10,827,043
Smelting and 1900 8,319 5,088,684
refining, lead 1905 7,573 5,374,691
Structural ironwork 1880 1,934 844,614
1890 17,158 10,235,701
1900 24,903 13,588,779
1905 34,276 19,760,210
Sugar and molasses, 1880 5,857 2,875,032
refining 1890 7,043 2,385,654
1900 14,129 6,917,829
1905 13,549 7,575,650
Tinware, 1880 27,116 11,243,276
copper-smithing, 1890 31,377 15,610,265
and sheet 1900 28,315 13,193,307
iron working 1905 39,475 20,608,179
Tobacco, chewing 1880 32,756 6,419,024
and smoking, 1890 29,790 6,947,158
and snuff 1900 29,161 7,109,821
1905 23,990 6,775,325
Tobacco, cigars 1880 63,297 18,464,562
and cigarettes 1890 87,000 36,475,060
1900 103,365 40,865,510
1905 135,418 55,864,978
Woolen goods 1880 86,504 25,836,392
1890 76,915 26,139,194
1900 68,893 24,757,006
1905 72,747 28,827,556
Worsted goods 1880 18,803 5,683,027
1890 42,978 14,944,966
1900 57,008 20,092,738
1905 69,251 26,269,787
Industry. Census year. Value of products, including custom work and repairing.
Dollars.
Agricultural implements 1880 68,640,486
1890 81,271,651
1900 101,207,428
1905 112,007,344
Boots and shoes 1880 166,050,354
1890 220,649,358
1900 258,969,580
1905 320,107,458
Bread and other 1880 65,824,806
bakery products 1890 128,421,535
1900 175,368,682
1905 269,609,061
Carriages and wagons 1880 64,951,617
1890 102,680,341
1900 113,234,590
1905 125,332,976
Cars, shop construction 1890 129,461,698
and repairs by steam 1900 218,238,277
railroad companies 1905 309,863,499
Cars, shop construction 1890 2,966,347
and repairs by street 1900 9,370,811
railway companies 1905 13,437,121
Cars, steam and street 1880 27,997,591
railroad, not including 1890 73,385,852
operations of 1900 97,815,648
railway companies 1905 122,019,506
Cheese, butter 1880 25,742,510
and condensed milk 1890 60,635,705
1900 130,783,349
1905 168,182,789
Chemicals 1880 38,640,458
1890 59,352,548
1900 62,637,008
1905 92,088,378
Clothing, men’s 1880 209,548,460
1890 251,019,609
1900 276,717,357
1905 355,796,571
Clothing, women’s 1880 32,004,794
1890 68,164,019
1900 159,339,539
1905 247,661,560
Confectionery 1880 25,637,033
1890 55,997,101
1900 60,643,946
1905 87,087,253
Cooperage 1880 33,714,770
1890 38,617,956
1900 38,439,745
1905 49,424,394
Cordage and twine 1880 12,492,171
1890 38,812,559
1900 37,849,651
1905 48,017,139
Cotton goods 1880 210,950,383
1890 267,981,724
1900 339,200,820
1905 450,467,704
Electrical machinery, 1880 2,655,036
apparatus and supplies 1890 19,114,714
1900 92,434,435
1905 140,809,369
Flour and gristmill 1880 505,185,712
products 1890 513,971,474
1900 501,896,304
1905 713,033,395
Foundry and machine 1880 215,442,011
shop products 1890 413,197,118
1900 644,456,216
1905 799,862,588
Furnishing goods, men’s 1880 11,506,357
1890 29,870,946
1900 44,346,482
1905 49,031,582
Furniture 1880 77,845,725
1890 111,743,080
1900 125,315,986
1905 170,446,825
Glass 1880 21,154,571
1890 41,051,004
1900 56,539,712
1905 79,607,998
Hardware 1880 22,653,693
1890 26,726,463
1900 35,846,656
1905 45,770,171
Jewelry 1880 22,201,621
1890 34,761,458
1900 46,128,659
1905 53,225,681
Leather, tanned, 1880 200,264,944
curried, and finished 1890 172,136,092
1900 204,038,127
1905 252,620,986
Liquors, malt 1880 101,058,385
1890 182,731,622
1900 236,914,914
1905 298,358,732
Lumber and 1880 233,608,886
timber products 1890 437,957,382
1900 555,197,271
1905 580,022,690
Lumber, planing- 1880 73,424,681
mill products, 1890 183,681,552
including sash, 1900 167,786,122
doors, and blinds 1905 247,441,956
Marble and stone work 1880 31,415,150
1890 41,924,264
1900 42,230,457
1905 63,059,842
Paper and wood pulp 1880 57,366,860
1890 78,937,184
1900 127,326,162
1905 188,715,189
Petroleum, refining 1890 85,001,198
1900 123,929,384
1905 175,005,320
Silk and silk goods 1880 41,033,045
1890 87,298,454
1900 107,256,258
1905 133,288,072
Slaughtering and 1880 303,562,413
meat packing, 1890 433,252,315
wholesale 1900 697,056,065
1905 801,757,137
Slaughtering, wholesale, 1890 128,359,353
not including 1900 86,723,126
meat packing 1905 112,157,487
Smelting and 1900 165,131,670
refining, copper 1905 240,780,216
Smelting and 1900 175,466,304
refining, lead 1905 185,826,839
Structural ironwork 1880 3,410,086
1890 37,745,294
1900 66,927,305
1905 90,944,697
Sugar and molasses, 1880 155,484,915
refining 1890 123,118,259
1900 239,711,011
1905 277,285,449
Tinware, 1880 50,183,811
copper-smithing, 1890 66,653,746
and sheet 1900 63,812,787
iron working 1905 97,974,838
Tobacco, chewing 1880 52,793,056
and smoking, 1890 65,843,587
and snuff 1900 103,754,362
1905 116,767,630
Tobacco, cigars 1880 63,979,575
and cigarettes 1890 129,693,275
1900 159,958,811
1905 214,350,051
Woolen goods 1880 160,606,721
1890 133,577,977
1900 118,430,158
1905 142,196,658
Worsted goods 1880 33,549,942
1890 79,194,652
1900 120,314,344
1905 165,745,052
The Textile Industries of the United States at Decennial Periods, 1850 to 1900.
[Compiled from Census Reports.]
Year. Number of establish-ments. Capital. Number of wage-earners. Wages. Cost of materials. Value of products.
Wool 1850 1,760 $ 32,516,366 47,763 … $29,246,696 $ 49,636,881
manufacture[Z] 1860 1,673 42,849,932 59,522 $13,361,602 46,649,365 80,734,606
1870 3,456 132,382,319 119,859 40,357,235 134,154,615 217,668,826
1880 2,689 159,091,869 161,557 47,389,087 164,371,551 267,252,913
1890 2,489 296,494,481 213,859 70,917,894 203,095,572 337,768,524
1900 2,335 392,040,353 242,495 82,292,444 232,230,986 392,473,050
1905 2,292 477,525,222 283,691 102,333,548 319,154,878 517,492,142
Cotton 1850 1,094 74,500,931 92,286 … 34,835,056 61,869,184
manufacture[AA] 1860 1,091 98,585,269 122,028 23,940,108 57,285,534 115,681,774
1870 956 140,706,291 135,369 39,044,132 111,736,936 177,489,789
1880 756 208,280,346 174,659 42,040,510 102,206,347 192,090,110
1890 905 354,020,842 218,876 66,024,538 154,912,979 267,981,724
1900 1,055 467,240,157 802,861 86,689,752 176,551,527 339,200,320
1905 1,154 613,110,655 315,874 96,205,796 286,255,303 450,467,704
Silk manufacture 1850 67 678,300 1,743 … 1,093,866 1,809,476
1860 139 2,926,980 5,435 1,050,224 3,901,777 6,607,771
1870 86 6,231,130 6,649 1,942,286 7,817,559 12,210,662
1880 382 19,125,300 31,337 9,146,705 22,467,701 41,033,045
1890 472 51,007,537 49,382 17,762,441 51,004,425 87,298,454
1900 483 81,082,201 65,416 20,982,194 62,406,665 107,256,258
1905 624 109,556,621 79,601 26,767,943 75,861,188 188,288,072
Dyeing and 1850 104 4,818,350 5,105 … 11,540,347 15,454,430
finishing textiles 1860 124 5,718,671 7,097 2,001,528 5,005,435 11,716,463
1870 292 18,374,503 13,066 5,221,538 99,539,992 113,017,537
1880 191 26,223,981 16,698 6,474,364 13,664,295 32,297,420
1890 248 38,450,800 19,601 8,911,720 12,385,220 28,900,460
1900 298 60,643,104 29,776 12,726,316 17,958,137 44,963,331
1905 360 88,708,576 35,563 15,469,205 19,621,253 50,849,545
Flax, hemp and jute 1890 162 27,731,649 15,519 4,872,389 26,148,344 37,313,021
1900 141 41,991,762 20,903 6,331,741 32,197,885 47,601,607
1905 133 54,423,531 24,508 8,580,785 44,890,546 62,939,329
Combined textiles 1850 3,025 112,513,947 146,877 … 76,715,959 128,769,971
1860 3,027 150,080,852 194,082 40,353,462 112,842,111 214,740,614
1870 4,790 297,694,243 274,943 86,565,191 353,249,102 520,386,764
1880 4,018 412,721,496 384,251 105,050,666 302,709,894 532,673,488
1890 4,276 767,705,310 517,237 168,488,982 447,546,540 759,262,283
1900 4,312 1,042,997,577 661,451 209,022,447 521,345,200 931,494,566
1905 4,563 1,343,324,605 739,239 249,357,277 745,783,168 1,215,036,792
Year. Number of establish -ments. Capital.
Wool 1850 1,760 $ 32,516,366
manu- 1860 1,673 42,849,932
facture[Z] 1870 3,456 132,382
1880 2,689 159,091
1890 2,489 296,494
1900 2,335 392,040
1905 2,292 477,525
Cotton 1850 1,094 74,500,931
manu- 1860 1,091 98,585,269
facture[AA] 1870 956 140,706
1880 756 208,280
1890 905 354,020
1900 1,055 467,240
1905 1,154 613,110
Silk manu- 1850 67 678,300
-facture 1860 139 2,926,980
1870 86 6,231,130
1880 382 19,125,300
1890 472 51,007,537
1900 483 81,082,201
1905 624 109,556
Dyeing and 1850 104 4,818,350
finishing 1860 124 5,718,671
textiles 1870 292 18,374,503
1880 191 26,223,981
1890 248 38,450,800
1900 298 60,643,104
1905 360 88,708,576
Flax, hemp 1890 162 27,731,649
and jute 1900 141 41,991,762
1905 133 54,423,531
Combined 1850 3,025 112,513
textiles 1860 3,027 150,080
1870 4,790 297,694
1880 4,018 412,721
1890 4,276 767,705
1900 4,312 1,042,997,577
1905 4,563 1,343,324,605
Year. Number of wage- earners. Wages.
Wool 1850 47,763 …
manu- 1860 59,522 $ 13,361,602
facture[Z] 1870 119,859 40,357
1880 161,557 47,389
1890 213,859 70,917
1900 242,495 82,292
1905 283,691 102,333,548
Cotton 1850 92,286 …
manu- 1860 122,028 23,940
facture[AA] 1870 135,369 39,044
1880 174,659 42,040
1890 218,876 66,024
1900 802,861 86,689
1905 315,874 96,205
Silk 1850 1,743 …
manufacture 1860 5,435 1,050
1870 6,649 1,942
1880 31,337 9,146
1890 49,382 17,762
1900 65,416 20,982
1905 79,601 26,767
Dyeing and 1850 5,105 …
finishing 1860 7,097 2,001
textiles 1870 13,066 5,221
1880 16,698 6,474
1890 19,601 8,911
1900 29,776 12,726
1905 35,563 15,469
Flax, hemp 1890 15,519 4,872
and jute 1900 20,903 6,331
1905 24,508 8,580
Combined 1850 146,877 …
textiles 1860 194,082 40,353
1870 274,943 86,565
1880 384,251 105,050,666
1890 517,237 168,488,982
1900 661,451 209,022,447
1905 739,239 249,357,277
Year. Cost of materials. Value of products.
Wool 1850 $29,246,696 $ 49,636,881
manu- 1860 46,649,365 80,734,606
facture[Z] 1870 134,154,615 217,668,826
1880 164,371,551 267,252,913
1890 203,095,572 337,768,524
1900 232,230,986 392,473,050
1905 319,154,878 517,492,142
Cotton 1850 34,835,056 61,869,184
manu- 1860 57,285,534 115,681,774
facture[AA] 1870 111,736,936 177,489,789
1880 102,206,347 192,090,110
1890 154,912,979 267,981,724
1900 176,551,527 339,200,320
1905 286,255,303 450,467,704
Silk 1850 1,093,866 1,809,476
manufacture 1860 3,901,777 6,607,771
1870 7,817,559 12,210,662
1880 22,467,701 41,033,045
1890 51,004,425 87,298,454
1900 62,406,665 107,256,258
1905 75,861,188 188,288,072
Dyeing and 1850 11,540,347 15,454,430
finishing 1860 5,005,435 11,716,463
textiles 1870 99,539,992 113,017,537
1880 13,664,295 32,297,420
1890 12,385,220 28,900,460
1900 17,958,137 44,963,331
1905 19,621,253 50,849,545
Flax, hemp 1890 26,148,344 37,313,021
and jute 1900 32,197,885 47,601,607
1905 44,890,546 62,939,329
Combined 1850 76,715,959 128,769,971
textiles 1860 112,842,111 214,740,614
1870 353,249,102 520,386,764
1880 302,709,894 532,673,488
1890 447,546,540 759,262,283
1900 521,345,200 931,494,566
1905 745,783,168 1,215,036,792
Cotton Manufactures in the United States, 1870 to 1905.
[From official reports of the United States Census Office.]
1870. 1880. 1890. 1900. 1905.
Number of establishments 956 756 905 973 1,077
Capital $140,706,291 $208,280,346 $354,020,843 $460,842,772 $605,100,164
Wage-earners, average number 135,369 174,659 218,876 297,929 310,458
Total wages $39,044,132 $42,040,510 $66,024,538 $85,126,310 $94,377,696
Cost of materials used $111,736,936 $102,206,347 $154,912,979 $178,441,390 $282,047,648
Value of products $177,489,739 $192,090,110 $267,981,724 $332,806,156 $442,451,218
Active spindles, number 7,132,415 10,653,435 14,188,103 19,008,352 23,155,613
Looms, number 157,310 225,759 324,866 450,682 640,910
Cotton consumed, bales … 1,570,344 2,261,600 3,639,495 3,743,089
Cotton consumed, pounds 398,308,257 759,343,981 1,117,945,776 1,814,002,512 1,873,074,716
1870. 1880.
Number of establishments 956 756
Capital $140,706,291 $208,280,346
Wage-earners, average number 135,369 174,659
Total wages $39,044,132 $42,040,510
Cost of materials used $111,736,936 $102,206,347
Value of products $177,489,739 $192,090,110
Active spindles, number 7,132,415 10,653,435
Looms, number 157,310 225,759
Cotton consumed, bales … 1,570,344
Cotton consumed, pounds 398,308,257 759,343,981
1890.
Number of establishments 905
Capital $354,020,843
Wage-earners, average number 218,876
Total wages $66,024,538
Cost of materials used $154,912,979
Value of products $267,981,724
Active spindles, number 14,188,103
Looms, number 324,866
Cotton consumed, bales 2,261,600
Cotton consumed, pounds 1,117,945,776
1900. 1905.
Number of establishments 973 1,077
Capital $460,842,772 $605,100,164
Wage-earners, average number 297,929 310,458
Total wages $85,126,310 $94,377,696
Cost of materials used $178,441,390 $282,047,648
Value of products $332,806,156 $442,451,218
Active spindles, number 19,008,352 23,155,613
Looms, number 450,682 640,910
Cotton consumed, bales 3,639,495 3,743,089
Cotton consumed, pounds 1,814,002,512 1,873,074,716
Silk Manufactures in the United States, 1870 to 1905.
[From official reports of the United States Census Office.]
1870. 1880. 1890. 1900. 1905.
Number of establishments 86 382 472 483 624
Capital $6,231,180 $19,125,300 $51,007,537 $81,082,201 $109,556,621
Wage-earners, average number 6,649 31,337 49,382 65,416 79,601
Total wages $1,942,286 $9,146,705 $17,762,441 $20,982,194 $26,767,943
Cost of materials used $7,817,559 $22,467,701 $51,004,425 $62,406,665 $75,861,188
Value of products $12,210,662 $41,033,045 $87,298,454 $107,256,258 $133,288,072
Raw silk used, pounds 684,488 2,690,482 6,376,881 9,760,770 11,572,783
1870. 1880.
Number of establishments 86 382
Capital $6,231,180 $19,125,300
Wage-earners, average number 6,649 31,337
Total wages $1,942,286 $9,146,705
Cost of materials used $7,817,559 $22,467,701
Value of products $12,210,662 $41,033,045
Raw silk used, pounds 684,488 2,690,482
1890.
Number of establishments 472
Capital $51,007,537
Wage-earners, average number 49,382
Total wages $17,762,441
Cost of materials used $51,004,425
Value of products $87,298,454
Raw silk used, pounds 6,376,881
1900. 1905.
Number of establishments 483 624
Capital $81,082,201 $109,556,621
Wage-earners, average number 65,416 79,601
Total wages $20,982,194 $26,767,943
Cost of materials used $62,406,665 $75,861,188
Value of products $107,256,258 $133,288,072
Raw silk used, pounds 9,760,770 11,572,783
Cotton Production and Manufacturing in the United States, also Imports and Exports of Cotton Manufactures.
[From the Statistical Abstract of the United States.]
Total commercial crop. Taken for home consumption. Raw cotton imported. Exports of manufactures of cotton. Imports of manufactures of cotton.
By Northern mills. By South-ern mills. Total.
In thousands of bales. Pounds. Dollars. Dollars.
1884 5,713 1,537 340 1,877 7,019,492 11,885,211 29,074,626
1885 5,706 1,437 316 1,753 5,115,680 11,836,591 27,197,241
1886 6,575 1,781 381 2,162 5,072,334 13,959,934 29,709,266
1887 6,499 1,687 401 2,088 3,924,531 14,929,342 28,940,353
1888 7,047 1,805 456 2,261 5,497,592 13,013,189 28,917,799
1889 6,939 1,790 480 2,270 7,973,039 10,212,644 26,805,942
1890 7,297 1,780 545 2,325 8,606,049 9,999,277 29,918,055
1891 8,674 2,027 613 2,640 20,908,817 13,604,857 29,712,624
1892 9,018 2,172 684 2,856 28,663,769 13,226,277 28,323,841
1893 6,664 1,652 723 2,375 43,367,952 11,809,355 33,560,293
1894 7,532 1,580 711 2,291 27,705,949 14,340,886 22,346,547
1895 9,837 2,019 852 2,871 49,332,022 13,789,810 33,196,625
1896 7,147 1,605 900 2,605 55,350,520 16,837,396 32,437,504
1897 8,706 1,793 999 2,792 51,898,926 21,037,678 34,429,363
1898 11,216 2,211 1,254 3,465 52,660,363 17,024,092 27,267,300
1899 11,256 2,217 1,415 3,632 50,158,158 23,566,914 32,054,434
1900 9,422 2,047 1,597 3,644 67,398,521 24,003,087 41,296,239
1901 10,839 1,964 1,583 3,647 46,631,283 20,272,418 40,246,935
1902 10,768 2,066 2,017 4,083 98,715,680 32,108,362 44,460,126
1903 10,674 1,966 1,958 3,924 74,874,426 32,216,304 52,462,755
1904 10,002 2,046 1,889 3,935 48,840,590 22,403,718 49,524,246
1905 13,654 2,292 2,270 4,562 60,508,548 49,668,080 48,919,986
1906 11,234 2,335 2,292 4,627 70,963,633 52,944,038 63,043,322
1907 13,540 2,510 2,495 5,005 104,791,784 32,305,412 73,704,636
Total commercial crop. Taken for home consumption.
By North- ern mills. By South -ern mills. Total.
In thousands of bales.
1884 5,713 1,537 340 1,877
1885 5,706 1,437 316 1,753
1886 6,575 1,781 381 2,162
1887 6,499 1,687 401 2,088
1888 7,047 1,805 456 2,261
1889 6,939 1,790 480 2,270
1890 7,297 1,780 545 2,325
1891 8,674 2,027 613 2,640
1892 9,018 2,172 684 2,856
1893 6,664 1,652 723 2,375
1894 7,532 1,580 711 2,291
1895 9,837 2,019 852 2,871
1896 7,147 1,605 900 2,605
1897 8,706 1,793 999 2,792
1898 11,216 2,211 1,254 3,465
1899 11,256 2,217 1,415 3,632
1900 9,422 2,047 1,597 3,644
1901 10,839 1,964 1,583 3,647
1902 10,768 2,066 2,017 4,083
1903 10,674 1,966 1,958 3,924
1904 10,002 2,046 1,889 3,935
1905 13,654 2,292 2,270 4,562
1906 11,234 2,335 2,292 4,627
1907 13,540 2,510 2,495 5,005
Raw cotton imported. Exports of manufactures of cotton. Imports of manufactures of cotton.
Pounds. Dollars. Dollars.
1884 7,019,492 11,885,211 29,074,626
1885 5,115,680 11,836,591 27,197,241
1886 5,072,334 13,959,934 29,709,266
1887 3,924,531 14,929,342 28,940,353
1888 5,497,592 13,013,189 28,917,799
1889 7,973,039 10,212,644 26,805,942
1890 8,606,049 9,999,277 29,918,055
1891 20,908,817 13,604,857 29,712,624
1892 28,663,769 13,226,277 28,323,841
1893 43,367,952 11,809,355 33,560,293
1894 27,705,949 14,340,886 22,346,547
1895 49,332,022 13,789,810 33,196,625
1896 55,350,520 16,837,396 32,437,504
1897 51,898,926 21,037,678 34,429,363
1898 52,660,363 17,024,092 27,267,300
1899 50,158,158 23,566,914 32,054,434
1900 67,398,521 24,003,087 41,296,239
1901 46,631,283 20,272,418 40,246,935
1902 98,715,680 32,108,362 44,460,126
1903 74,874,426 32,216,304 52,462,755
1904 48,840,590 22,403,718 49,524,246
1905 60,508,548 49,668,080 48,919,986
1906 70,963,633 52,944,038 63,043,322
1907 104,791,784 32,305,412 73,704,636
Iron and Steel Manufacturing in the U. S.: Comparative Summary, 1870 to 1905, with per cent of increase for each decade.[BB]
[From the United States Census.]
Date of census.
Number of establishments 808 792 719 669 606
Capital $121,722,704 $209,904,965 [DD]$414,044,844 $590,530,484 $948,689,840
Wage-earners, average number 77,555 140,798 171,181 222,607 242,740
Total wages $40,514,981 $55,451,510 $89,273,956 $120,836,338 $141,439,906
Men, 16 years and over 75,037 133,023 168,943 219,635 239,383
Women, 16 years and over 82 45 58 1,071 1,455
Children, under 16 years 2,436 7,730 2,180 1,901 1,902
Cost of materials used $135,526,132 $191,271,150 $327,272,845 $522,431,701 $620,171,881
Value of products $207,208,696 $296,557,685 $478,687,519 $804,034,918 $905,854,152
Tons of products (2,240 pounds each) 3,263,585 6,486,733 16,264,478 29,507,860 34,844,933
Per cent of increase.
1870 to 1880. 1880 to 1890. 1890 to 1900. 1900 to 1905.
Capital 72.4 97.3 42.6 60.7
Salaried officials, clerks, etc., number … … 113.1 79.7
Salaries … … 81.7 76.8
Wage-earners, average number 81.5 21.6 30.0 9.0
Total wages 36.9 61.0 35.4 17.1
Men, 16 years and over 77.3 27.0 30.0 9.0
Wages … … 35.3 17.0
Women, 16 years and over [DD]45.1 28.9 1,746.6 35.9
Wages … … 1,460.2 65.6
Wages … … [DD]0.9 9.7
Miscellaneous expenses … … 77.2 46.1
Cost of materials used 41.1 71.1 59.6 18.7
Value of products 43.1 61.4 68.0 12.7
Tons of products (2,240 pounds each) 98.8 150.7 81.4 18.1
Date of census.
Number of establishments 808 792
Capital $121,722,704 $209,904,965
Wage-earners, average number 77,555 140,798
Total wages $40,514,981 $55,451,510
Men, 16 years and over 75,037 133,023
Women, 16 years and over 82 45
Children, under 16 years 2,436 7,730
Cost of materials used $135,526,132 $191,271,150
Value of products $207,208,696 $296,557,685
Tons of products (2,240 pounds each) 3,263,585 6,486,733
Date of census.
1890.
Number of establishments 719
Capital [DD]$414,044,844
Salaried officials, clerks, etc., number 4,325
Salaries $6,462,236
Wage-earners, average number 171,181
Total wages $89,273,956
Men, 16 years and over 168,943
Wages $88,840,642
Women, 16 years and over 58
Wages $17,106
Children, under 16 years 2,180
Wages $416,208
Miscellaneous expenses $18,214,948
Cost of materials used $327,272,845
Value of products $478,687,519
Tons of products (2,240 pounds each) 16,264,478
Date of census.
1900. 1905.
Number of establishments 669 606
Capital $590,530,484 $948,689,840
Salaried officials, clerks, etc., number 9,217 16,566
Salaries $11,741,788 $20,758,412
Wage-earners, average number 222,607 242,740
Total wages $120,836,338 $141,439,906
Men, 16 years and over 219,635 239,383
Wages $120,157,007 $140,545,610
Women, 16 years and over 1,071 1,455
Wages $266,888 $441,967
Children, under 16 years 1,901 1,902
Wages $412,443 $452,329
Miscellaneous expenses $32,274,100 $47,164,970
Cost of materials used $522,431,701 $620,171,881
Value of products $804,034,918 $905,854,152
Tons of products (2,240 pounds each) 29,507,860 34,844,933
Per cent of increase.
1870 to 1880. 1880 to 1890.
Capital 72.4 97.3
Salaried officials, clerks, etc., number … …
Salaries … …
Wage-earners, average number 81.5 21.6
Total wages 36.9 61.0
Men, 16 years and over 77.3 27.0
Wages … …
Women, 16 years and over [DD]45.1 28.9
Wages … …
Children, under 16 years 217.3 [DD]71.8
Wages … …
Miscellaneous expenses … …
Cost of materials used 41.1 71.1
Value of products 43.1 61.4
Tons of products (2,240 pounds each) 98.8 150.7
Per cent of increase.
1890 to 1900. 1900 to 1905.
Number of establishments [DD]7.0 9.4
Capital 42.6 60.7
Salaried officials, clerks, etc., number 113.1 79.7
Salaries 81.7 76.8
Wage-earners, average number 30.0 9.0
Total wages 35.4 17.1
Men, 16 years and over 30.0 9.0
Wages 35.3 17.0
Women, 16 years and over 1,746.6 35.9
Wages 1,460.2 65.6
Children, under 16 years [DD]12.8 0.1
Wages [DD]0.9 9.7
Miscellaneous expenses 77.2 46.1
Cost of materials used 59.6 18.7
Value of products 68.0 12.7
Tons of products (2,240 pounds each) 81.4 18.1
Production of Pig Iron and of Crude Steel in the United States, 1880 to 1907, and relation of same to Imports and Exports of Iron and Steel Manufactures; also Prices of Representative Iron and Steel Products during the period named.
[From official reports of Bureau of Statistics.]
Year. Pig iron produced in United States. Crude steel produced in United States. Per cent of domestic iron used in home industries (fiscal year). Price per ton of pig iron, No. 1 foundry.[GG] Price of steel rails per ton. Wire nails, price per keg of 100 lbs. Imports of manu- factures of iron and steel. Exports of domestic manu-factures of iron and steel.
Tons. Tons.
1880 3,835,191 1,247,335 78.44 $28.48 $67.52 … $71,266,699 $14,716,524
1881 4,144,254 1,588,314 90.23 25.17 61.08 … 60,604,477 16,604,767
1882 4,623,323 1,736,692 89.36 25.77 48.50 … 67,976,897 20,748,206
1883 4,595,510 1,673,535 91.44 22.42 37.75 … 58,495,246 22,826,528
1884 4,097,868 1,550,879 94.20 19.81 30.75 … 40,147,053 21,909,881
1885 4,044,526 1,711,920 96.43 17.99 28.52 … 33,610,093 16,592,155
1886 5,683,329 2,562,503 93.92 18.71 34.52 $3.51 37,534,078 15,745,569
1887 6,417,148 3,339,071 93.13 20.93 37.08 3.15 49,203,164 15,958,502
1888 6,489,738 2,899,440 95.17 18.88 29.83 2.55 48,992,757 17,763,034
1889 7,603,642 3,385,732 97.35 17.76 29.25 2.49 42,377,793 21,156,077
1890 9,202,703 4,277,071 98.10 18.41 31.78 2.51 41,679,591 25,542,208
1891 8,279,870 3,904,240 99.12 17.52 29.92 2.04 53,544,372 28,909,614
1892 9,157,000 4,927,581 99.01 15.75 30.00 1.70 28,928,103 28,800,930
1893[HH] 7,124,502 4,019,995 99.39 14.52 28.12 1.49 34,937,974 30,106,482
1894[HH] 6,657,388 4,412,032 99.64 12.66 24.00 1.11 20,925,769 29,220,264
1895[HH] 9,446,308 6,114,834 99.79 13.10 24.33 1.69 23,048,515 32,000,989
1896[HH] 8,623,127 5,281,689 99.07 12.95 28.00 2.54 25,338,103 41,160,877
1897 9,652,680 7,156,957 99.77 12.10 18.75 1.46 16,094,557 57,497,872
1898 11,773,934 8,932,857 99.79 11.66 17.62 1.45 12,626,431 70,406,885
1899 13,620,703 10,639,857 99.80 19.36 28.12 2.60 12,100,440 93,716,031
1900 13,789,242 10,188,329 98.55 19.98 32.29 2.76 20,478,728 121,913,548
1901 15,878,354 13,473,595 99.71 15.87 27.33 2.41 17,874,789 117,319,320
1902 17,821,307 14,947,250 99.01 22.19 28.00 2.15 27,180,247 98,552,562
1903 18,009,252 14,534,978 94.92 19.92 28.00 2.13 51,617,312 96,642,467
1904 16,497,033 13,859,887 98.95 15.57 28.00 1.96 27,028,312 111,948,586
1905 22,992,380 20,023,947 99.27 17.88 28.00 1.93 23,510,164 134,728,363
1906 25,307,191 23,398,136 98.94 20.98 28.00 1.98 29,053,987 160,984,985
1907 25,781,361 [II]23,360,000 97.83 23.89 28.00 2.18 40,587,865 181,530,871
Year. Pig iron produced in United States. Crude steel produced in United States. Per cent of domestic iron used in home industries (fiscal year).
Tons. Tons.
1880 3,835,191 1,247,335 78.44
1881 4,144,254 1,588,314 90.23
1882 4,623,323 1,736,692 89.36
1883 4,595,510 1,673,535 91.44
1884 4,097,868 1,550,879 94.20
1885 4,044,526 1,711,920 96.43
1886 5,683,329 2,562,503 93.92
1887 6,417,148 3,339,071 93.13
1888 6,489,738 2,899,440 95.17
1889 7,603,642 3,385,732 97.35
1890 9,202,703 4,277,071 98.10
1891 8,279,870 3,904,240 99.12
1892 9,157,000 4,927,581 99.01
1893[HH] 7,124,502 4,019,995 99.39
1894[HH] 6,657,388 4,412,032 99.64
1895[HH] 9,446,308 6,114,834 99.79
1896[HH] 8,623,127 5,281,689 99.07
1897 9,652,680 7,156,957 99.77
1898 11,773,934 8,932,857 99.79
1899 13,620,703 10,639,857 99.80
1900 13,789,242 10,188,329 98.55
1901 15,878,354 13,473,595 99.71
1902 17,821,307 14,947,250 99.01
1903 18,009,252 14,534,978 94.92
1904 16,497,033 13,859,887 98.95
1905 22,992,380 20,023,947 99.27
1906 25,307,191 23,398,136 98.94
1907 25,781,361 [II]23,360,000 97.83
Year. Price per ton of pig iron, No. 1 foundry.[GG] Price of steel rails per ton. Wire nails, price per keg of 100 lbs.
1880 $28.48 $67.52 …
1881 25.17 61.08 …
1882 25.77 48.50 …
1883 22.42 37.75 …
1884 19.81 30.75 …
1885 17.99 28.52 …
1886 18.71 34.52 $3.51
1887 20.93 37.08 3.15
1888 18.88 29.83 2.55
1889 17.76 29.25 2.49
1890 18.41 31.78 2.51
1891 17.52 29.92 2.04
1892 15.75 30.00 1.70
1893[HH] 14.52 28.12 1.49
1894[HH] 12.66 24.00 1.11
1895[HH] 13.10 24.33 1.69
1896[HH] 12.95 28.00 2.54
1897 12.10 18.75 1.46
1898 11.66 17.62 1.45
1899 19.36 28.12 2.60
1900 19.98 32.29 2.76
1901 15.87 27.33 2.41
1902 22.19 28.00 2.15
1903 19.92 28.00 2.13
1904 15.57 28.00 1.96
1905 17.88 28.00 1.93
1906 20.98 28.00 1.98
1907 23.89 28.00 2.18
Year. Imports of manufactures of iron and steel. Exports of domestic manufactures of iron and steel.
1880 $71,266,699 $14,716,524
1881 60,604,477 16,604,767
1882 67,976,897 20,748,206
1883 58,495,246 22,826,528
1884 40,147,053 21,909,881
1885 33,610,093 16,592,155
1886 37,534,078 15,745,569
1887 49,203,164 15,958,502
1888 48,992,757 17,763,034
1889 42,377,793 21,156,077
1890 41,679,591 25,542,208
1891 53,544,372 28,909,614
1892 28,928,103 28,800,930
1893[HH] 34,937,974 30,106,482
1894[HH] 20,925,769 29,220,264
1895[HH] 23,048,515 32,000,989
1896[HH] 25,338,103 41,160,877
1897 16,094,557 57,497,872
1898 12,626,431 70,406,885
1899 12,100,440 93,716,031
1900 20,478,728 121,913,548
1901 17,874,789 117,319,320
1902 27,180,247 98,552,562
1903 51,617,312 96,642,467
1904 27,028,312 111,948,586
1905 23,510,164 134,728,363
1906 29,053,987 160,984,985
1907 40,587,865 181,530,871
Annual Production of Bessemer Steel Rails in the United States from 1867 to 1907, and their Average Annual Price at the Works in Pennsylvania.
Years. Gross tons. Price.
1867 2,277 $166.00
1868 6,451 158.46
1869 8,616 132.19
1870 30,357 106.79
1871 34,152 102.52
1872 83,991 111.94
1873 115,192 120.58
1874 129,414 94.28
1875 259,699 68.75
1876 368,269 59.25
1877 385,865 45.58
1878 491,427 42.21
1879 610,682 48.21
1880 852,196 67.52
1881 1,187,770 61.08
1882 1,284,067 48.50
1883 1,148,709 87.75
1884 996,983 30.75
1885 959,471 28.52
1886 1,574,703 34.52
1887 2,101,904 37.08
1888 1,386,277 29.83
1889 1,510,057 29.25
1890 1,867,837 31.78
1891 1,293,053 29.92
1892 1,537,588 30.00
1893 1,129,400 28.12
1894 1,016,013 24.00
1895 1,299,628 24.33
1896 1,116,958 28.00
1897 1,644,520 18.75
1898 1,976,702 17.62
1899 2,270,585 28.12
1900 2,383,654 32.29
1901 2,870,816 27.33
1902 2,985,892 28.00
1903 2,946,756 28.00
1904 2,137,957 28.00
1905 3,192,347 28.00
1906 3,791,459 28.00
1907 3,380,025 28.00
Production of Tin Plates in and Importation of Tin Plates into the United States, 1891 to 1908, in long tons.
Calendar Year. Production, Long tons. Importation, Long tons.
1891 552 327,882
1892 18,803 268,472
1893 55,182 253,155
1894 74,260 215,068
1895 113,666 219,545
1896 160,862 119,171
1897 256,598 83,851
1898 326,915 67,222
1899 397,767 58,915
1900 302,665 60,386
1901 399,291 77,395
1902 366,000 60,115
1903 480,000 47,360
1904 458,000 70,652
1905 493,500 65,740
1906 577,562 56,983
1907 514,777 57,773
1908 … 58,490
Commerce of the United States by Great Groups and Share which Manufactures and Raw Material Formed of the Total, 1820 to 1909.
Imports.
Year ending June 30— Foodstuffs in crude condition and food animals. Foodstuffs partly or wholly manufactured. Crude materials for use in manufacturing. Manufactures for further use in manufacturing.
Dollars. Percent of Total Dollars. Percent of Total Dollars. Percent of Total Dollars. Percent of Total
1820 6,081,641 11.15 10,820,814 19.85 1,983,706 3.64 4,079,064 7.48
1830 7,382,274 11.77 9,653,971 15.39 4,214,825 6.72 5,152,486 8.22
1840 15,273,321 15.54 15,188,845 15.46 11,510,245 11.71 11,356,196 11.56
1850 18,011,659 10.38 21,465,776 12.37 11,711,266 6.75 26,163,152 15.08
1860 35,743,826 10.11 53,771,067 15.21 37,073,022 10.49 23,613,395 6.67
1870 53,981,838 12.38 96,253,561 22.08 53,118,022 12.18 54,545,306 12.51
1875 90,018,885 16.89 113,145,852 21.23 78,891,769 14.80 63,411,606 11.89
1880 .100,297,040 15.01 118,125,216 17.69 131,861,617 19.74 110,779,516 16.59
1881 .102,486,852 15.95 123,380,388 19.20 114,244,631 17.77 87,790,890 13.66
1882 .104,947,672 14.49 139,438,506 19.24 131,356,113 18.13 98,623,766 13.61
1883 93,091,358 12.87 142,127,926 19.65 133,612,450 18.48 98,755,423 13.66
1884 .103,010,830 15.43 130,778,286 19.59 119,150,641 17.84 94,698,249 14.18
1885 93,345,583 16.16 102,937,933 17.82 106,774,553 18.49 78,254,677 13.55
1886 91,588,644 14.41 112,771,436 17.75 128,434,759 20.22 91,539,244 14.40
1887 .106,362,234 15.36 111,714,382 16.14 143,361,050 20.71 120,079,754 17.34
1888 .116,087,107 16.03 111,048,075 15.34 155,057,432 21.42 121,605,094 16.80
1889 .123,130,984 16.53 122,254,266 16.41 163,548,106 21.94 115,079,918 15.44
1890 .128,480,142 16.28 133,332,031 16.89 170,637,250 21.62 116,924,080 14.81
1891 .150,639,399 17.83 147,721,884 17.48 184,175,197 21.80 136,446,309 16.15
1892 .175,558,861 21.22 139,794,773 16.89 188,317,595 22.76 112,729,303 13.63
1893 .131,663,968 15.19 153,739,181 17.75 209,277,112 24.16 135,608,418 15.65
1894 .133,309,989 20.35 155,348,824 23.72 130,086,011 19.86 82,894,732 12.65
1895 .141,377,238 19.31 107,026,180 14.63 180,939,902 24.72 96,486,622 13.18
1896 .130,002,310 16.67 118,805,703 15.24 197,646,852 25.35 101,070,937 12.96
1897 .128,379,785 16.79 129,244,951 16.90 196,159,371 25.66 88,490,406 11.57
1898 .103,984,608 16.88 86,091,010 13.97 189,322,244 30.73 79,288,417 12.88
1899 98,933,256 14.19 123,448,135 17.71 208,565,691 29.91 91,953,914 13.19
1900 97,916,293 11.52 133,027,374 15.65 276,241,152 32.50 134,222,045 15.79
1901 .110,385,208 13.43 125,540,654 15.25 248,006,751 30.13 127,576,924 15.49
1902 .120,280,302 13.31 95,350,256 10.56 303,001,868 33.55 147,656,292 16.34
1903 .119,202,674 11.62 116,620,623 11.37 330,491,084 32.22 195,750,847 19.08
1904 .132,223,895 13.34 118,222,862 11.93 320,794,431 32.37 160,233,890 16.17
1905 .146,130,903 13.08 145,355,839 13.01 389,160,658 34.82 177,827,960 15.91
1906 .134,315,448 10.95 140,358,114 11.44 414,687,999 33.81 220,298,751 17.96
1907 .149,747,693 10.44 158,656,263 11.06 477,027,174 33.25 274,096,464 19.11
1908 .145,577,427 12.19 147,008,870 12.31 363,482,258 30.43 196,248,409 16.43
1909 .163,921,598 12.49 165,028,764 12.58 453,319,751 34.55 222,580,277 16.97
Year ending June 30— Manufactures ready for consumption. Miscellaneous. Total.
Dollars. Percent of Total Dollars. Percent of Total Dollars.
1820 30,998,900 56.86 556,709 1.02 54,520,834
1830 35,734,837 56.97 582,563 .93 62,720,956
1840 44,300,005 45.09 630,094 .64 98,258,706
1850 95,312,499 54.93 845,174 .49 173,509,526
1860 199,878,690 56.52 3,536,119 1.00 353,616,119
1870 173,034,847 39.69 5,024,834 1.16 435,958,408
1875 177,891,440 33.38 9,645,884 1.81 533,005,436
1880 196,587,405 29.43 10,303,952 1.54 667,954,746
1881 203,725,925 31.70 11,035,942 1.72 642,664,628
1882 238,716,691 32.94 11,556,826 1.59 724,639,574
1883 242,945,562 33.59 12,648,195 1.75 723,180,914
1884 207,771,072 31.12 12,288,615 1.84 667,697,693
1885 182,543,076 31.61 13,671,507 2.37 577,527,329
1886 194,791,568 30.65 16,310,485 2.57 635,436,136
1887 202,800,073 29.29 8,002,275 1.16 692,319,768
1888 211,218,652 29.17 8,940,754 1.24 723,957,114
1889 212,482,518 28.52 8,635,860 1.16 745,131,652
1890 230,685,581 29.23 9,251,325 1.17 789,310,409
1891 217,577,775 25.75 8,355,632 .99 844,916,196
1892 204,543,857 24.72 6,458,073 .78 827,402,462
1893 228,764,866 26.40 7,347,377 .85 866,400,922
1894 148,798,021 22.72 4,557,045 .70 654,994,622
1895 199,543,108 27.26 6,596,915 .90 731,969,965
1896 226,639,759 29.07 5,559,113 .71 779,724,674
1897 217,843,918 28.48 4,611,981 .60 764,730,412
1898 153,025,210 24.84 4,338,165 .70 616,049,654
1899 169,516,630 24.32 4,730,863 .68 697,148,489
1900 203,126,341 23.90 5,407,979 .64 849,941,184
1901 205,505,580 24.96 6,157,048 .74 823,172,165
1902 231,420,820 25.62 5,611,410 .62 903,320,948
1903 257,757,184 25.13 5,896,825 .58 1,025,719,237
1904 252,857,673 25.51 6,754,620 .68 991,087,371
1905 252,372,650 22.58 6,665,061 .60 1,117,513,071
1906 307,801,154 25.10 9,100,980 .74 1,226,562,446
1907 364,192,884 25.39 10,700,947 .75 1,434,421,425
1908 331,617,926 27.77 10,406,902 .87 1,194,341,792
1909 297,617,739 22.69 9,452,095 .72 1,311,920,224
Year ending June 30— Foodstuffs in crude condition and food animals.
Dollars. Percent of Total
1820 6,081,641 11.15
1830 7,382,274 11.77
1840 15,273,321 15.54
1850 18,011,659 10.38
1860 35,743,826 10.11
1870 53,981,838 12.38
1875 90,018,885 16.89
1880 100,297,040 15.01
1881 102,486,852 15.95
1882 104,947,672 14.49
1883 93,091,358 12.87
1884 103,010,830 15.43
1885 93,345,583 16.16
1886 91,588,644 14.41
1887 106,362,234 15.36
1888 116,087,107 16.03
1889 123,130,984 16.53
1890 128,480,142 16.28
1891 150,639,399 17.83
1892 175,558,861 21.22
1893 131,663,968 15.19
1894 133,309,989 20.35
1895 141,377,238 19.31
1896 130,002,310 16.67
1897 128,379,785 16.79
1898 103,984,608 16.88
1899 98,933,256 14.19
1900 97,916,293 11.52
1901 110,385,208 13.43
1902 120,280,302 13.31
1903 119,202,674 11.62
1904 132,223,895 13.34
1905 146,130,903 13.08
1906 134,315,448 10.95
1907 149,747,693 10.44
1908 145,577,427 12.19
1909 163,921,598 12.49
Year ending June 30— Foodstuffs partly or wholly manufactured.
Dollars. Percent of Total
1820 10,820,814 19.85
1830 9,653,971 15.39
1840 15,188,845 15.46
1850 21,465,776 12.37
1860 53,771,067 15.21
1870 96,253,561 22.08
1875 113,145,852 21.23
1880 118,125,216 17.69
1881 123,380,388 19.20
1882 139,438,506 19.24
1883 142,127,926 19.65
1884 130,778,286 19.59
1885 102,937,933 17.82
1886 112,771,436 17.75
1887 111,714,382 16.14
1888 111,048,075 15.34
1889 122,254,266 16.41
1890 133,332,031 16.89
1891 147,721,884 17.48
1892 139,794,773 16.89
1893 153,739,181 17.75
1894 155,348,824 23.72
1895 107,026,180 14.63
1896 118,805,703 15.24
1897 129,244,951 16.90
1898 86,091,010 13.97
1899 123,448,135 17.71
1900 133,027,374 15.65
1901 125,540,654 15.25
1902 95,350,256 10.56
1903 116,620,623 11.37
1904 118,222,862 11.93
1905 145,355,839 13.01
1906 140,358,114 11.44
1907 158,656,263 11.06
1908 147,008,870 12.31
1909 165,028,764 12.58
Year ending June 30— Crude materials for use in manufacturing.
Dollars. Percent of Total
1820 1,983,706 3.64
1830 4,214,825 6.72
1840 11,510,245 11.71
1850 11,711,266 6.75
1860 37,073,022 10.49
1870 53,118,022 12.18
1875 78,891,769 14.80
1880 131,861,617 19.74
1881 114,244,631 17.77
1882 131,356,113 18.13
1883 133,612,450 18.48
1884 119,150,641 17.84
1885 106,774,553 18.49
1886 128,434,759 20.22
1887 143,361,050 20.71
1888 155,057,432 21.42
1889 163,548,106 21.94
1890 170,637,250 21.62
1891 184,175,197 21.80
1892 188,317,595 22.76
1893 209,277,112 24.16
1894 130,086,011 19.86
1895 180,939,902 24.72
1896 197,646,852 25.35
1897 196,159,371 25.66
1898 189,322,244 30.73
1899 208,565,691 29.91
1900 276,241,152 32.50
1901 248,006,751 30.13
1902 303,001,868 33.55
1903 330,491,084 32.22
1904 389,160,658 34.82
1906 414,687,999 33.81
1907 477,027,174 33.25
1908 363,482,258 30.43
1909 453,319,751 34.55
Year ending June 30— Manufactures for further use in manufacturing.
Dollars. Percent of Total
1820 4,079,064 7.48
1830 5,152,486 8.22
1840 11,356,196 11.56
1850 26,163,152 15.08
1860 23,613,395 6.67
1870 54,545,306 12.51
1875 63,411,606 11.89
1880 110,779,516 16.59
1881 87,790,890 13.66
1882 98,623,766 13.61
1883 98,755,423 13.66
1884 94,698,249 14.18
1885 78,254,677 13.55
1886 91,539,244 14.40
1887 120,079,754 17.34
1888 121,605,094 16.80
1889 115,079,918 15.44
1890 116,924,080 14.81
1891 136,446,309 16.15
1892 112,729,303 13.63
1893 135,608,418 15.65
1894 82,894,732 12.65
1895 96,486,622 13.18
1896 101,070,937 12.96
1897 88,490,406 11.57
1898 79,288,417 12.88
1899 91,953,914 13.19
1900 134,222,045 15.79
1901 127,576,924 15.49
1902 147,656,292 16.34
1903 195,750,847 19.08
1904 177,827,960 15.91
1906 220,298,751 17.96
1907 274,096,464 19.11
1908 196,248,409 16.43
1909 222,580,277 16.97
Year ending June 30— Manufactures ready for consumption.
Dollars. Percent of Total
1820 30,998,900 56.86
1830 35,734,837 56.97
1840 44,300,005 45.09
1850 95,312,499 54.93
1860 199,878,690 56.52
1870 173,034,847 39.69
1875 177,891,440 33.38
1880 196,587,405 29.43
1881 203,725,925 31.70
1882 238,716,691 32.94
1883 242,945,562 33.59
1884 207,771,072 31.12
1885 182,543,076 31.61
1886 194,791,568 30.65
1887 202,800,073 29.29
1888 211,218,652 29.17
1889 212,482,518 28.52
1890 230,685,581 29.23
1891 217,577,775 25.75
1892 204,543,857 24.72
1893 228,764,866 26.40
1894 148,798,021 22.72
1895 199,543,108 27.26
1896 226,639,759 29.07
1897 217,843,918 28.48
1898 153,025,210 24.84
1899 169,516,630 24.32
1900 203,126,341 23.90
1901 205,505,580 24.96
1902 231,420,820 25.62
1903 257,757,184 25.13
1904 252,857,673 25.51
1905 252,372,650 22.58
1906 307,801,154 25.10
1907 364,192,884 25.39
1908 331,617,926 27.77
1909 297,617,739 22.69
Year ending June 30— Miscellaneous. Total.
Dollars. Percent of Total Dollars.
1820 556,709 1.02 54,520,834
1830 582,563 .93 62,720,956
1840 630,094 .64 98,258,706
1850 845,174 .49 173,509,526
1860 3,536,119 1.00 353,616,119
1870 5,024,834 1.16 435,958,408
1875 9,645,884 1.81 533,005,436
1880 10,303,952 1.54 667,954,746
1881 11,035,942 1.72 642,664,628
1882 11,556,826 1.59 724,639,574
1883 12,648,195 1.75 723,180,924
1884 12,288,615 1.84 667,697,693
1885 13,671,507 2.37 577,527,329
1886 16,310,485 2.57 635,436,136
1887 8,002,275 1.16 692,319,768
1888 8,940,754 1.24 723,957,114
1889 8,635,860 1.16 745,131,652
1890 9,251,325 1.17 789,310,409
1891 8,355,632 .99 844,916,196
1892 6,458,073 .78 827,402,462
1893 7,347,377 .85 866,400,922
1894 4,557,045 .70 654,994,622
1895 6,596,915 .90 731,969,965
1896 5,559,113 .71 779,724,674
1897 4,611,981 .60 764,730,412
1898 4,338,165 .70 616,049,654
1899 4,730,863 .68 697,148,489
1900 5,407,979 .64 849,941,184
1901 6,157,048 .74 823,172,165
1902 5,611,410 .62 903,320,948
1903 5,896,825 .58 1,025,719,237
1904 6,754,620 .68 991,087,371
1905 6,665,061 .60 1,117,513,071
1906 9,100,980 .74 1,226,562,446
1907 10,700,947 .75 1,434,421,425
1908 10,406,902 .87 1,194,341,792
1909 9,452,095 .72 1,311,920,224
Commerce of the United States by Great Groups, 1820 to 1909.
Exports (domestic).
Year ending June 30— Foodstuffs in crude condition and food animals. Foodstuffs partly or wholly prepared. Crude materials for use in manufacturing. Manufactures for further use in manufacturing.
Dollars. Percent of Total Dollars. Percent of Total Dollars. Percent of Total Dollars. Percent of Total
1820 2,474,822 4.79 10,085,366 19.51 31,246,382 60.46 4,867,379 9.42
1830 2,724,181 4.65 9,556,992 16.32 36,482,266 62.34 4,117,606 7.04
1840 4,564,532 4.09 15,936,108 14.27 75,488,421 67.61 4,841,101 4.34
1850 7,535,764 5.59 20,017,162 14.84 83,984,707 62.26 6,060,900 4.49
1860 12,166,447 3.85 38,624,949 12.21 216,009,648 68.31 12,641,625 3.99
1870 41,852,630 11.12 50,919,666 13.53 213,439,991 56.64 13,711,708 3.66
1875 79,077,679 15.84 110,292,780 22.09 206,271,795 41.31 27,458,054 5.50
1880 266,108,950 32.30 193,352,723 23.47 238,787,934 28.98 29,044,159 3.52
1881 241,641,847 27.34 226,386,821 25.62 278,918,722 31.55 32,820,713 3.71
1882 155,008,497 21.14 178,002,738 24.28 233,294,072 31.82 37,164,800 5.07
1883 163,196,443 20.29 186,392,822 23.18 288,841,684 35.92 37,996,198 4.72
1884 130,395,872 17.99 194,703,245 26.86 239,510,224 33.04 37,800,437 5.21
1885 123,326,867 16.97 201,800,801 27.77 248,611,181 34.22 39,437,313 5.42
1886 100,799,692 15.13 162,689,021 24.43 254,409,407 38.21 34,037,715 5.11
1887 125,453,686 17.85 175,784,781 25.00 250,236,436 35.60 36,732,490 5.22
1888 86,368,408 12.63 169,872,314 24.84 271,275,629 39.67 40,176,023 5.88
1889 98,847,455 13.54 174,504,227 23.90 286,235,227 39.19 42,712,932 5.85
1890 132,073,183 15.62 224,756,580 26.59 304,566,922 36.03 46,454,992 5.50
1891 106,155,721 12.17 226,448,303 25.96 346,848,321 39.77 47,961,372 5.49
1892 262,455,846 25.84 250,438,545 24.66 315,096,548 31.02 50,284,241 4.95
1893 153,277,859 18.43 247,075,061 29.73 247,289,240 29.75 49,070,703 5.94
1894 133,196,928 15.30 249,846,142 28.77 276,068,989 31.70 67,145,189 7.72
1895 99,051,108 12.49 219,125,531 27.62 264,194,679 33.30 61,812,896 7.78
1896 128,550,669 14.90 219,413,574 25.41 251,817,571 29.17 76,219,728 8.85
1897 181,420,814 17.58 235,051,930 22.79 296,834,858 28.76 98,284,243 9.52
1898 305,108,915 25.21 284,879,827 23.54 286,311,334 23.66 101,990,563 8.43
1899 232,903,066 19.35 304,754,736 25.31 277,723,374 23.07 117,730,260 9.78
1900 227,347,193 16.59 318,126,502 23.28 325,589,000 23.75 152,890,591 11.15
1901 246,394,140 16.88 336,605,378 23.05 397,767,463 27.24 148,013,625 10.12
1902 184,786,389 13.63 328,831,350 24.27 373,595,243 27.56 131,918,311 9.73
1903 185,308,064 13.31 323,244,251 23.22 408,679,699 29.35 140,415,620 10.09
1904 135,747,224 9.46 308,835,694 21.52 461,716,328 32.17 174,574,136 12.17
1905 118,185,098 7.92 283,064,680 18.98 472,665,309 31.69 209,361,544 14.03
1906 177,216,467 10.32 347,385,462 20.22 500,536,700 29.13 226,210,513 13.17
1907 167,348,227 9.03 345,706,609 18.65 593,145,135 32.00 259,414,784 13.99
1908 189,051,824 10.30 331,961,663 18.10 556,681,462 30.33 261,105,883 14.23
1909 135,663,625 8.28 302,457,444 18.46 520,768,631 31.78 229,937,155 14.04
Year ending June 30— Manufactures ready for consumption. Miscellaneous. Total.
Dollars. Percent of Total Dollars. Percent of Total Dollars.
1820 2,925,165 5.66 84,526 0.16 51,683,640
1830 5,461,589 9.34 182,244 .31 58,524,878
1840 10,584,079 9.47 246,320 .22 111,660,561
1850 17,162,206 12.72 139,494 .10 134,900,233
1860 35,811,383 11.33 988,371 .31 316,242,423
1870 56,329,137 14.96 363,341 .09 376,616,473
1875 74,503,493 14.92 1,680,299 .34 499,284,100
1880 92,774,139 11.26 3,878,448 .47 823,946,353
1881 102,458,449 11.59 1,699,395 .19 883,925,947
1882 124,835,385 17.02 4,934,240 .67 733,239,732
1883 122,448,549 15.23 5,347,936 .66 804,223,632
1884 118,172,882 16.30 4,382,192 .60 724,964,852
1885 110,818,865 15.25 2,687,919 .37 726,682,946
1886 111,627,312 16.76 2,401,382 .36 665,964,529
1887 112,417,839 15.99 2,397,691 .34 703,022,923
1888 113,892,689 16.65 2,277,041 .33 683,862,104
1889 123,183,883 16.87 4,798,885 .65 730,282,609
1890 132,527,050 15.68 4,915,101 .58 845,293,828
1891 140,349,741 16.09 4,506,825 .52 872,270,283
1892 132,792,441 13.07 4,664,390 .46 1,015,732,011
1893 129,938,284 15.63 4,379,638 .52 831,030,785
1894 135,659,274 15.61 7,288,415 .84 869,204,937
1895 143,244,969 18.06 5,963,407 .75 793,392,590
1896 181,789,157 21.04 5,409,788 .63 863,200,487
1897 212,959,122 20.63 7,456,636 .72 1,032,007,603
1898 222,537,358 18.38 9,463,916 .78 1,210,291,913
1899 262,656,583 21.81 8,163,203 .68 1,203,931,222
1900 331,955,684 24.15 14,854,601 1.08 1,370,763,571
1901 317,764,367 21.76 13,917,833 .95 1,460,462,806
1902 321,946,540 23.75 14,404,028 1.06 1,355,481,861
1903 327,489,757 23.52 7,100,911 .51 1,392,231,302
1904 348,745,843 24.30 5,559,792 .38 1,435,179,017
1905 402,064,030 26.95 6,403,980 .43 1,491,744,641
1906 459,812,656 26.76 6,791,584 .40 1,717,953,382
1907 480,708,667 25.93 7,394,612 .40 1,853,718,034
1908 489,469,958 26.68 6,515,567 .36 1,834,786,357
1909 441,820,754 26.97 7,707,984 .47 1,638,355,593
Year ending June 30— Foodstuffs in crude condition and food animals.
Dollars. Percent of Total
1820 2,474,822 4.79
1830 2,724,181 4.65
1840 4,564,532 4.09
1850 7,535,764 5.59
1860 12,166,447 3.85
1870 41,852,630 11.12
1875 79,077,679 15.84
1880 266,108,950 32.30
1881 241,641,847 27.34
1882 155,008,497 21.14
1883 163,196,443 20.29
1884 130,395,872 17.99
1885 123,326,867 16.97
1886 100,799,692 15.13
1887 125,453,686 17.85
1888 86,368,408 12.63
1889 98,847,455 13.54
1890 132,073,183 15.62
1891 106,155,721 12.17
1892 262,455,846 25.84
1893 153,277,859 18.43
1894 133,196,928 15.30
1895 99,051,108 12.49
1896 128,550,669 14.90
1897 181,420,814 17.58
1898 305,108,915 25.21
1899 232,903,066 19.35
1900 227,347,193 16.59
1901 246,394,140 16.88
1902 184,786,389 13.63
1903 185,308,064 13.31
1904 135,747,224 9.46
1905 118,185,098 7.92
1906 177,216,467 10.32
1907 167,348,227 9.03
1908 189,051,824 10.30
1909 135,663,625 8.28
Year ending June 30— Foodstuffs partly or wholly prepared.
Dollars. Percent of Total
1820 10,085,366 19.51
1830 9,556,992 16.32
1840 15,936,108 14.27
1850 20,017,162 14.84
1860 38,624,949 12.21
1870 50,919,666 13.53
1875 110,292,780 22.09
1880 193,352,723 23.47
1881 226,386,821 25.62
1882 178,002,738 24.28
1883 186,392,822 23.18
1884 194,703,245 26.86
1885 201,800,801 27.77
1886 162,689,021 24.43
1887 175,784,781 25.00
1888 169,872,314 24.84
1889 174,504,227 23.90
1890 224,756,580 26.59
1891 226,448,303 25.96
1892 250,438,545 24.66
1893 247,075,061 29.73
1894 249,846,142 28.77
1895 219,125,531 27.62
1896 219,413,574 25.41
1897 235,051,930 22.79
1898 284,879,827 23.54
1899 304,754,736 25.31
1900 318,126,502 23.28
1901 336,605,378 23.05
1902 328,831,350 24.27
1903 323,244,251 23.22
1904 308,835,694 21.52
1905 283,064,680 18.98
1906 347,385,462 20.22
1907 345,706,609 18.65
1908 331,961,663 18.10
1909 302,457,444 18.46
Year ending June 30— Crude materials for use in manufacturing.
Dollars. Percent of Total
1820 31,246,382 60.46
1830 36,482,266 62.34
1840 75,488,421 67.61
1850 83,984,707 62.26
1860 216,009,648 68.31
1870 213,439,991 56.64
1875 206,271,795 41.31
1880 238,787,934 28.98
1881 278,918,722 31.55
1882 233,294,072 31.82
1883 288,841,684 35.92
1884 239,510,224 33.04
1885 248,611,181 34.22
1886 254,409,407 38.21
1887 250,236,436 35.60
1888 271,275,629 39.67
1889 286,235,227 39.19
1890 304,566,922 36.03
1891 346,848,321 39.77
1892 315,096,548 31.02
1893 247,289,240 29.75
1894 276,068,989 31.70
1895 264,194,679 33.30
1896 251,817,571 29.17
1897 296,834,858 28.76
1898 286,311,334 23.66
1899 277,723,374 23.07
1900 325,589,000 23.75
1901 397,767,463 27.24
1902 373,595,243 27.56
1903 408,679,699 29.35
1904 461,716,328 32.17
1905 472,665,309 31.69
1906 500,536,700 29.13
1907 593,145,135 32.00
1908 556,681,462 30.33
1909 520,768,631 31.78
Year ending June 30— Manufactures for further use in manufacturing.
Dollars. Percent of Total
1820 4,867,379 9.42
1830 4,117,606 7.04
1840 4,841,101 4.34
1850 6,060,900 4.49
1860 12,641,625 3.99
1870 13,711,708 3.66
1875 27,458,054 5.50
1880 29,044,159 3.52
1881 32,820,713 3.71
1882 37,164,800 5.07
1883 37,996,198 4.72
1884 37,800,437 5.21
1885 39,437,313 5.42
1886 34,037,715 5.11
1887 36,732,490 5.22
1888 40,176,023 5.88
1889 42,712,932 5.85
1890 46,454,992 5.50
1891 47,961,372 5.49
1892 50,284,241 4.95
1893 49,070,703 5.94
1894 67,145,189 7.72
1895 61,812,896 7.78
1896 76,219,728 8.85
1897 98,284,243 9.52
1898 101,990,563 8.43
1899 117,730,260 9.78
1900 152,890,591 11.15
1901 148,013,625 10.12
1902 131,918,311 9.73
1903 140,415,620 10.09
1904 174,574,136 12.17
1905 209,361,544 14.03
1906 226,210,513 13.17
1907 259,414,784 13.99
1908 261,105,883 14.23
1909 229,937,155 14.04
Year ending June 30— Manufactures ready for consumption.
Dollars. Percent of Total
1820 2,925,165 5.66
1830 5,461,589 9.34
1840 10,584,079 9.47
1850 17,162,206 12.72
1860 35,811,383 11.33
1870 56,329,137 14.96
1875 74,503,493 14.92
1880 92,774,139 11.26
1881 102,458,449 11.59
1882 124,835,385 17.02
1883 122,448,549 15.23
1884 118,172,882 16.30
1885 110,818,865 15.25
1886 111,627,312 16.76
1887 112,417,839 15.99
1888 113,892,689 16.65
1889 123,183,883 16.87
1890 132,527,050 15.68
1891 140,349,741 16.09
1892 132,792,441 13.07
1893 129,938,284 15.63
1894 135,659,274 15.61
1895 143,244,969 18.06
1896 181,789,157 21.04
1897 212,959,122 20.63
1898 222,537,358 18.38
1899 262,656,583 21.81
1900 331,955,684 24.15
1901 317,764,367 21.76
1902 321,946,540 23.75
1903 327,489,757 23.52
1904 348,745,843 24.30
1905 402,064,030 26.95
1906 459,812,656 26.76
1907 480,708,667 25.93
1908 489,469,958 26.68
1909 441,820,754 26.97
Year ending June 30— Miscellaneous. Total.
Dollars. Percent of Total Dollars.
1820 84,526 0.16 51,683,640
1830 182,244 .31 58,524,878
1840 246,320 .22 111,660,561
1850 139,494 .10 134,900,233
1860 988,371 .31 316,242,423
1870 363,341 .09 376,616,473
1875 1,680,299 .34 499,284,100
1880 3,878,448 .47 823,946,353
1881 1,699,395 .19 883,925,947
1882 4,934,240 .67 733,239,732
1883 5,347,936 .66 804,223,632
1884 4,382,192 .60 724,964,852
1885 2,687,919 .37 726,682,946
1886 2,401,382 .36 665,964,529
1887 2,397,691 .34 703,022,923
1888 2,277,041 .33 683,862,104
1889 4,798,885 .65 730,282,609
1890 4,915,101 .58 845,293,828
1891 4,506,825 .52 872,270,283
1892 4,664,390 .46 1,015,732,011
1893 4,379,638 .52 831,030,785
1894 7,288,415 .84 869,204,937
1895 5,963,407 .75 793,392,590
1896 5,409,788 .63 863,200,487
1897 7,456,636 .72 1,032,007,603
1898 9,463,916 .78 1,210,291,913
1899 8,163,203 .68 1,203,931,222
1900 14,854,601 1.08 1,370,763,571
1901 13,917,833 .95 1,460,462,806
1902 14,404,028 1.06 1,355,481,861
1903 7,100,911 .51 1,392,231,302
1904 5,559,792 .38 1,435,179,017
1905 6,403,980 .43 1,491,744,641
1906 6,791,584 .40 1,717,953,382
1907 7,394,612 .40 1,853,718,034
1908 6,515,567 .36 1,834,786,357
1909 7,707,984 .47 1,638,355,593
Population of the United States 10 Years of Age and Upward, Engaged in Manufacturing and Other Gainful Occupations, Census Year 1900, by Sex.
[From reports of the Bureau of the Census, Department of Commerce and Labor.]
OCCUPATION. 1900.
Male. Female. Total.
AGRICULTURAL PURSUITS 9,404,429 977,336 10,381,765
PROFESSIONAL SERVICE 827,941 430,597 1,258,538
DOMESTIC AND PERSONAL SERVICE 3,485,208 2,095,449 5,580,657
TRADE AND TRANSPORTATION 4,263,617 503,347 4,766,964
MANUFACTURING AND MECHANICAL PURSUITS 5,772,641 1,312,668 7,085,309
Building trades.
Carpenters and joiners 599,707 545 600,252
Masons (brick and stone) 160,638 167 160,805
Painters, glaziers, and varnishers 275,782 1,759 277,541
Paper hangers 21,749 241 21,990
Plasterers 35,649 45 35,694
Plumbers and gas and steam fitters 97,659 126 97,785
Roofers and slaters 9,065 2 9,067
Mechanics (not otherwise specified) 9,351 27 9,378
Chemicals and allied products.
Oil well and oil works employes 24,573 53 24,626
Other chemical workers 12,035 2,688 14,723
Clay, glass, and stone products.
Brick and tile makers, etc. 49,455 478 49,933
Glassworkers 47,377 2,621 49,998
Marble and stone cutters 54,317 143 54,460
Potters 13,200 2,940 16,140
Fishing and mining.
Fishermen and oystermen 68,478 462 68,940
Miners and quarrymen 562,417 989 563,406
Food and kindred products.
Bakers 74,860 4,328 79,188
Butchers 112,815 378 113,193
Butter and cheese makers 18,593 648 19,241
Confectioners 21,980 9,214 31,194
Millers 40,362 186 40,548
Other food preparers 23,640 5,142 28,782
Iron and steel and their products.
Blacksmiths 226,284 193 226,477
Iron and steel workers 287,241 3,297 290,538
Machinists 282,574 571 283,145
Steam boiler makers 33,038 8 33,046
Stove, furnace, and grate makers 12,430 43 12,473
Tool and cutlery makers 27,376 746 28,122
Wheelwrights 13,495 10 13,505
Wireworkers 16,701 1,786 18,487
Leather and its finished products.
Boot and shoe makers and repairers 169,393 39,510 208,903
Harness and saddle makers and repairers 39,506 595 40,101
Leather curriers and tanners 40,917 1,754 42,671
Trunk and leather-case makers, etc. 5,472 1,579 7,051
Liquors and beverages.
Bottlers and soda water makers, etc. 9,725 794 10,519
Brewers and maltsters 20,687 275 20,962
Distillers and rectifiers 3,114 30 3,144
Lumber and its remanufactures.
Cabinetmakers 35,552 67 35,619
Coopers 37,087 113 37,200
Saw and planing mill employes 161,251 373 161,624
Other woodworkers 104,791 6,805 111,596
Metals and metal products other than iron and steel.
Brassworkers 25,870 890 26,760
Clock and watch makers and repairers 19,305 4,815 24,120
Gold and silver workers 19,732 6,380 26,112
Tin plate and tinware makers 68,730 1,775 70,505
Other metal workers 54,282 2,320 56,602
Paper and printing.
Bookbinders 14,646 15,632 30,278
Box makers (paper) 3,796 17,302 21,098
Engravers 10,698 453 11,151
Paper and pulp mill operatives 26,904 9,424 36,328
Printers, lithographers, and pressmen 139,166 15,981 155,147
Textiles.
Bleachery and dye works operatives 20,493 1,785 22,278
Carpet factory operatives 10,371 9,001 19,372
Cotton mill operatives 125,788 120,603 246,391
Hosiery and knitting mill operatives 12,630 34,490 47,120
Silk mill operatives 22,023 32,437 54,460
Woolen mill operatives 42,566 30,630 73,196
Other textile mill operatives 53,437 51,182 104,619
Dressmakers 2,090 344,794 346,884
Hat and cap makers 15,110 7,623 22,733
Milliners 1,739 86,120 87,859
Seamstresses 4,837 146,105 150,942
Shirt, collar, and cuff makers 8,491 30,941 39,432
Tailors and tailoresses 160,714 68,935 229,649
Other textile workers 8,862 20,671 29,533
Miscellaneous industries.
Broom and brush makers 8,643 1,577 10,220
Charcoal, coke, and lime burners 14,405 31 14,436
Engineers and firemen (not locomotive) 223,318 177 223,495
Glovemakers 4,503 7,768 12,271
Manufacturers and officials, etc. 239,649 3,360 243,009
Model and pattern makers 14,869 204 15,073
Photographers 23,361 3,580 26,941
Rubber factory operatives 14,492 7,374 21,866
Tobacco and cigar factory operatives 87,955 43,497 131,452
Upholsterers 28,663 2,158 30,821
Other miscellaneous industries 380,167 90,922 471,089
Total manufacturing and mechanical pursuits 5,772,641 1,312,668 7,085,309
Grand total 23,753,836 5,319,397 29,073,233
OCCUPATION. 1900.
Male. Female.
AGRICULTURAL PURSUITS 9,404,429 977,336
PROFESSIONAL SERVICE 827,941 430,597
DOMESTIC AND PERSONAL SERVICE 3,485,208 2,095,449
TRADE AND TRANSPORTATION 4,263,617 503,347
MANUFACTURING AND MECHANICAL PURSUITS 5,772,641 1,312,668
Building trades.
Carpenters and joiners 599,707 545
Masons (brick and stone) 160,638 167
Painters, glaziers, and varnishers 275,782 1,759
Paper hangers 21,749 241
Plasterers 35,649 45
Plumbers and gas and steam fitters 97,659 126
Roofers and slaters 9,065 2
Mechanics (not otherwise specified) 9,351 27
Chemicals and allied products.
Oil well and oil works employes 24,573 53
Other chemical workers 12,035 2,688
Clay, glass, and stone products.
Brick and tile makers, etc. 49,455 478
Glassworkers 47,377 2,621
Marble and stone cutters 54,317 143
Potters 13,200 2,940
Fishing and mining.
Fishermen and oystermen 68,478 462
Miners and quarrymen 562,417 989
Food and kindred products.
Bakers 74,860 4,328
Butchers 112,815 378
Butter and cheese makers 18,593 648
Confectioners 21,980 9,214
Millers 40,362 186
Other food preparers 23,640 5,142
Iron and steel and their products.
Blacksmiths 226,284 193
Iron and steel workers 287,241 3,297
Machinists 282,574 571
Steam boiler makers 33,038 8
Stove, furnace, and grate makers 12,430 43
Tool and cutlery makers 27,376 746
Wheelwrights 13,495 10
Wireworkers 16,701 1,786
Leather and its finished products.
Boot and shoe makers and repairers 169,393 39,510
Harness and saddle makers and repairers 39,506 595
Leather curriers and tanners 40,917 1,754
Trunk and leather-case makers, etc. 5,472 1,579
Liquors and beverages.
Bottlers and soda water makers, etc. 9,725 794
Brewers and maltsters 20,687 275
Distillers and rectifiers 3,114 30
Lumber and its remanufactures.
Cabinetmakers 35,552 67
Coopers 37,087 113
Saw and planing mill employes 161,251 373
Other woodworkers 104,791 6,805
Metals and metal products other than iron and steel.
Brassworkers 25,870 890
Clock and watch makers and repairers 19,305 4,815
Gold and silver workers 19,732 6,380
Tin plate and tinware makers 68,730 1,775
Other metal workers 54,282 2,320
Paper and printing.
Bookbinders 14,646 15,632
Box makers (paper) 3,796 17,302
Engravers 10,698 453
Paper and pulp mill operatives 26,904 9,424
Printers, lithographers, and pressmen 139,166 15,981
Textiles.
Bleachery and dye works operatives 20,493 1,785
Carpet factory operatives 10,371 9,001
Cotton mill operatives 125,788 120,603
Hosiery and knitting mill operatives 12,630 34,490
Silk mill operatives 22,023 32,437
Woolen mill operatives 42,566 30,630
Other textile mill operatives 53,437 51,182
Dressmakers 2,090 344,794
Hat and cap makers 15,110 7,623
Milliners 1,739 86,120
Seamstresses 4,837 146,105
Shirt, collar, and cuff makers 8,491 30,941
Tailors and tailoresses 160,714 68,935
Other textile workers 8,862 20,671
Miscellaneous industries.
Broom and brush makers 8,643 1,577
Charcoal, coke, and lime burners 14,405 31
Engineers and firemen (not locomotive) 223,318 177
Glovemakers 4,503 7,768
Manufacturers and officials, etc. 239,649 3,360
Model and pattern makers 14,869 204
Photographers 23,361 3,580
Rubber factory operatives 14,492 7,374
Tobacco and cigar factory operatives 87,955 43,497
Upholsterers 28,663 2,158
Other miscellaneous industries 380,167 90,922
Total manufacturing and mechanical pursuits 5,772,641 1,312,668
Grand total 23,753,836 5,319,397
OCCUPATION. 1900.
Total.
AGRICULTURAL PURSUITS 10,381,765
PROFESSIONAL SERVICE 1,258,538
DOMESTIC AND PERSONAL SERVICE 5,580,657
TRADE AND TRANSPORTATION 4,766,964
MANUFACTURING AND MECHANICAL PURSUITS 7,085,309
Building trades.
Carpenters and joiners 600,252
Masons (brick and stone) 160,805
Painters, glaziers, and varnishers 277,541
Paper hangers 21,990
Plasterers 35,694
Plumbers and gas and steam fitters 97,785
Roofers and slaters 9,067
Mechanics (not otherwise specified) 9,378
Chemicals and allied products.
Oil well and oil works employes 24,626
Other chemical workers 14,723
Clay, glass, and stone products.
Brick and tile makers, etc. 49,933
Glassworkers 49,998
Marble and stone cutters 54,460
Potters 16,140
Fishing and mining.
Fishermen and oystermen 68,940
Miners and quarrymen 563,406
Food and kindred products.
Bakers 79,188
Butchers 113,193
Butter and cheese makers 19,241
Confectioners 31,194
Millers 40,548
Other food preparers 28,782
Iron and steel and their products.
Blacksmiths 226,477
Iron and steel workers 290,538
Machinists 283,145
Steam boiler makers 33,046
Stove, furnace, and grate makers 12,473
Tool and cutlery makers 28,122
Wheelwrights 13,505
Wireworkers 18,487
Leather and its finished products.
Boot and shoe makers and repairers 208,903
Harness and saddle makers and repairers 40,101
Leather curriers and tanners 42,671
Trunk and leather-case makers, etc. 7,051
Liquors and beverages.
Bottlers and soda water makers, etc. 10,519
Brewers and maltsters 20,962
Distillers and rectifiers 3,144
Lumber and its remanufactures.
Cabinetmakers 35,619
Coopers 37,200
Saw and planing mill employes 161,624
Other woodworkers 111,596
Metals and metal products other than iron and steel.
Brassworkers 26,760
Clock and watch makers and repairers 24,120
Gold and silver workers 26,112
Tin plate and tinware makers 70,505
Other metal workers 56,602
Paper and printing.
Bookbinders 30,278
Box makers (paper) 21,098
Engravers 11,151
Paper and pulp mill operatives 36,328
Printers, lithographers, and pressmen 155,147
Textiles.
Bleachery and dye works operatives 22,278
Carpet factory operatives 19,372
Cotton mill operatives 246,391
Hosiery and knitting mill operatives 47,120
Silk mill operatives 54,460
Woolen mill operatives 73,196
Other textile mill operatives 104,619
Dressmakers 346,884
Hat and cap makers 22,733
Milliners 87,859
Seamstresses 150,942
Shirt, collar, and cuff makers 39,432
Tailors and tailoresses 229,649
Other textile workers 29,533
Miscellaneous industries.
Broom and brush makers 10,220
Charcoal, coke, and lime burners 14,436
Engineers and firemen (not locomotive) 223,495
Glovemakers 12,271
Manufacturers and officials, etc. 243,009
Model and pattern makers 15,073
Photographers 26,941
Rubber factory operatives 21,866
Tobacco and cigar factory operatives 131,452
Upholsterers 30,821
Other miscellaneous industries 471,089
Total manufacturing and mechanical pursuits 7,085,309
Grand total 29,073,233
World’s Development of Carrying Power, Production, and Commerce, 1800-1907.
[From “Transportation Systems of the World,” issued by the Bureau of Statistics, Department of Commerce and Labor.]
Year. Population. Commerce. Carrying Power.
Total. Per capita. Sail. Steam. Total.
Millions. Millions of dollars. Dollars. Thousand tons.[JJ] Thousand tons.[JJ] Thousand tons.[JJ][KK]
1800[MM] 640 1,479 2.31 4,026 … 4,026
1820[NN] 780 1,659 2.13 5,814 0.023 5,894
1830[NN] 847 1,981 2.34 7,100 .111 7,528
1840[OO] 950 2,789 2.93 9,012 .372 10,482
1850[OO] 1,075 4,049 3.76 11,470 .864 14,902
1860[OO] 1,205 7,246 6.01 14,890 1.723 21,730
1870[PP] 1,310 10,663 8.14 12,900 3.012 25,100
1880[QQ] 1,439 14,761 10.26 14,400 5.901 37,900
1890[RR] 1,488 17,519 11.80 12,640 8.295 47,800
1900 1,543 20,105 13.02 8,119 13.856 63,543
1906 1,600 26,500 16.50 5,469 21.094 89,845
1907 … … … 5,200 22.140 93,760
Year. Railways. Telegraphs. Cables. Production of Cotton, Coal, and Pig iron.
Cotton. Coal. Pig iron.
Thousand miles.[JJ] Thousand miles. Thousand miles. Million pounds.[JJ] Million tons. Million tons.[JJ]
1800[MM] … … … 520 11.6 0.5
1820[NN] … … … 630 17.2 1.0
1830[NN] 0.2 … … 820 25.1 1.6
1840[OO] 5.4 … … 1,310 44.8 2.7
1850[OO] 24.0 5 1⁄40 1,435 81.4 4.4
1860[OO] 67.4 100 1½ 2,551 142.3 7.2
1870[PP] 139.9 281 151½ 2,775 213.4 11.9
1880[QQ] 224.9 440 491½ 3,601 340.0 18.1
1890[RR] 390.0 768 1321½ 5,600 466.0 25.2
1900 500.0 1,180 2001½ 6,247 800.0 41.4
Year. Population. Commerce.
Total. Per capita.
Millions. Millions of dollars. Dollars.
1800[MM] 640 1,479 2.31
1820[NN] 780 1,659 2.13
1830[NN] 847 1,981 2.34
1840[OO] 950 2,789 2.93
1850[OO] 1,075 4,049 3.76
1860[OO] 1,205 7,246 6.01
1870[PP] 1,310 10,663 8.14
1880[QQ] 1,439 14,761 10.26
1890[RR] 1,488 17,519 11.80
1900 1,543 20,105 13.02
1906 1,600 26,500 16.50
1907 … … …
Year. Carrying Power.
Sail. Steam. Total.
1800[MM] 4,026 … 4,026
1820[NN] 5,814 0.023 5,894
1830[NN] 7,100 .111 7,528
1840[OO] 9,012 .372 10,482
1850[OO] 11,470 .864 14,902
1860[OO] 14,890 1.723 21,730
1870[PP] 12,900 3.012 25,100
1880[QQ] 14,400 5.901 37,900
1890[RR] 12,640 8.295 47,800
1900 8,119 13.856 63,543
1906 5,469 21.094 89,845
1907 5,200 22.140 93,760
Year. Railways. Telegraphs. Cables.
Thousand miles.[JJ] Thousand miles. Thousand miles.
1800[MM] … … …
1820[NN] … … …
1830[NN] 0.2 … …
1840[OO] 5.4 … …
1850[OO] 24.0 5 1⁄40
1860[OO] 67.4 100 1½
1870[PP] 139.9 281 15.0
1880[QQ] 224.9 440 49.0
1890[RR] 390.0 768 132.0
1900 500.0 1,180 200.0
1906 [SS]562.8 1,200 200.0
1907 595.8 … …
Year. Production of Cotton, Coal, and Pig iron.
Cotton. Coal. Pig iron.
1800[MM] 520 11.6 0.5
1820[NN] 630 17.2 1.0
1830[NN] 820 25.1 1.6
1840[OO] 1,310 44.8 2.7
1850[OO] 1,435 81.4 4.4
1860[OO] 2,551 142.3 7.2
1870[PP] 2,775 213.4 11.9
1880[QQ] 3,601 340.0 18.1
1890[RR] 5,600 466.0 25.2
1900 6,247 800.0 41.4
Year. Area cultivated. Gold production, decade ending year named.
1800[MM] 360 128.5
1820[NN] 402 76.1
1830[NN] … 94.5
1840[OO] 492 134.8
1850[OO] … 363.9
1860[OO] 583 1,334.0
1870[PP] … 1,263.0
1880[QQ] 749 1,150.8
1890[RR] 807 1,060.1
1900 875 2,100.0
1906 900 3,095.0
1907 … 3,259.5
1. CAPITAL INVESTED IN MANUFACTURING AT EACH CENSUS: 1850 TO 1900

2. AVERAGE NUMBER OF WAGE-EARNERS EMPLOYED IN MANUFACTURES AT EACH CENSUS: 1850 TO 1900

3. VALUE OF PRODUCTS AT EACH CENSUS: 1850 TO 1900

4. PROPORTION WHICH AVERAGE NUMBER OF WAGE-EARNERS EMPLOYED IN MANUFACTURES BEAR TO POPULATION AT EACH CENSUS: 1850 TO 1900
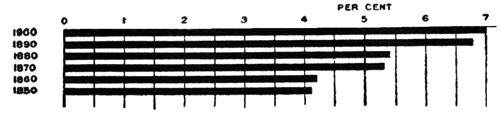
1. CAPITAL INVESTED IN MANUFACTURING IN EACH STATE AND TERRITORY: 1900
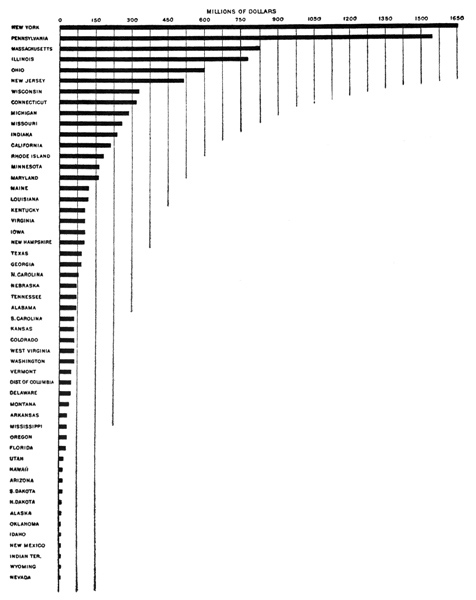
2. CAPITAL INVESTED BY STATE GROUPS
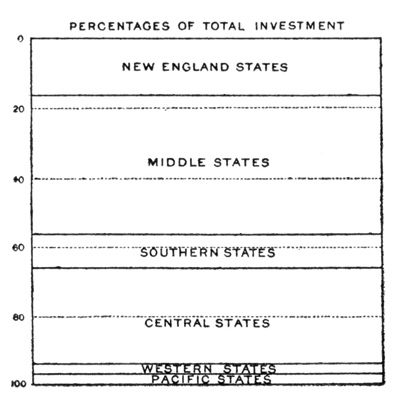
1. AVERAGE NUMBER OF WAGE-EARNERS EMPLOYED IN MANUFACTURES: 1900.
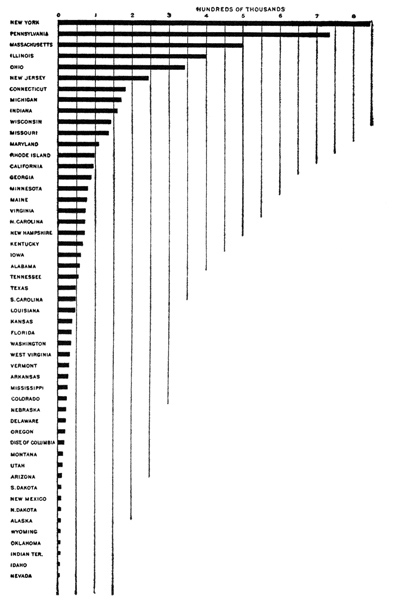
2. AVERAGE NUMBER OF WAGE EARNERS EMPLOYED IN MANUFACTURES BY STATE GROUPS
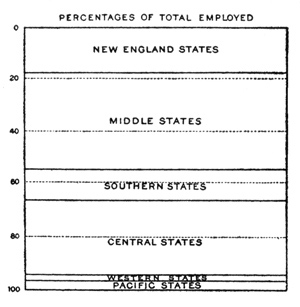
VALUE OF PRODUCTS OF CERTAIN MANUFACTURING INDUSTRIES: 1850 TO 1900
MILLIONS OF DOLLARS

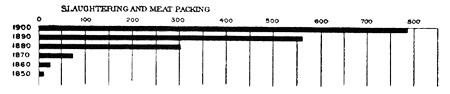
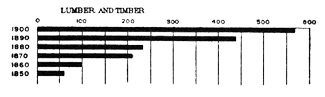
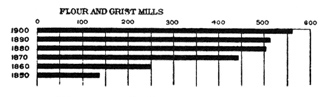
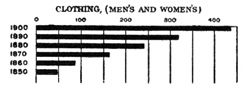
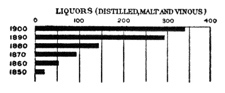
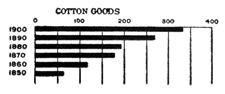
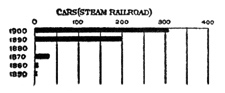
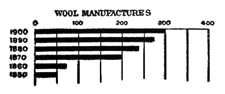
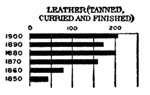
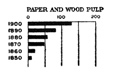
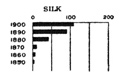
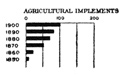
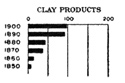
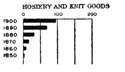
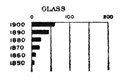
VALUE OF ALL MANUFACTURED PRODUCTS IN THE U. S., AND PROPORTIONAL VALUE OF EACH GROUP: 1880 TO 1900
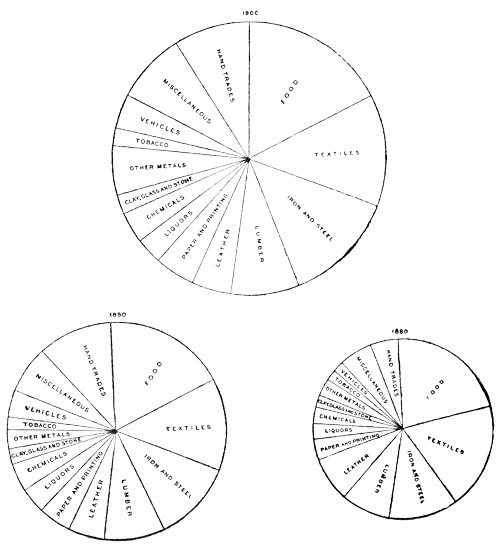
VALUE OF PRODUCTS OF MANUFACTURES PER SQUARE MILE: 1900
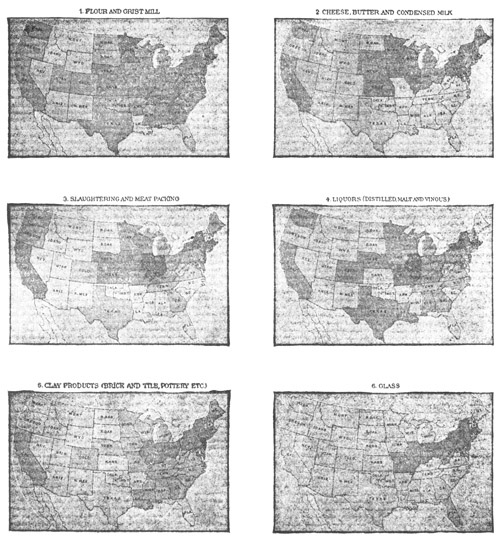
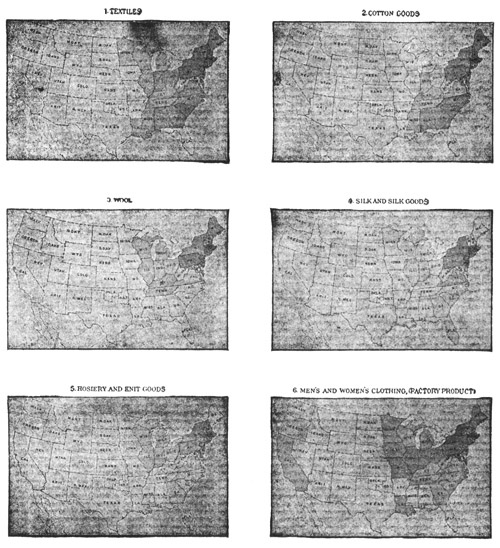
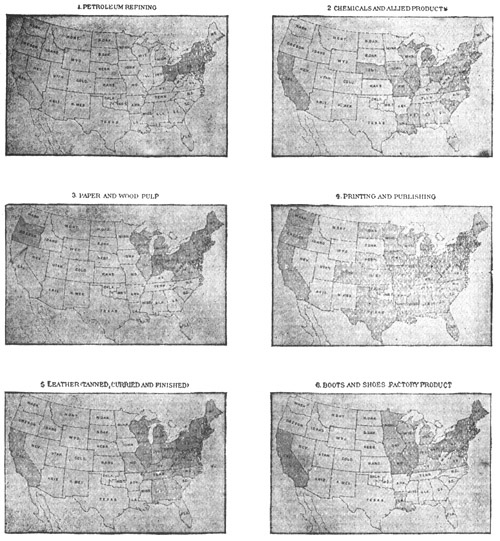
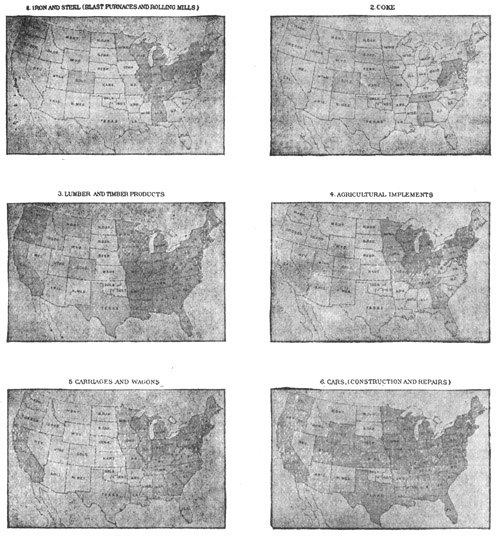

CONCRETE AND STEEL.
BY J. F. SPRINGER.
[New York author of articles in Applied Science.]
The life of properly made concrete is not known. However, specimens from the times of the Romans are yet in good condition. This material has very considerable ability to resist compression; it is practically fireproof and teredo proof; when properly protected it is probably but little deteriorated by weather changes; and, if properly made, it is probably inappreciably subject to chemical disintegration when submerged. But there is one palpable fault—it is weak when subjected to tensile stresses. On the other hand—steel has great tensile resistivity and is strong under transverse stress. These two materials—concrete and steel—supplement each other in valuable qualities. The possibility of using them in combination depends largely upon the fact that their co-efficients of expansion are practically the same for moderate thermal fluctuations. Steel is easily corroded. Nor is it strictly fireproof, as temperatures which are not excessive will induce bending and buckling. When it is surrounded by concrete, steel is protected against both fire and corrosion.
In many situations, steel would not alone supply the best material of construction. And the same remark applies to concrete. A striking instance is the case of the six new docks in Baltimore. Three of these had already been constructed of wood and stone, when it became evident that the building of the remaining three and of the long bulkhead which was part of the scheme along the same lines would entail a larger expense than the use of reinforced concrete construction. Steel by itself would have been impossible of consideration because of its susceptibility to corrosion. Concrete alone could not be used because of the excessive cost of the increased amount of Portland cement. It is said, that a retaining wall of all concrete would have cost about $600 per linear foot. Reinforced concrete costs about $58 per foot.
Steel is used, not merely as a reinforcement, but as the material of forms. Used thus, it may, at times, not only retain the concrete in position but also prevent the action of the surrounding soil or water. The possibility of using steel for forms depends largely upon the fact that many applications of concrete are becoming standardized rapidly. Thus is permitted a re-use of the steel form that justifies the expense. But the employment of steel forms sometimes involves the use of steel in the handling of them. A further use, although perhaps more remote, is in connection with the arrangements for the handling of the mixed concrete and of the raw materials. Still more remote, but still a necessary application, is the use of steel and iron in the crushing mills and the like. When we look at the question and inform ourselves of the ramifications, it is not difficult to see that concrete and steel are materials whose engineering applications are mutually involved. Concrete is certainly replacing steel in some applications. But, notwithstanding this, these two are to be regarded as unopposed to each other on the whole.
When concrete is cast about steel, an adhesive bond ensues. But this is scarcely to be regarded as sufficient to enable the two to act as one under tensile stresses. A mechanical bond should be employed. This is the explanation of the somewhat complicated forms of standard reinforcement bars.
Concrete properly reinforced is an admirable material for factory construction. It permits of rapid erection, is fireproof, has a long life, is adapted to weather conditions, and is economical. The floors of concrete buildings are easily cleaned and do not develop splinters.
One of the large automobile factories—that of the Geo. N. Pierce Company at Buffalo, N. Y.—is a good instance of the rapidity with which reinforced concrete buildings may be erected. Within seven months of the date of signing the contract with the Trussed Concrete Steel Company, Detroit, Mich., which employs the Kahn system of reinforcement, certain large structures were ready for use. The floor space here is 325,000 square feet. It was necessary to provide a number of large areas unbroken by supports. It was found possible to use girders having spans of 55 and 61 feet. When subjected to a load, a girder develops compressive strains above and tensile ones below. The concrete is well adapted to withstand the one, but not the other. In an ordinary bridge truss, there may be diagonals that are also under tensile stress. In the Kahn system of reinforcement, a horizontal bar from which rigidly attached diagonals extend upward and outward is provided with a view of enabling the girder to withstand the tensile stress. In accordance with this design the long girders were constructed. Girders providing runways for 3-ton cranes were also constructed. A load of 14 tons placed upon one of the reinforced concrete girders having a span of 25 feet induced a deflection of only 1⁄16 inch. This girder is 12 inches wide and 22 inches deep and its reinforcement consists of three 1 x 3 in. Kahn bars. Hollow tile was largely employed here in connection with the concrete.
What is known in the trade as the corrugated bar, supplied by the Corrugated Steel Bar Company is a steel reinforcing rod which provides shoulders by means of which the concrete is mechanically engaged. This general type of reinforcement is, however, not confined to this concern. By means of this style of bar, the engineer is able to secure the desired mechanical interlock. As the concrete and steel expand and contract they do so together—unless the temperature change is excessive—and so the relation between the two is maintained. Such standard types of reinforcing bars are applicable to multitudes of construction. An interesting example is the railroad bridge over the Vermilion River near Danville, Illinois. There are three arches, the central one of which has a span of 100 feet. About 130 tons of corrugated bars were employed in the construction of this beautiful bridge.
Another good example of bridge construction is the bridge over the Maumee River near Waterville, Ohio. This structure follows the designs of the National Bridge Company. It has a width of 16 feet between copings and crosses the river at a point where it is 1,000 feet wide. It is said that this reinforced bridge will carry a load of 5 tons per linear foot. The arches are 12 in number, the longest having a span of 90 feet, and the shortest, one of 75 feet. The loading of a bridge arch produces a lateral thrust upon the piers. If the next arch is not loaded, then this thrust is unbalanced and must be cared for. This was done in this case by employing part of the 100 tons of reinforcement in a vertical position. This bridge having a very long expectation of life was built at a cost of $77,000. The total amount of concrete was about 9,200 cubic yards.
The city of Philadelphia has gone into the construction of city bridges of concrete in rather an extensive way. Among a total of 30 or more is the reinforced bridge across Poquessing Creek, having a span of 71 feet. This bridge is rather flat, having a rise of but 9½ feet. The reinforcement employed here consisted in part of angle bars placed in pairs to form a kind of T-bar. The principal reinforcement here was the arch ribs. These were each composed of two of the T-bars arranged one above the other in such manner that their points of nearest approach were at the crown. These were latticed together. Such ribs were placed 4 feet apart. Transversely disposed steel rods held the whole together. The mechanical interlock here depended upon was due, no doubt, to the mutual disposition of the various rods, etc.
A railway viaduct, one-half mile or more in length is another example of the Kahn methods. This structure belongs to the Richmond & Chesapeake Railway and is located at Richmond, Va. There is a span of 70 feet which has girders nearly 6 feet deep. At another span the girders, probably of about the same depth, sagged but ⅛ inch upon removal of the falsework.
A style of reinforcement much used consists of a net-like fabric of metal. This is employed largely in floors to bind the whole mass together. In the manufacture of this netting, a Canadian company has found it desirable to repair the inevitable breakages of strands in manufacture by the use of the Davis-Bournonville Company’s oxyacetylene torch. It is said that welds can be made on the average of one in two minutes in the case of an ordinary weight of the fabric. This netting is made by expanding sheets of perforated metal from a narrow to a considerable width. It is during this expansion that the strands sometimes break.
Another style of floor reinforcement is the fabric made from wire. That floors properly reinforced are quite substantial may be judged from the case of the United States Fidelity & Guarantee Company. Their building in Baltimore was exposed to intense heat in the great fire of 1904. In fact, a considerable part of the side walls and the front fell, leaving floors of concrete. A load of brick giving a pressure of 300 pounds per square foot was arranged on one of the floors to a distance of 5 feet to each side of one of the girders. The deflection amounted to ⅛ inch. This was about 1⁄20 of 1 per cent of the span. This is an example of Hennibique construction.
Reference has already been made to the Kahn truss reinforcement. With the same general object in view, the Hennibique truss has been designed. There are two horizontal bars, one above the other. The upper is, however, not perfectly horizontal except near the center. Towards either side, this bar rises as it recedes from the center. These two bars are enveloped by loose stirrups arranged vertically and at intervals. These are open at the top and closed below.
There are two varieties of piles—the bearing pile and the sheet pile. Their duties are quite different. One sustains a compressive load, the other withstands a transverse thrust. But concrete has been used for both kinds. In the case of the bearing pile, its own intrinsic qualities are eminently suitable. It has good compressive resistance; it is teredo proof, and has the prospect of long life whether conditions are wet, dry or a mixture of the two. Wood makes an admirable bearing pile, if constantly submerged, but it is a prey to the teredo. The necessity for constant submergence limits the usefulness of the wood pile. It must be cut off below the hydraulic level, and this necessitates carrying the foundation footings to a lower level than would otherwise ordinarily be the case. With the concrete bearing pile, on the contrary, the footings may be constructed at any level desired as the pile itself may be partly submerged and partly in the dry. However, the concrete pile may be subjected to other than compressive stresses, especially during its placement. And so, some reinforce it. Some, no doubt, have in view a possible buckling when in the ground, particularly if the surrounding soil is yielding. Reinforcement both longitudinal and transverse is employed. Longitudinal bars are arranged at intervals around and within the periphery. These may be bound together by separate hoops disposed along the length or by wire wound about the longitudinals in spirals. In the case of concrete sheet piling, the concrete supplies a surface and forms a protective covering to the imbedded reinforcement which is here a vital matter and consequently indispensable. In the dock improvements at Baltimore, to which reference has already been made, reinforced concrete sheet piling was largely used. The steel sheet pile could not well have been used here because of its susceptibility to corrosion. The concrete slabs, 12 × 18 inches in cross-section perform the duty of retaining masses of earth in place both above and below the water line. There were certain other concrete constructional elements of an auxiliary character. The total reinforcement amounted to about 1,200 tons.
With regard to its fireproof qualities, an eloquent testimonial arises from the fact that the immense Marlborough-Blenheim Hotel at Atlantic City, a concrete and tile structure, is said to enjoy a saving of $18,000 per year in fire insurance premiums. The insurance is based on $600,000. This structure is 560 feet in length and has a width varying from 60 to 200 feet.
Reference has been made to the close identity of the co-efficients of expansion for steel and concrete for moderate intervals of temperature. While this is so, if the thermal range is considerable, the concrete and the steel cannot be expected to expand and contract together. In most engineering construction, the range is small, say 150 degrees F., but there are exceptions. One of these relates to the material used in tall chimneys. The hot gases which pass up these give rise to rather high temperatures. In fact, it is well-recognized practice to build a large part of such chimneys double, one shell enveloping another, with an air space between. Some four or five years ago what is, perhaps, the very tallest concrete chimney in the United States was built for the Colusa Parrot Mining & Smelting Company, Butte, Montana. It is 352½ feet high and has a flue 18 feet in diameter. A solid wall 1½ feet thick constitutes the base of 21 feet in height. Above this level, an air space 4 inches wide radially is arranged between two shells of 5 and 9 inches thick. The inner one is the thinner. The steel reinforcements used were T-bars. The footing is of reinforced concrete and rests upon a fill 18 feet deep. A further important factor which has to be considered is the serious effect of repeated stresses. Partly because of this, it is recommended that a large factor of safety be adopted. Further, the best practice would seem to be in the direction of a complete divorce between the inner and outer shells all the way up and of a uniformity in wall thickness from bottom to top. Vertical cracks have been noted in some chimneys. This would indicate the advisability of strong circular reinforcement. It is thought that a tone concrete following the formula 1:2:2 is better for the outer shell than a cement mortar. It is said to be stronger, denser and more impervious to water than a mortar following the formula 1:3. In order to secure adhesion between layers, the fresh concrete should be applied wet and the old should perhaps be resurfaced by tooling.
The compressive resistivity of the usual concretes is considerable. However, in certain bridge construction in New York City, a need was felt for a concrete which should have a very high compressive resistance. And so experiments were made with a concrete formed by substituting wire nails for the crushed stone. About 60 tests were made with concrete following the formula 1:2:2⅔. The resulting material was quite heavy. A cubic foot weighed 196 pounds as compared with 130 to 160 pounds for ordinary concretes. Eighty-eight pounds of nails were used in one cubic foot bringing the cost to about $2.30. This was certainly very expensive material. But where extraordinary qualities are desired, we have to spend money. Cubes were cast measuring 6 inches on a side. These were tested to destruction at different stages of maturity. After the lapse of one week, the lowest crushing resistance obtained was 2,770 pounds per square inch and the highest 3,330 pounds. After one month, the minimum crushing strength was 3,050 pounds, the maximum 8,340 pounds, while the average was 5,645 pounds. When a year had gone by, it was found that four cubes gave an average of 10,410 pounds. However, the average resistance of 17,235 pounds was obtained in the case of cubes 15 months old.
Since concrete is but little affected by water and by fluctuations between wet and dry conditions, it is not at all remarkable that it has been employed for sewer and water tower construction. In the United States a high standpipe has been constructed at Attleboro, Massachusetts. This is 118 feet high and has an internal diameter of 50 feet. The wall varies from 18 inches in thickness at the bottom to 8 inches at the top. The concrete was made according to the formula 1:2:4. There is another tower 110 feet high and having an external diameter of about 35 feet. At Anaheim, California, a large tank together with its substructure has been constructed entirely of reinforced concrete. The floor of the tank is about 60 feet above the surface. The tank itself is 38 feet in height and 30 feet in diameter and has a wall varying in thickness from 5 to 3 inches. The reinforcement employed was the twisted steel bar.
In order to prevent corrosion of the reinforcement, it is thought necessary to guard against water entering and dissolving away the caustic lime contacting with the steel. One way would be to give the concrete itself a very dense character. Another is to fill the external pores with a bituminous or oleo-resinous paint. Or, an insoluble substance suited to fill the pores may be one of the ingredients when the concrete is mixed. Finally a flexible waterproof coating may be employed where conditions permit. As to the steel itself—it is desirable to have it uniform, as then reliance may be placed upon calculations. For this reason, one of the great concrete construction companies recommends mild steel as opposed to high carbon steel.
One of the great recommendations of concrete is that it permits wonderful rapidity of construction. We had an example of this in the case of the Geo. N. Pierce automobile factory. Another was in connection with the construction of junction caissons for certain subsurface tubes of the tunnel of the Hudson Companies. These caissons were three in number and were located on the Jersey shore opposite New York City. These structures were quite large, being about 100 feet in length and having a width of about 45 feet. These caissons, one or two of which were put under air pressure, were constructed of concrete with steel reinforcement. The use of concrete in the tunnel system and in the Terminal Building has been very extensive. To complete the concrete construction, about half a million barrels of Portland cement, so it is thought, must be consumed. The Gatun Locks at Panama will require only about four times this amount. The twisted steel bars of the reinforcement have been used in large quantity.
The work on the water front at Baltimore to which reference has already been made involved a considerable variety of reinforced concrete construction. For retaining walls sheet piles were employed. These ordinarily had a face of 18 inches and a thickness of 12 inches and a length of 27 feet. As it was not necessary to retain the soil by an impervious bulkhead, these piles did not interlock. However, they had to resist a horizontal thrust, and so wales were strung along the outside at the top. These wales were themselves of concrete reinforced by means of imbedded lattice girders of steel. In position, the girders lay flat and thus gave their chief strength to the horizontal thrust. The wales were supported, in part, by concrete piers. These were placed by means of steel caissons. These cofferdams were of sheet steel 27 feet deep and were sunk by open air methods. When in place, the concrete was put in and the pier thus formed. An upward surface of the pier provides a means of absorbing the horizontal thrust of the wales. The piers themselves are, some of them, mutually tied together across the dock; others are tied to reinforced concrete piles sunk in the body of the dock. The ties are themselves of reinforced concrete. The steel of the caissons served only as a mold. It is now a matter apparently of but little importance how soon it corrodes. The extensive concrete work at Baltimore was done by the Raymond Concrete Pile Company.
While the question of the teredo seems to have been a factor at Baltimore because of the probability of its presence in the harbor when certain sewerage improvements are carried out, this matter was really an insistent thing in connection with a wharf constructed by the United Fruit Company at Bocas del Toro in the Republic of Panama. This wharf is itself of reinforced concrete. But the bearing piles are what interest us. The native wooden piling, so it seems, would at this general location become seriously damaged by the teredo within a year. Some kinds of timber might be expected to have a longer life. The service of creosoted piles has been estimated as about 15 years. Besides, piles 70 feet in length were desired. This requirement put the ordinary reinforced concrete piles out of consideration. What was actually done was to use an untreated timber pile and then to encase it where it passed through the water in a reinforced concrete shell. This shell was made of such size as to allow a space between it and the enclosed wooden pile. A rich concrete was put in this space at the bottom and thus excluded the external water. Upon pumping out the retained water, the major portion of the space was filled with a lean concrete and a top layer of rich concrete then added in which the column reinforcement was placed. The steel used for reinforcement was in the main round bars of mild steel. The piles averaged 58 feet in length; the shells, 18.4 feet. The cost of these shells was $1.78 per linear foot. It is said that the cost of the untreated wooden pile together with its protective coating was not greater than what would have been the expense for a creosoted pile.
At both the Baltimore docks and the wharf in the tropics, concrete is exposed to the action of sea water. But there is no violence in this action. However, a very large application of concrete construction has been recently carried out in a very much exposed maritime situation off the coast of Florida. It is 156 miles from the mainland to the island of Key West. Scattered along this interval are a number of islands, so that in reality the total linear amount of intervening land is about one-half the distance. Some of the water passages are only a few hundred feet in width; one is about 2½ miles wide. The greater portion of the aqueous route is of a shallow depth. But for about 6 miles the water reached depths up to 30 feet; and this in connection with an exposed situation. Reinforced concrete viaducts have been built to accommodate trains and resist the storms. A quarter million barrels of cement and about 5,700 tons of steel went into these works.
The viaduct from Long Key is 2 miles long and passed through water having a depth ranging from 13 to 20 feet. The floor of the Gulf is of coral. To construct a pier, about 30 piles would be driven in with their tops projecting up from the floor. A cofferdam would be sunk to include them and a seal of concrete 1 yard thick be placed. The water could now be pumped out and the form concreted. The reinforcement would, of course, be put in place before depositing this concrete. The pier would then be allowed 3 weeks to mature. The concrete was mixed with fresh water to avoid the effect of sea water on the steel. Corrugated bars were used in reinforcing the walls and the 184 arches. High water is 31 feet below the top of this structure, so that the track is well protected from the waves.
It may surprise some, but concrete has actually been used as the chief material in the construction of boats. A reinforced concrete boat was built thirteen years ago for use on the River Tiber in Italy. Not only the hull but posts and roof of the structure above deck were of concrete. This house boat was 67 by 21 feet. Another Italian boat is the Liguria, a barge in actual service. It is 57 by 18 feet and is rated at 150 tons. The Gretchen is an American example of the stone boat. She has sailed over long distances on the Atlantic and was reputed as comparatively a rapid sailer in a heavy sea. Her reinforcement was a multitude of small rods. This boat drew 14 feet of water and was 65 feet long and had a beam measurement of 16 feet.
Concrete is an obvious material for coal pockets, especially because of its fireproof character. A further advantage is the avoidance of a large maintenance charge. At Charlestown (Boston), the Lehigh & Wilkes-Barre Coal Company had been expending about $1,000 yearly on repairs upon a coal pocket. This has now been replaced by a concrete structure having a capacity of 10,000 tons. It has a depth of 24 feet, and has a length of 182 feet and a width of 92 feet. It is founded upon 750 Simplex concrete piles. If wooden piling had been used, the amount of excavation thus necessitated would have been very considerable because it would have been necessary to cut them off 10 feet below the surface in conformity with the building laws. Moreover, about 2,000 wooden piles would have been required because of the limit of ten tons’ bearing capacity per pile. With the concrete piles, however, the footings for the columns were constructed with but little excavation. The columns, side walls, girders, beams, floors—pretty much everything except the roof—were of reinforced concrete. When a full load of coal is filled in on the floor, the weight per square yard is 18 tons.
A similar application is to the construction of grain elevators. Reinforced concrete has been used at Baltimore in two important buildings of this kind and also in the case of a third at Buffalo. The question of fire is here very important. The grain elevator of the Pennsylvania Railroad at Baltimore is the largest of the three and is constructed to hold 1,000,000 bushels. There are 53 cylindrical bins having a common height of 79 feet. There are four rows of eight each. The remaining twenty-one bins occupy spaces in between, three rows seven in a row. The set of 32 have the larger size and measure 24.2 feet in internal diameter. The walls are 8 inches thick and have both vertical and circumferential reinforcement. The vertical reinforcement is round bars of 1⅜-inch diameter. The circumferential reinforcement consists of interlaced flat bars. By a patented device the bins were cast in sections. This mold would be attached to the heavier vertical reinforcement and jacked up as needed.
It is unnecessary to emphasize the fact that concrete while economical is not cheap. So that when large masses are used, it is advisable to reduce the expense by using what may be called “pudding stones.” At McCalls Ferry a large dam and adjoining power house span the Susquehanna River. This is a tremendous application of concrete. However, pudding stones were very properly employed in the construction of the great dam. Here steel was employed not so much to reinforce but to supply frames for the molding surfaces. Great pelican cranes of steel were also employed to handle the concrete, etc. The face of the dam is a double curve and thus required a precise mold. Sections of the dam, 40 feet in length, would be constructed to alternate with open spaces of the same length. When it was desired to close such open spaces, a great steel apron would be let down on the upstream face. Concrete could then be laid in the open space.