COTTON CROP CONDITION 70.8 PER CENT NORMAL Loss Amounts to 0.4 Per Cent During Past Months—Total Output Estimated at 11,449,000 Bales.
Reading edition
The condition of the cotton crop on July 25 was 70.8% of normal, according to the estimate made by the U. S. Department of Agriculture on Aug. 1. Compared with the condition of 71.2% on June 25, this shows a decrease in condition of 0.4% for the month. The average condition of the cotton crop on July 25 for the past 10 years stands at 73% of normal.
A condition of 70.8% of normal on July 25 this year forecasts a yield per acre of about 157.2 lbs. and a total production of about 11,449,000 bales of 500 lbs. gross weight each. The final outturn may be larger or smaller than this amount, of course, depending upon whether or not the conditions that develop during the remainder of the season prove more or less favorable to the crop than such conditions ordinarily prove.
Condition of the Cotton Crop on July 25, with Comparisons.
[100 = normal.]
State. July 25. June 25, 1922. July 25, 1922. Change, June 25 to July 25.
10‒yr. av. 1920 1921 10 yr. av. 1922
Virginia 81 74 82 85 80 0 ‒5
North Carolina 77 77 75 76 78 ‒1 +2
South Carolina 73 77 62 60 60 ‒2 0
Georgia 71 68 59 58 54 ‒3 ‒4
Florida 71 64 60 75 65 ‒5 ‒10
Alabama 69 67 58 68 70 ‒5 +2
Mississippi 72 71 68 76 74 ‒4 ‒2
Louisiana 70 71 59 69 70 ‒7 +1
Texas 72 74 62 72 72 ‒6 0
Arkansas 76 78 76 80 81 ‒3 +1
Tennessee 78 76 75 83 85 0 +2
Missouri 80 81 80 92 90 0 ‒2
Oklahoma 77 85 68 76 75 ‒2 ‒1
California 95 85 83 91 95 +2 +4
New Mexico 85 88 85 85 0
United States 73.0 74.1 64.7 71.2 70.8 ‒3.9 ‒0.4
Last year the production was 7,953,641 bales, two years ago 13,439,603 bales, three 106years ago 11,420,763 bales, four years ago 12,040,532 bales, and five years ago 11,302,375 bales.
The 1922 acreage of Egyptian type cotton is estimated at 80,000 acres in Arizona and less than 1,000 acres in California. In 1921 Arizona had 75,000 acres and California 9,000 acres, while in 1920 the estimate for Arizona was 200,000 acres and for California 45,000 acres.
The department’s estimate of cotton acreage in cultivation on June 25, which was made public on July 3, remains unchanged at 34,852,000 acres because the acreage abandoned before that date was excluded. A great decrease in cotton acreage followed the high acreage of 1920, which was 37,043,000 acres, because of the disastrous break in prices to growers in that year.
The accompanying table gives detailed information on the condition of the cotton crop on July 25, by States, together with comparisons.
Paradox in Forecast Yield of Crop per Acre as Indicated by Condition.
A crop may deteriorate in condition during a growing month and yet its yield per acre as forecast by a computation based on the lowered condition may increase. In the average of crop experiences during the growing period a certain crop declines in condition during a certain month by a certain percentage of a normal condition.
For instance, the cotton crop has a record of a deterioration of 3.9% of a normal condition from June 25 to July 25 in the average of the last 10 years. As a matter of fact, however, during this period in 1922 the deterioration in the condition of the cotton crop was only 0.4%. This is clearly a relative improvement because it is less than the usual deterioration of 3.9%. Hence the yield per acre in the forecast for July 25 must be greater than in the forecast made a month earlier, notwithstanding the absolute decline in condition.
Apple-tree tent caterpillars are very numerous in New England and New York this year. Farther south these pests are noticeably less numerous than usual.
Report on Cabbage, Celery, and Onions in Michigan.
Reports from the field service of the U. S. Department of Agriculture for the date of July 25 concerning commercial cabbage, celery, and onions in Michigan contain the following information:
Cabbage.—Five counties in southern Michigan have about 1,285 acres of commercial cabbage compared with last year’s area of 590 acres, or an increase of 118%. The counties and their cabbage areas are: Ingham 160 acres, Eaton 225 acres, Jackson 67 acres, Hillsdale 233 acres, and Branch 600 acres. The principal increases over 1921 are in Hillsdale and Branch Counties. The crop is generally in excellent condition.
In Hillsdale County, Jonesville has 200 acres, of which 130 acres are under contract; Mosherville has 13 acres for kraut; and Litchfield has 20 acres. In Branch County, Quincy has approximately 250 acres of commercial cabbage, of which 170 acres are under contract: and Coldwater has about 350 acres, with 60% under contract. The kraut plant in Coldwater will be in operation this year. Baroda, in Berrien County, has 60 acres of cabbage and Niles, in the same county, 40 acres for kraut.
In northern Michigan, Saginaw County has 1,400 acres of commercial cabbage, 300 acres of which are under contract.
Celery.—The combined area of commercial celery in Lenawee, Cass, Allegan, and Kent counties is 1,005 acres, an increase of 450 acres over 1921. Lenawee County has 117 acres, Cass 118 acres, Allegan 170 acres, and Kent 600 acres. The crop is in excellent condition.
Onions.—Allegan County has about 603 acres of commercial onions, or 88% more than in 1921. The Gull Swamp section (Martin, Gull Plain, Shelbyville, Hooper) has approximately 550 acres. Other acreages are: Wayland 8 acres, Dorr 25 acres, Herps 20 acres. The condition of the crop in Allegan County is above average. Kent County has an onion acreage about the same as last year’s.
Florida watermelons were widely distributed this season. Some shipments went as far as San Francisco, Portland, Seattle, Vancouver, B. C., and other Canadian points.
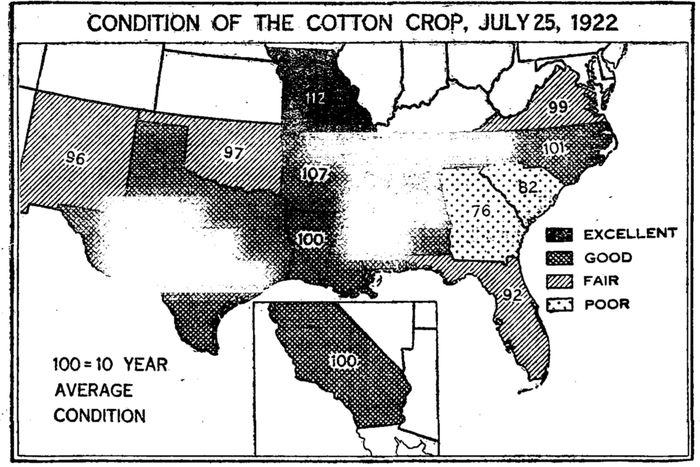
CONDITION OF THE COTTON CROP, JULY 25, 1922
INTERMEDIATE ONION CROP ESTIMATED AT 6,753 CARS Early and Intermediate Crops Forecast at 13,605 Cars—Acreage Increased in Late States.
The production of commercial onions in the seven intermediate shipping States is forecast at 6,753 cars of 500 bus. each, compared with a production in 1921 of 4,472 cars, according to estimates of the U. S. Department of Agriculture for July 15. These intermediate States are: New Jersey, Maryland, Virginia, Kentucky, Iowa, Texas, and Washington.
New Jersey leads the intermediate States with an indicated production of 1.613 cars, and following in order are Washington with 1,566 cars, Texas with 1,092 cars, Iowa with 1,062 cars, Kentucky with 600 cars, Virginia, with 560 cars, and Maryland with 260 cars.
The commercial onion crop in the intermediate and early States combined is forecast at 13,605 cars, each car of the early crop containing 530 bus. and of the intermediate crop 500 bus. In 1921 the harvest of early and intermediate onions totaled 10,287 cars.
About 38,000 acres have been planted to late commercial onions, compared with about 35,000 acres in 1921, according to the department’s estimates. The condition of the late commercial onion crop was 83% of normal on July 15. This condition is about average.
The accompanying tables give detailed information, by States, on the early and intermediate crops and the late crop.
Acreage and Forecast of Production of Commercial Onions in Intermediate and Early States.
State. Acreage. Yield per acre. Production.
Harvested, 1921 Planted, 1922 Average, 1921 Indicated, 1922 Harvested, 1921 Forecast, 1922
Iowa 1,200 1,600 202 332 485 1,082
Ky. 1,000 1,000 324 300 648 600
Md. 500 500 250 260 250 260
N.J. 2,400 2,400 239 336 1,147 1,613
Tex. 1,000 1,500 275 304 550 1,092
Va. 800 1,000 280 280 448 560
Wash. 1,300 1,500 363 522 944 1,566
Total intermediate States 8,200 9,500 273 355 4,472 6,733
Early States previously reported[3] 13,500 16,000 228 227 5,815 6,852
Total, intermediate and early States 21,700 25,500 245 275 10,287 13,605
Acreage and Condition of Commercial Onions in Late States.
State. Acreage. Condition (100=normal).
Harvested, 1921. Planted, 1922. July 1, 7‒yr. av. July 1, 1921. June 1, 1922. July 1, 1922. July 15, 1922.
Acres. Acres. P.ct. P.ct. P.ct. P.ct. P.ct.
Calif., central dist. 7,800 6,500 90 89 100 90 95
Colo. 800 1,500 80 91 90 88 91
Idaho. 100 300 89 94 88 94 98
Ill. 1,100 1,300 89 79 75 82 79
Ind. 3,698 1,600 78 73 77 73 83
Mass. 4,500 4,600 83 73 78 79 75
Mich. 1,300 1,700 79 65 86 89 88
Minn. 1,300 1,300 88 89 85 95 90
N. Y. 7,300 8,300 75 78 86 74 68
Ohio 5,100 5,800 79 73 98 88 88
Oreg. 900 900 78 80 100 73 79
Pa. 300 400 81 93 100 95 95
Utah 100 100 93 94 96 91 90
Wis. 1,000 1,000 81 82 96 90 86
Total 35,200 38,300 82 80 89 82 83
107