HOW AND WHERE TO USE IT
Reading edition
In a Physics Laboratory
The Problem
You are a physicist investigating the properties of semiconductors, which are materials used to make transistors. When you apply a voltage to one specimen of silicon (a semiconductor), it doesn’t behave quite like the others that you’ve studied. The electrical properties of this odd specimen are unusual and interesting and could lead to a new type of transistor. What makes this specimen different from the others? Very small amounts of impurities can cause large changes in the electrical properties of semiconductors. You would like to obtain a chemical analysis of the material, but your colleagues in chemistry tell you they would have to dissolve a good size part of your sample to analyze it and you are reluctant to give it up. How do you do it?
The Solution
You decide to try neutron activation analysis. You realize you won’t be able to detect all the elements, but many of those that might affect semiconductor performance could be detected quite easily.
What will you need? A source of neutrons to activate the material and a gamma-ray spectrometer to measure the radiation from the material afterwards. This spectrometer detects and measures gamma rays and sorts them according to their energy. You find that your friend down the hall, who is a nuclear physicist, has a gamma-ray spectrometer that incorporates a lithium-drifted germanium crystal as a detector 20 and a pulse height analyzer. The germanium detector is a device that senses the gamma rays that enter it and gives electrical signals related to the energy of the gamma rays. It was invented only a few years ago and has a very fine resolution. That is, it can easily “pick out” gamma rays that are only slightly different in energy. For example, for gamma rays with energies of approximately 1 MeV (million electron volts), it is not unusual to distinguish between gamma rays that differ by only 2 or 3 tenths of a percent. The pulse height analyzer is an electronic device that sorts the electrical pulses from the detector according to their energy.
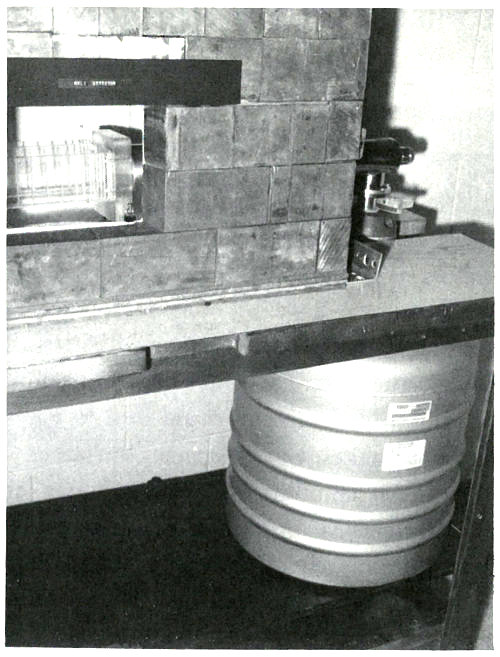
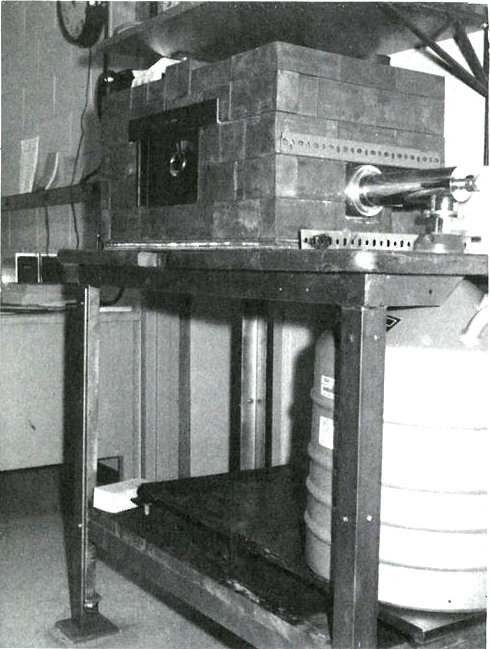
A lithium-drifted germanium-crystal gamma-ray detector. The large container is a reservoir of liquid nitrogen that keeps the detector cooled to a temperature of -196° Centigrade (321° below zero, Fahrenheit). The lead brick shield keeps out most of the gamma rays that come from naturally radioactive materials in the room. The plastic slots hold cards upon which the samples are mounted for counting. Sometimes the detector is arranged vertically and samples are placed on shelves above it.
21
What about the neutrons for the irradiation? Although there isn’t a suitable nuclear reactor[9] in your city, there is one at a university only an hour away by jet. Since it may take a few hours to get the sample to the counter after irradiation, you won’t be able to look for short-lived 22 activation products, i.e., those with half-lives of up to an hour. However, this will exclude only a few elements from detection.
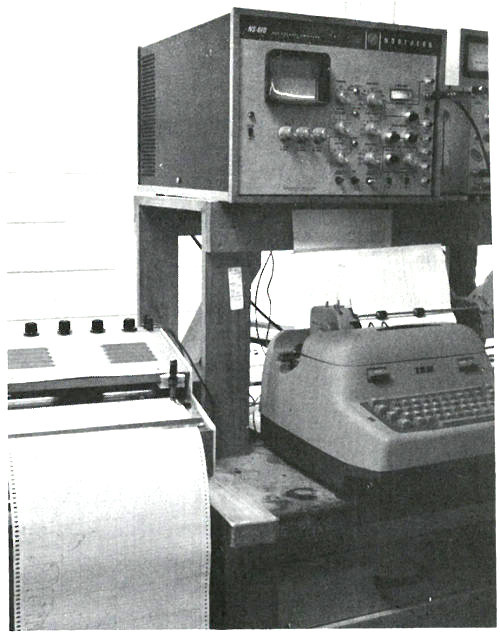
A pulse-height analyzer used for gamma-ray spectrometry. A gamma-ray spectrum is displayed on the television screen. Data is printed out automatically on the electric typewriter and also may be plotted as a graph on the paper to the left. In other systems, data may be coded onto punched paper tape as well. Such tape may be “read” by a computer that can be programmed to use the data to calculate what radioactive isotopes are present and their quantities.
Now you are ready to begin the analysis. This will be a qualitative analysis since you are merely looking for a significantly different element in that silicon crystal. How much of it is present is only of secondary interest. Therefore, if you find anything different, you will rely on an approximate calculation to tell you “how much”.
23
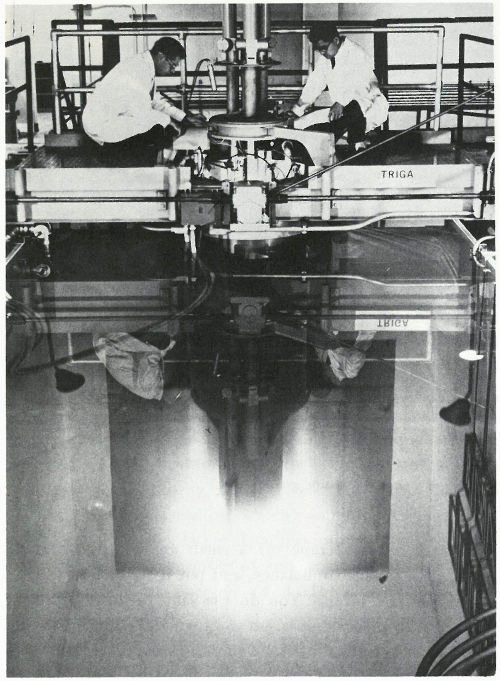
This is called a “swimming pool” reactor because the nuclear fuel, built into metal rods, is held in a framework at the bottom of a deep pool of water. The water serves as a shield to protect workers from the radiation and also helps the reactor “go” by slowing down neutrons to make them more likely to interact with the target atoms. “Swimming pool” reactors are frequently used for neutron activation analysis and typically provide neutron fluxes of over 10¹³ (10 million million) neutrons per square centimeter per second.
24
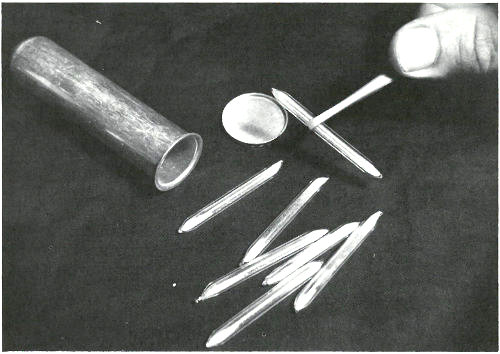
These sealed quartz capsules contain samples to be irradiated in a nuclear reactor. They are about to be placed in the aluminum can, which will be sealed and positioned at the end of an aluminum pole, close to the core of a “swimming pool” reactor. Often samples are placed in plastic tubes and are carried in and out of a reactor by air pressure in a pneumatic tube system.
You carefully scrape off a small amount of material, weigh it on a sensitive balance, and put it into a short piece of pure quartz tubing. You do the same with an ordinary piece of silicon for comparison and then seal both tubes with an oxygen-gas torch. Although the tubes are both ¼ inch in diameter and about 1 inch long, the first tube is just slightly longer so you will be able to determine which is which after the irradiation.
Off it goes to the reactor in a carefully wrapped package along with instructions to irradiate the tubes for 12 hours in a neutron flux of about 10¹³ neutrons per square centimeter per second and to return them as quickly as possible after they are removed from the reactor.
25
The following week, the samples are delivered about 4 hours after they were removed from the reactor. Working quickly but carefully, you note that they are radioactive but easily handled by ordinary laboratory techniques. You break the quartz tubes one at a time and attach each of the two pieces of silicon to a card with self-sticking tape. Then you place each card, in turn, on a holder close to the gamma-ray detector for a period of 10 minutes. A spectrum, which is a graph of the quantity of radiation recorded in each increment of energy over the range observed for each of the samples, is plotted automatically at the end of the counting period and you may now compare the compositions of the two samples. (See the figure on the next two pages.)
The two spectra are virtually identical except that the suspect sample has one obviously different peak in channel 157 and a somewhat smaller peak in channel 183. Referring to an energy calibration curve for the pulse height analyzer, you find that these channels correspond to 0.559 and 0.657 MeV respectively. A search of a table of nuclides, arranged by gamma-ray energy, reveals that this combination is emitted by arsenic-76, which would be the activation product for arsenic. Other data also indicate that for arsenic there should be a number of smaller peaks, including some corresponding to energies of 1.216, 1.228, 0.624, and 1.441 MeV. A closer look at the spectrum of the suspect sample reveals that these are also present.
Finally, noting that the half-life of arsenic-76 is approximately 27 hours, you wait a day and count the sample again in the same position as the previous count. A decrease in the heights of the 0.559 and 0.657 MeV peaks, by a little less than half in 24 hours, confirms that arsenic is the unusual element in this sample. It may not be the only impurity causing the peculiar behavior of this semiconductor, but it does seem a likely candidate.
26
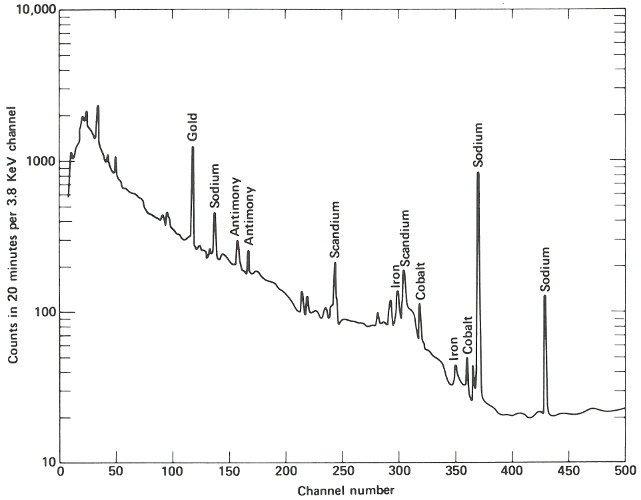
The gamma-ray spectrum obtained after activation of a sample of “pure” silicon having “ordinary” properties of this type of semiconductor. Only very small quantities of various trace impurities are indicated.
27
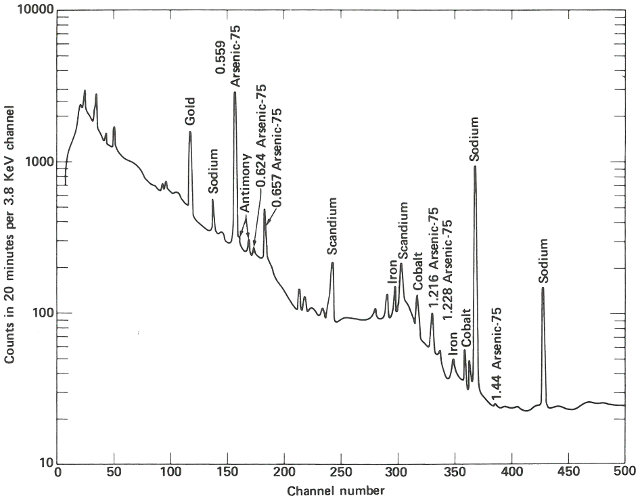
The gamma-ray spectrum obtained after activation of a sample of silicon having “unusual” electrical properties. While most of the spectrum is identical with that obtained from the ordinary material, there is an interesting difference.
28
Using the equation given on page 12, the approximate known values for half-life, sample weight, neutron flux, and periods of irradiation and decay after irradiation, and an estimated value for the number of arsenic-76 atoms measured by the gamma-ray spectrometer, you calculate that the arsenic content of the sample is approximately 44 parts per million (ppm). (See appendix.)
With this information as a starting point, you are now ready to proceed with further research on the properties of your semiconductor, e.g., if you double the concentration of arsenic, how will that affect its properties?
In a Hospital
The Problem
You are a physician treating a patient who, because of a severe calcium deficiency, has been suffering from osteoporosis (a softening of the bones). You think you are on the right track with your treatment, but you would like to be sure in order to know whether you should continue the treatment or try something else. You would have your answer if you knew that the calcium content of his skeleton had stopped decreasing. How can you determine the amount of calcium in a living human being?
The Solution
You know that the usual techniques for determining calcium in the bones are not very useful. They are either too inaccurate to show that your patient’s calcium loss has been stopped or can only be used to measure the calcium content of the bones in his extremities. The latter is not satisfactory because these few bones may not be representative of the rest of his skeleton.
29
Recently, however, there have been reports of neutron activation analysis of whole persons, in which the calcium content of their bones has been measured with unusually good reliability. This has been accomplished by scientists and doctors working at the University of Washington School of Medicine in Seattle.
You manage to obtain an appointment for your patient and you accompany him to the hospital for the analysis. There he is placed on a rotating platform with his head encircled by a plastic helmet and his arms and legs submerged in a water-filled plastic container. See the photograph on the next page. The platform is located in a beam of neutrons emanating from a beryllium target 15 feet away, which is being bombarded by deuterons from a 22-MeV cyclotron. The purpose of the water is to surround the bones in that part of the subject’s skeleton with a neutron moderator equivalent to the body tissue surrounding the rest of his skeleton. (A neutron moderator slows down the neutrons and thus makes them more likely to activate the calcium in the bones.) On each side of the patient, there are two plastic containers permanently filled with a solution containing a known quantity of calcium. These serve as standards for the analysis.
The beam of neutrons is turned on for 35 to 40 seconds. It is then interrupted while platform and patient are rotated 180 degrees. The irradiation is resumed so that a uniform dose of neutrons bombards the patient from both front and back.
During the irradiation your patient receives a dose of radiation equivalent to approximately 10 ordinary chest X rays and one of the calcium isotopes in his bones (calcium-48) is activated to calcium-49. The latter has a half-life of only 8.8 minutes and so counting must begin soon after the irradiation.
30
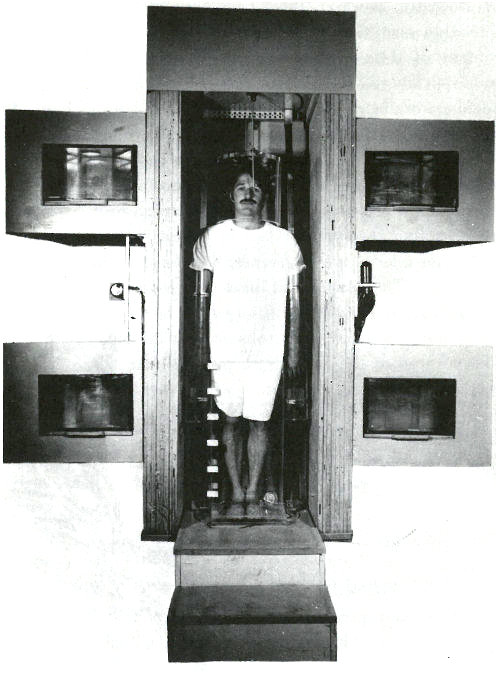
A patient in position for whole body irradiation with neutrons generated by an accelerator. His arms and legs are surrounded by plexiglas containers filled with water and his head is encased in a plexiglas helmet. On either side of him are containers, which serve as standards, filled with an aqueous solution of a calcium salt. The patient is standing on a turntable that is rotated 180 degrees after half the irradiation is completed so that the dose of neutrons is uniformly distributed to the front and the back of the patient.
31
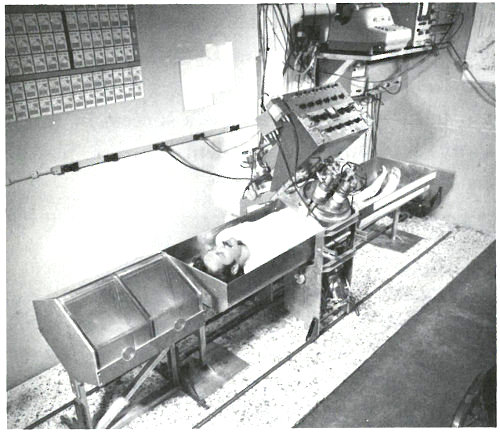
A patient in position for whole-body gamma-ray spectrometry. The detectors are scintillation crystals that produce pulses of light proportional in intensity to the energy of the gamma ray absorbed in the crystal. The patient is scanned from head to foot in approximately 12½ minutes at a rate that is varied to compensate for the gradual decay of the calcium-49 radioactivity during this period. Near the patient’s head are two calcium standard solutions in plexiglas containers.
The patient lies down in a padded aluminum box and, only 4 minutes after the irradiation is concluded, a ring of 4 gamma-ray scintillation detectors[10] begin to measure the gamma rays emitted by his body. These detectors, which are each 4 inches thick and 9⅜ inches in diameter, pass over his body from head to foot. This takes 12½ minutes and since the calcium-49 is decaying with a half-life of 8.8 minutes, the detectors are made to scan at a gradually decreasing rate to compensate for the reduced radioactivity during the later 32 parts of the counting period. The figure on the next page shows the gamma-ray spectrum for the patient. Notice the peak corresponding to an energy of 3.1 MeV. Because there are small contributions to this energy peak from other activated products in the body, repeat counts are taken later (after the calcium-49 has decayed) so that these contributions can be measured and subtracted.
Twenty minutes after the irradiation period, the radioactivity of the calcium standards is measured by the same instrument. The ratio of the counts from your patient’s body to that of the standards is 0.210; this serves as an index of the calcium content of his body on this day. Because of the care taken to make the analysis repeatable, this index is probably accurate to about 1 or 2%.
Your patient’s disease usually results in a decrease of approximately 3% of the calcium in his body per year. Thus, by making the same measurement a year from now, you will be able to tell if your treatment is a success by noting that the calcium level in your patient’s bones has stopped decreasing at a dangerous rate.
In a Plastics Plant
The Problem
You are an analytical chemist working for a company that makes plastic. It is 11:30 a.m. and you have been called by the plant superintendent because some of the plastic coming from the plant has been showing a yellowish-brown discoloration. There seem to be only a few possible reasons for it, but no easy way to tell which one is correct. One possibility is that a copper tank, in which the plastic is prepared, is somehow being corroded by excess acid in the raw material and minute quantities of dissolved copper are discoloring the plastic. You could prove that this is the cause if you could find copper in the plastic, but the plant superintendent wants the answer immediately because a few hours delay in production will jeopardize a valuable contract, and ordinary chemical analysis would take several hours. How can you quickly determine if there is copper present in the plastic?
33
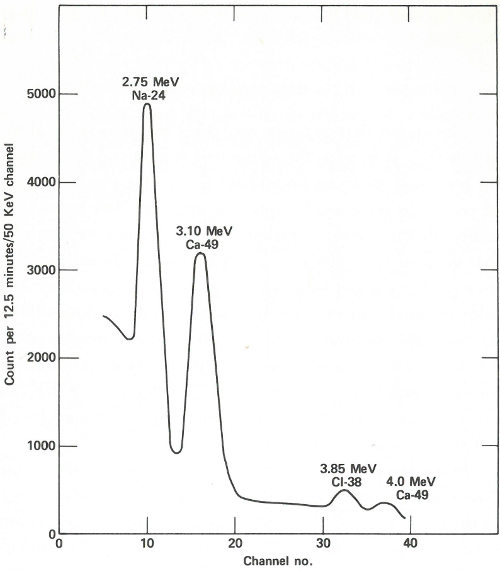
A portion of the gamma-ray spectrum obtained after neutron activation of a human body. The area in the 3.10-MeV peak, which is above the background due to sodium and chlorine activities, is a measure of the quantity of calcium in the body of the subject. A computer may make the necessary corrections due to the background (which results from overlapping of part of the other gamma-ray peaks).
34
The Solution
One reason that ordinary analytical methods are so slow, in this case, is because the amount of copper you are looking for is so small that you would have to dissolve a large amount of plastic to get enough copper to measure. You know that nearly all the plastic is carbon, hydrogen, and oxygen and that none of these elements are easily made radioactive when they are bombarded with low-energy neutrons. You look in a table to see if copper is easily activated. You find that there are two stable isotopes of copper having atomic weights of 63 and 65. Each of these is easily activated, giving radioactive isotopes, copper-64 and copper-66. The latter has a half-life of about 5 minutes and emits gamma rays with energies of 1.039 MeV, which are easy to measure.
In the research building next door, there is a small reactor that can irradiate encapsulated samples with low-energy neutrons at the rate of a million million neutrons per square centimeter per second (10¹² neutrons/cm²/sec). You calculate that if you irradiate only one tenth of a gram of the plastic for 10 minutes, and if the plastic contains only one part of copper in one million parts of plastic, then at the end of the irradiation the radioactive copper formed will be emitting over 400 gamma rays per second. There is a pneumatic tube that can remove the irradiated sample in 20 seconds, and you decide that it will take only a minute or two to remove the sample from its capsule and get it into a gamma-ray counter located nearby. The counter is a scintillation counter that is connected to a pulse-height analyzer.
If you count for only 10 minutes you will detect about 1000 gamma rays of the right energy (allowing for the inefficiencies of the detector system). This sounds like it 35 should do the job. But does the good plastic contain copper too? And how much does it take to produce the discoloration?
You decide to use neutron activation analysis and to analyze samples of faulty plastic, normal plastic, and a small piece of copper foil, which you have weighed and sealed in a small polyethylene bag as a standard. Your results are shown in the table below.
Sample Counts in 10 minutes[11]
0.1 grams faulty plastic 100,000
0.1 grams good plastic 1,000
0.1 milligrams of pure copper 1,000,000
It worked! The faulty plastic contains 100 times as much copper as the good plastic, specifically 100 parts per million. (If 0.1 milligrams of pure copper gave 1,000,000 counts, then the 0.1 grams of faulty plastic contains (100,000/1,000,000) · 0.1 milligrams or 0.01 milligrams of copper. This is one ten thousandth of the weight of the plastic or 0.01% or 100 ppm.) You relay the information to the plant superintendent almost before he finishes his lunch. He now knows what to do and the crisis is over.
In a Museum
The Problem
You are a curator working with the ancient coin collection of a large museum. A donor has just given the 36 museum a group of 50 gold coins presumably about 1500 years old. After months of careful study, you have satisfied yourself that most of those coins are genuine specimens of that period. Judging from your experience, you decide that a small group of five are definite forgeries.
However, there are three others that you suspect are also fakes, but you are not quite certain. You know that both genuine minters and forgers often tried to save money by diluting their gold with less expensive metals such as silver and copper. Since the chances are slim that the forger’s product has the same concentration of gold, silver, and copper as the genuine coins, you realize that a chemical analysis would help you decide if the doubtful pieces were real or fake.
An accurate chemical analysis would require a sample of such size that the coin would be ruined as a museum specimen. You need an analytical method that can be applied to an infinitesimal sample.
The Solution
You are not a scientist but you’ve heard about neutron activation analysis. Therefore, you contact a radiochemist at a local university who is an expert in this field.
He decides to use a sampling technique developed by scientists at Brookhaven National Laboratory for sampling metal objects of archaeological interest. You obtain from him a set of 50 quartz plates that have been ground on one side. Following his instructions, you carefully scrape away a small area on the edge of each coin. You then rub each freshly cleaned area across the ground surface of one plate leaving a minute streak of metal similar to a pencil mark.
At the scientist’s laboratory, each plate is carefully placed inside a quartz tube. No attempt is made to weigh the tiny 37 streak of metal since you wish only to compare the ratios of the metal concentrations. However, because the samples make a rather bulky package, the scientist is concerned with the uniformity of the neutron flux that each sample will “see”. He therefore also places in each tube an exactly equal weight of a gold—silver—copper alloy wire (of known proportions) to act as a standard neutron-flux monitor. The tubes are then sealed and taken to a reactor to be irradiated for 12 hours.
After the samples are removed from the reactor, the scientist carefully breaks open each of the quartz tubes and places the sample and the standard piece of wire in separate numbered plastic capsules with lids. For an accurate comparison, each capsule is prepared in the same manner. About 4 hours after the samples are removed from the reactor, he begins the radioactivity measurements.
The sample capsules are loaded into an automatic sample-changing mechanism that places each one into an identical position above a lithium-drifted germanium detector. (See the chapter beginning on page 19.) Gamma-ray spectra are collected all day, first from a sample, then from its accompanying standard. Each count takes 2 minutes, and 3 minutes are required between counts for data printout and sample changing. A typical gamma-ray spectrum looks like the one in the figure on the next page. Notice that only gold (gold-198) and copper (copper-64) show up in this short counting time. Later on, radioactivity from silver (silver-110m) can be measured using a longer counting time. This can be done because while the activation products from copper and gold have relatively short half-lives (12.8 hours and 2.7 days, respectively), that from silver has a half-life of 270 days. To increase the sensitivity of the analysis for silver, the scientist repackages and re-irradiates the samples and wires for 100 hours. Silver-110m is one of two radioactive isotopes of silver that have the same mass. In this case, one has a higher energy than the other and decays in a different way. This is known as an isomeric state and it occurs for many other elements as well as for silver.
38
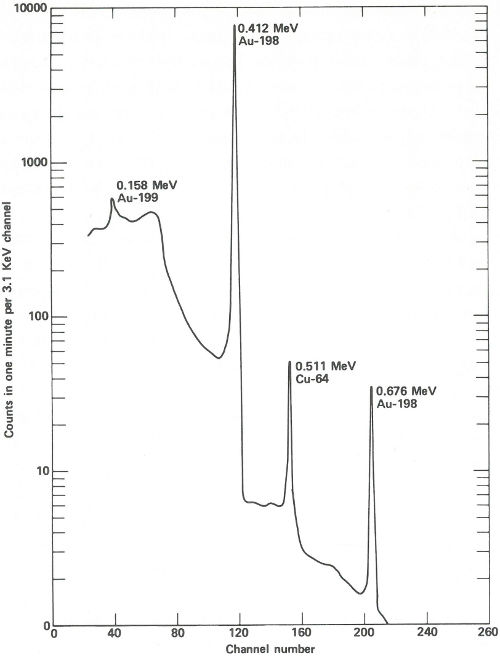
The spectrum obtained from a streak of metal on a quartz plate after a 3-hour exposure to neutrons in a reactor and a 6-hour delay before counting. The activation products of gold and copper are obviously present and are easily measured in only 1 minute.
39
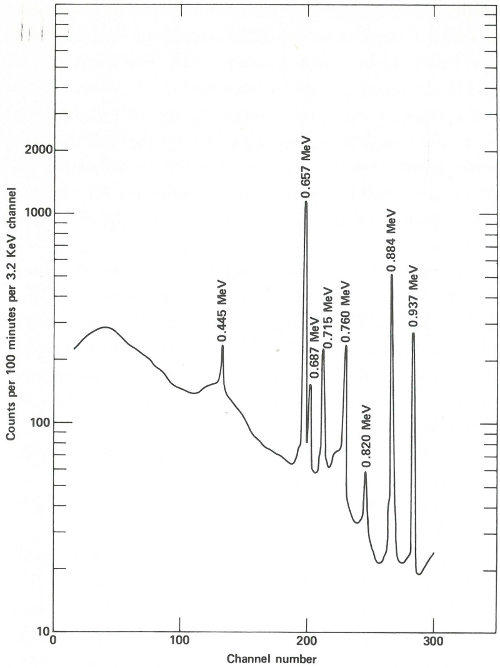
The spectrum obtained from the same streak of metal after re-exposure to neutrons for 100 hours and a delay of approximately 2 months before counting. Activation products from gold and copper have decayed away and the gamma-ray spectrum of silver-110m is now observed. In this case the sample is closer to the detector than for the earlier measurement and the measurement takes 100 minutes.
40
Two months later, the scientist repeats the procedure of counting the samples and standards, except that this time the plastic capsules are closer to the detector, each count is for 100 minutes, and the sample changer operates for about a week. A typical spectrum looks like that in the figure on page 39.
The scientist can now compute ratios for the three elements in each sample and compare them with the standard, but he decides that a computer could do it faster and with fewer errors. The data collected during the two series of counts are therefore sent to a data processing center where, in a matter of minutes, a computer does the following for each of 50 samples:
1. Finds the 0.411-MeV gamma-ray peak for gold-198.
2. Determines the total counts in the peak.
3. Repeats the process for the corresponding wire standard.
4. Corrects the total count for the wire for the small amount of radioactive decay that occurred in the few minutes between the sample count and the standard count.
5. Computes the ratio: [total count for sample/total count for standard (corrected)]
6. Repeats all the above for the 0.511-MeV gamma ray for copper-64 and (in the longer counts) for the 0.658-MeV gamma ray for silver-110.
7. Computes the ratios: [sample to standard (for copper)/sample to standard (for gold)] and [sample to standard (for silver)/sample to standard (for gold)].
8. Tabulates and prints the ratios found in Step 7.
41
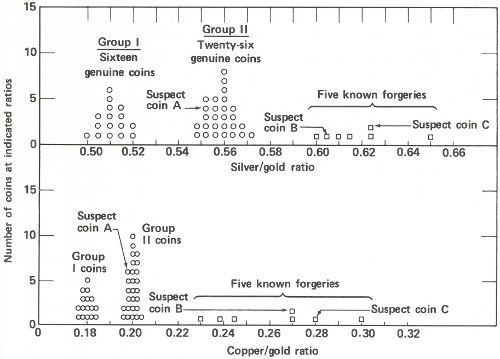
Radioactivity ratios for 50 “gold” coins. Above are the silver to gold ratios. There are two groups of genuine coins. Five known forgeries show considerably higher ratios than the genuine coins. Two of the suspect coins also show high ratios but the third, suspect A, shows a ratio that falls into one of the genuine groups. Below are the copper to gold ratios. Again there are two groups of genuine coins. (The same coins make up the two groups here as above.) The five known forgeries again show higher ratios than the genuine ones and again the same two suspects appear to be forgeries. Suspect A, however, shows a ratio similar to one group of the genuine specimens. One therefore concludes that suspect A is genuine and that B and C are not.
For example, suppose for sample 1 there are 20,000 counts in the 0.412-MeV peak (gold), 190 counts in the 0.511-MeV peak (copper), and 450 counts in the 0.654-MeV peak (silver). Suppose also that standard 1 yielded 10,000, 500, and 400 counts for these three peaks (corrected for decay), respectively. Then the ratio for gold would be (20,000/10,000) = 2.00, the ratio for copper would be (190/500) = 0.380, and the ratio for silver would be (450/400) = 1.13.
42
Finally, the activity ratio of copper to gold would be (0.380/2.00) = 0.190, and the activity ratio of silver to gold would be (1.13/2.00) = 0.565.
Because each sample was irradiated with an identical standard, and counted in an identical arrangement, the last two ratios will be the same for different samples if, and only if, the concentrations of gold, silver, and copper in those samples are in identical proportions. This will be true no matter where in the reactor or for how long the irradiation took place.
Now the scientist presents the data to you. You immediately see that (a) the good coins fall into two groups, one with a silver to gold activity ratio of approximately 0.56 and a copper to gold ratio of approximately 0.20 and a second group with these ratios approximately 0.51 and 0.18; (b) the coins you were certain were forgeries have distinctly higher ratios ranging from 0.60 to 0.65 for silver to gold and from 0.23 to 0.30 for copper to gold; and (c) of the three suspected coins, two have ratios that fall into the range of the known forgeries, but one, with ratios of 0.552 and 0.198, is probably genuine.
You present the result to the museum director in the form of a graph (see the figure on page 41) and a few weeks later, 43 coins are added to the permanent exhibits of the museum, while 7 are discarded.
In a Criminology Laboratory
The Problem
You are a scientist working in the criminology laboratory of a large metropolitan city. A detective brings you a minute 43 sample of paint taken from the clothing of a hit-and-run victim. He has a suspect whose automobile paint seems to match that sample. The suspect was found in his parked automobile, not far from the scene of the accident. He seems to fit the description given by two witnesses, and he is extremely nervous. You scrape a small sample of paint from a recently damaged area of the suspect’s car, and, (with the aid of a microscope) find that the pigment content seems to be the same as that taken from the victim’s clothing. But, are they really from the same paint?
The Solution
You know that paint, like almost everything else, contains very small quantities of impurities that are present only by accident and do not affect its properties as a useful material. The trace impurities, as they are called, will vary from batch to batch of the same paint. Very rarely will a match be obtained in both type and concentration of trace impurities in two samples if they are not from the same batch.
By measuring a sufficient number of different elements, the probability of accidentally matching two samples can be as rare as the duplication of fingerprints in two individuals. Matching of trace impurities is often called a “fingerprint” method.
With neutron activation analysis, you can obtain the “fingerprints” of the two samples to see if they match. Although this kind of evidence may be difficult to use as proof in court, a positive match will let the detective know that he is on the right track. Also, the suspect might confess if he is confronted with the evidence and realizes that he is “caught”. On the other hand, a mismatch will clear the suspect completely and the detective will know to look elsewhere for the criminal.
44
You seal each sample in a tiny polyethylene bag about ½ inch square. One sample is taken from the victim’s clothing and the second, about the same size as the first, taken from the damaged area of the automobile. In preparing these samples, you handle all the materials with clean forceps because you realize that the most minute dirt from your fingers will be detected in the analysis.
The two bags are irradiated together for 1 hour in a nearby reactor and 2 hours later you begin counting the samples with a high-resolution, lithium-drifted-germanium, gamma-ray spectrometer. This will give you a match (or mismatch) for elements that yield radioisotopes of fairly short half-life such as manganese (2.56 hours), copper (12.8 hours), sodium (15 hours), arsenic (27.7 hours), etc. You plan on “counting” the samples again later on, if the first counts match, so that you can check on radioisotopes with longer half-lives such as iron (45 days), chromium (27 days), silver (270 days), cobalt (5 years), etc.
The two gamma-ray spectra you obtain look like those in the figure on the opposite page. The gamma rays from the irradiated paint taken from the victim’s clothing indicate the presence of the common elements sodium, potassium, and copper, but gold, lanthanum, and europium are also conspicuously present. The gamma rays from the other sample also reveal sodium, potassium, and gold but in rather different proportions. More striking is the absence of copper and the two rare earths, and the presence of manganese and arsenic, which were not indicated in the first sample.
The paint samples definitely do not match. Therefore, you inform the detective that his suspect is innocent after all. You’ve solved your problem, but he still has his. Perhaps the same technique will provide positive proof when he finds the real culprit.
45
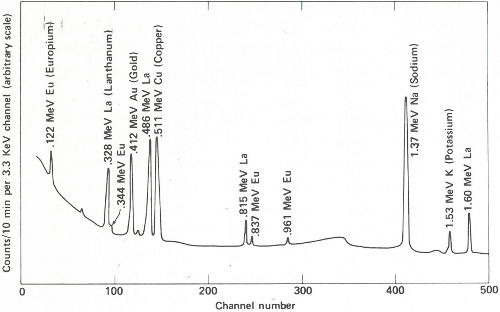
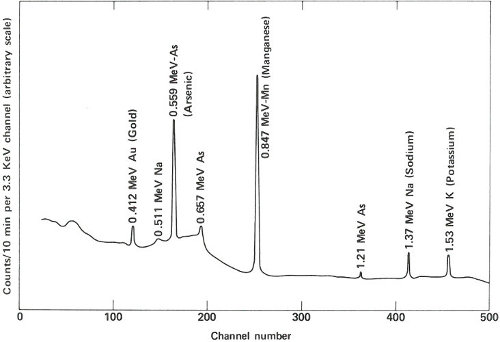
Gamma-ray spectra of two samples of paint. These two spectra are obviously different and, therefore, could not have come from the same source.
46