Part 4 — APPENDIX J.
Reading edition
CLIMATIC CONTRASTS.
COMPARATIVE VITAL STATISTICS.
Vital statistics are set forth by the various Government Statists of Australia with extreme particularity. But it is not easy to make comparative analyses for the purpose of ascertaining the birth rates, marriage rates, or death rates in the different States of Australia. The birth rates per 1,000 of the population give no accurate bases for comparison. They supply only what the statists call the crude birth rate. The information necessary to ascertain true comparative birth rates involves knowledge of the number of women of the different child-bearing ages in the several States; the proportion of marriages at different ages in each; the number of married women, their ages, and also the number of spinsters. Married women in their teens are more fertile than in their twenties, in their twenties than in their thirties, in their thirties than in their forties. So that to ascertain the true birth rate the comparative number of married or marriageable women in the contrasted countries must be ascertained. For example, if there were 20,000 married women in Queensland between twenty and thirty; and 60,000 married women of the same age in New South Wales; and if the number of births among those 20,000 and 60,000 respectively were ascertained, the true birth rate among women of that age would be obtained. Similar remarks apply to the death rate. The comparison must be made between a given number of men or women of the same ages, and then the true comparative death rate per 1,000 of such persons will be ascertainable, but not otherwise.
It is supposed in many parts of Australia that North Queensland is less salubrious than South Queensland, and that the Southern States are healthier than Queensland as a whole. The crude death rate does not give a basis for this assumption, because there are fewer old people and fewer young children per 1,000 of the population in sparsely peopled areas than in settled districts. The lightest average mortality is among persons between the ages of two and eighteen years; the greatest mortality among children under two years. Information is not procurable showing the number of persons in Queensland in age groups, this information being only obtainable in census years.
The Queensland Government Statistician has furnished the accompanying table, based on the results of the censuses of 1891 and 1901, showing the relative salubrity of different parts of the Commonwealth in those two years for all the States save Western Australia; and it will be noticed that it differentiates also between children north and south of the Tropic of Capricorn in Queensland. These figures are valuable for comparative purposes.
It will be noticed that among children under two years the rate of mortality north of the Tropic of Capricorn in 1891 was 74.85 per 1,000, and in 1901 73.42 per 1,000. South of the tropic the corresponding figures were 70.33 and 64.97 per 1,000 respectively, the difference in favour of the south being 4.52 and 8.45 per 1,000. Of children under five years in the north the mortality was 39.44 and 32.80 respectively; while south of the tropic it was 33.54 and 29.72 respectively. Thus the difference in favour of the south was 5.90 and 3.08 respectively. Above the age of five years the difference between north and south is rather more marked, but the comparison of these, for reasons analogous to those stated above with respect to comparative birth or death rates, is valueless.
If we take the New South Wales figures, we find that as to children under two years the mortality in 1891 was 85.12, and in 1901 72.42 per 1,000. Thus North Queensland compares very favourably with the parent State by 10.27 in 1891, and unfavourably in 1901 by only 1 per 1,000. With South Queensland the comparison shows a difference against New South Wales in 1891 of 14.79 per 1,000, and of 7.45 per 1,000 in 1901. As to children under five years the difference in favour of New South Wales in 1891, as against North Queensland, was only 0.16 per cent., and in 1901 0.43 per 1,000; and as against South Queensland it was 5.74 on the wrong side in 1891, and 2.65 in 1901. It is needless further to analyse the figures, but evidently the only States whose mortality among young children is more favourable than South Queensland are South Australia and Tasmania.
Although these figures are official it may be wise to use them with reservation. The comparatively high mortality north of the Tropic of Capricorn is fully accounted for by the absence of the comforts of life in that newly settled area. In 1901 the mortality beyond the tropic was, for children under five years, almost the same as in New South Wales and Victoria. So that, so far as young children are concerned, we need not fear that the climate of Tropical Queensland will be found unfavourable to the British race.
The death ratio of the population is somewhat higher in the tropics than in the South for each age group mentioned, and consequently of course for persons of all ages; this applies to both the years cited, 1891 and 1901. These years have been selected as, being "Census" years, the numbers at each age can then be definitely determined. The mortality rate for 1901 showed a distinct improvement on that for 1891 in all instances except with persons over five years of age in the South; as regards these the experience for 1901 was fractionally less satisfactory than in 1891.
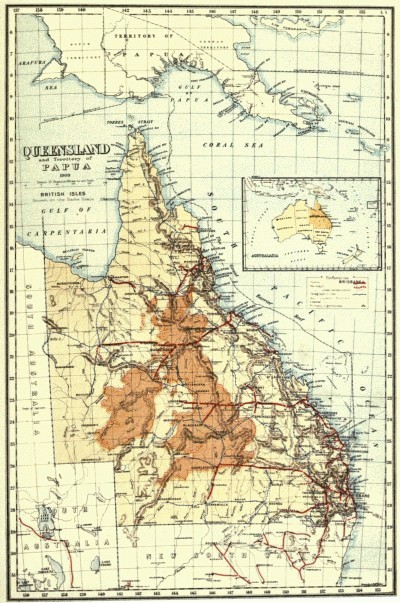
"QUEENSLAND and Territory of PAPUA 1909"
Return showing the Population, Number of Deaths, and the Rate of Mortality at Certain Ages for the Years 1891 and 1901.
1891. 1901.
Census Population. Number of Deaths. Ratio per 1,000 of the Population. Census Population. Number of Deaths. Ratio per 1,000 of the Population.
QUEENSLAND— North of the Tropic of Capricorn— Under 2 years 6,426 481 74·85 6,933 509 73·42
Under 5 years Over 5 years 15,061 93,925 594 1,088 39·44 11·58 17,166 132,466 563 1,448 32·80 10·93
All ages 108,986 1,682 15·43 149,632 2,011 13·44
South of the Tropic of Capricorn— Under 2 years 18,598 1,308 70·33 18,454 1,199 64·97
Under 5 years Over 5 years 45,264 239,468 1,518 1,970 33·54 8·23 45,460 308,174 1,351 2,645 29·72 8·58
All Ages 284,732 3,488 12·25 353,634 3,996 11·30
Whole State— Under 2 years 25,024 1,789 71·49 25,387 1,708 67·28
Under 5 years Over 5 years 60,325 333,393 2,112 3,058 35·01 9·17 62,626 440,640 1,914 4,093 30·56 9·29
All Ages 393,718 5,170 13·13 503,266 6,007 11·94
189112·77
190111·88
Return showing the Population, Number of Deaths, and the Rate of Mortality at Certain Ages for the Years 1891 and 1901—continued:
1891. 1901.
Census Population. Number of Deaths. Ratio per 1,000 of the Population. Census Population. Number of Deaths. Ratio per 1,000 of the Population.
New South Wales—— Under 2 years 66,719 5,679 85·12 64,376 4,662 72·42
Under 5 years Over 5 years 165,750 966,484 6,510 9,776 39·28 10·12 159,146 1,199,987 5,151 10,870 32·37 9·06
All ages 1,132,234 16,286 14·38 1,359,133 16,021 11·79
Victoria— Under 2 years 62,102 5,822 93·75 54,669 3,817 69·82
Under 5 years Over 5 years 148,359 982,104 6,518 12,113 43·93 12·33 131,986 1,069,355 4,251 11,653 32·21 10·90
All Ages 1,130,463 18,631 16·48 1,201,341 15,904 13·24
South Australia— Under 2 years 17,875 1,180 66·01 15,988 1,059 66·24
Under 5 years Over 5 years 45,166 270,367 1,407 2,804 39,940 318,568 31·15 10·37 1,166 2,808 29·19 8·81
All Ages 315,533 4,211 13·35 358,508 3,974 11·08
Tasmania— Under 2 years 8,414 524 62·28 8,484 492 57·99
Under 5 years Over 5 years 21,466 125,201 599 1,635 27·90 13·06 20,865 151,610 531 1,283 25·45 8·46
All Ages 146,667 2,234 15·23 172,475 1,814 10·52
Western Australia—— Under 2 years ... ... ... 9,303 882 94·81
Under 5 years Over 5 years 6,835 42,947 293 576 42·87 13·41 20,675 163,449 957 1,562 46·29 9·56
All Ages 49,782 869 17·46 184,124 2,519 13·68
RAINFALL AND TEMPERATURE.
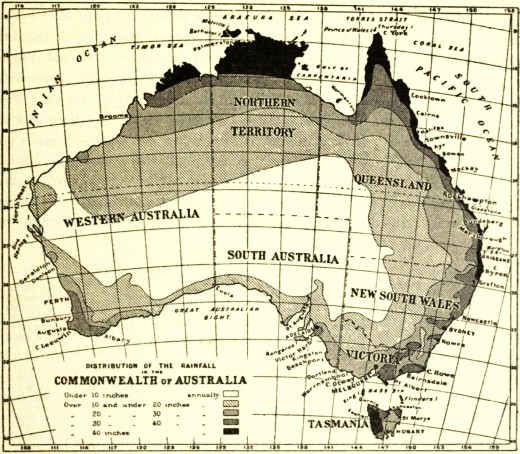
The subjoined map shows the curves of equal mean annual rainfall for every 10·0 inches for Australia, compiled from the most recent information:—
DISTRIBUTION OF THE RAINFALL OF THE COMMONWEALTH of AUSTRALIA
The following table shows the relative rainfalls at the six Australian capital cities for the periods set severally against them; also for the ten-year period subsequent to 1896, during which the average precipitation was much below that of the total number of years over which the records extend:—
Place. Total Number of Years. Average Rainfall for all Years. Ten Years' Average Rainfall. Difference between the Two. Difference for Ten Years. Ten Years' Percentage per Annum above or below True Mean.
Inches.Inches.Inches. Inches.
Brisbane5747·4739·16-8·31 83·10-18
Sydney6748·8044·28-4·52 45·20-9
Melbourne6326·3525·50-0·85 8·50-3
Perth3133·0332·54-0·49 4·90-1
Hobart6623·3822·98-0·40 4·00-2
Adelaide6720·8920·53-0·36 3·60-2
The following table supplies similar information with respect to seventeen representative Queensland stations, from which it will be seen that the mean annual rainfall at Geraldton for twenty-one years was 145·27 inches, and for the ten years subsequent to 1896 135·81 inches. Thus Geraldton is by far the wettest place in the State. The lightest mean rainfall for the same period was at Boulia, which recorded 11·45 inches; and for the ten years, 8·72 inches. The last column of the table shows that the fall for the ten years was under the average at every station mentioned, the shortage at Cooktown having been 28 per cent. each year of the ten. The number of wet days is not supplied, except for the capital cities. The driest part of Australia—that which receives a rainfall of 10·0 inches and under—comprises an area equalling nearly one-third of the Commonwealth, and includes the central Territory of South Australia, the extreme western parts of New South Wales, the south-western parts of Queensland, and the south-eastern, central, and part of the north-western portions of Western Australia. The limits of this dry area are shown by the 10·0-inch isohyetal line:—
Place. Total Number of Years. Average Rainfall for all Years. Ten Years' Average Rainfall. Difference between the Two. Difference for Ten Years. Ten Years' Percentage per Annum above or below True Mean.
Inches.Inches.Inches.Inches.
Cooktown29 68·9649·91-19·05190·50-28
Geraldton21145·27135·81-9·4694·60-7
Brisbane5747·4739·16-8·3183·10-18
Mackay3669·4261·73-7·6976·90-11
Maryborough3646·5839·49-7·0970·90-15
Goondiwindi2829·2722·99-6·2862·80-21
Tambo 2122·8718·08-4·7947·90-21
Bowen3640·4035·62-4·7847·80-12
Blackall2722·5917·92-4·6746·70-21
Charleville3419·7115·30-4·4144·10-22
Hughenden2219·1214·92-4·2042·00-22
Thursday Island1668·1163·99-4·1241·20-6
Springsure3026·2522·54-3·7137·10-14
Boulia2111·458·72-2·7327·30-24
Thargomindah2512·5310·03-2·5025·00-20
Cloncurry2319·3517·02-2·3323·30-12
Normanton3537·1135·26-1·8518·50-5
The following table shows the distribution of the average rainfall from 10·0 inches and under to over 40·0 inches:—
Average Annual Rainfall. N.S.W. Victoria. Queensland. South Australia. Northern Territory. Western Australia. Tasmania Commonwealth.
sqr. mls.sqr. mls.sqr. mls.sqr. mls. sqr. mls.sqr. mls.sqr. mls.sqr. mls.sqr. mls.
Under 10 inches81,144nil135,600306,663 6,300 408,300 nil938,007
10-20 inches116,36336,300255,30057,935 213,430 400,720 nil1,080,048
20-30 inches77,91027,900173,40013,908 96,790 113,700 11,395515,003
30-40 inches20,41418,77058,7001,198 120,600 39,100 5,396264,178
Over 40 inches14,5414,91447,500366 86,500 14,100 9,424177,345
Total Area 310,37287,884670,500380,070 523,620975,92026,215 2,974,581
The comparative rainfalls and temperatures at the respective State capitals, and at Canberra, the embryo Federal capital, are shown in the following table:—
Place. Height above M.S.L. Annual Rainfall. Temperature.
Average. Highest. Lowest. Mean Summer. Mean Winter. Highest on Record. Lowest on Record. Average Hottest Month. Average Coldest Month.
Ft.Ins.Ins.Ins. Fahr.FahrFahrFahrFahrFahr
Perth19733·0546·7320·4873·9 55·6112·033·675·154·6
Adelaide14120·3830·8713·4372·3 52·0116·332·273·352·5
Brisbane13750·0088·2324·1176·0 60·0108·936·177·358·0
Sydney14449·3582·8123·0170·8 53·9108·535·971·552·3
Melbourne9125·6244·2515·6164·9 49·2111·227·066·347·7
Hobart16023·4040·6713·4361·447·0105·027·762·145·7
Canberra (District) { 2,000 to 2,900 } 23·0050·6916·5669·745·0109·0 16·072·042·0
The mean humidity at the several capitals is as follows:—Brisbane mean averages, 68·1; highest, 85; lowest, 47. Sydney mean averages, 73, 90, 55. Melbourne mean averages, 72, 76, 67. Adelaide mean averages, 56, 84, 33. Perth mean averages, 63, 83, 45. Hobart mean averages, 72, 76, 67.