Chapter III · Population.
Reading edition
POPULATION.—CENSUS.—TABLES OF POPULATION.—RELATIVE DIVISION OF RACES.—RELATIVE INTELLECTUAL CULTIVATION.—RELATIVE POPULATION IN HOT AND COLD DISTRICTS.
IT is to be regretted that no very accurate census of Mexico has ever been made, and that since the year 1831, no effort has been persistently pursued by the government to enumerate its citizens and collect such statistical data as may always be easily gathered by persons engaged in this important task. The irregularity of the central or executive power; the instability of all governments since the establishment of independence; the intestine quarrels, not only in the capital but in the departments or states, have all contributed to, and even partially compelled, this neglect of a great national duty.
In the absence, therefore, of official statistics and reports, we are obliged to rely upon approximate results, founded on the partial enumerations of preceding years and the calculations of experienced statesmen and writers. In the following table we shall exhibit all the most trustworthy statements existing either in Mexican works or in the writings of reliable authors:—
Variances between the different Calculations and Censuses of the Population of Mexico.
Years.No. of Inhabitants.
1793—Census of the Viceroy Revilla-Gigedo, including Vera Cruz and Guadalajara, according to an estimate in 1803,5,270,029
1803—Geographico-political tables of New Spain,5,764,731
1810—Semanario economico of Mexico,5,810,005
1820—Navarro's Memorial on the population of the kingdom of New Spain,6,122,354
Calculation of the first Congress,6,204,000
1831—Actual census of the Mexican Republic, published by Valdes,6,382,264
1824—Hon. J. R. Poinsett,6,500,000
1825—Humboldt, about,7,000,000
1838—Report of Commissioner of Chamber of Deputies,7,009,120
1834—Galvan's Mexican Calendar,7,734,292
1836—Notices of the states and territories of the Mexican nation,7,843,132
1830—Mr. Burkhardt—a German author,7,996,000
1842—An estimate made as the basis for the election of a Congress, (exclusive of Texas,)7,015,509
In the year 1838, Señor Jose Gomez de la Cortina,—ex-Conde de la Cortina, one of the most enlightened citizens of Mexico, published a carefully prepared essay upon the population of Mexico, in the 1st No. of the Bulletin of the National Institute of Geography and Statistics of the Mexican Republic; and his opinion was that the number of inhabitants greatly exceeded any of the above amounts. By observing the increase of population in different periods of five years, he considered it satisfactorily proved by the Tablas Geographico-politicas, of 1803, that the augmentation, in favorable years, was at the rate 14/5 per cent. By applying this ratio to the census of the Tablas, which gave in 1803, 5,764,731 inhabitants, we shall have an increase of about 105,000 yearly; and if we calculate at this rate of augmentation for the 46 intervening years, we find in 1850 an increase of 4,830,000, or a grand total of 10,594,731.
In the year 1842, however, when an estimate was made of a basis of population, upon which to found a call for a Congress to form a new constitution under the plan of Tacubaya, in 23 Departments or States and Territories, exclusive of Texas, the government calculated that there were 7,015,509 inhabitants.
Table of Population in 1842.
Departments.Population.
Mexico,1,389,502
Jalisco,679,311
Puebla,661,902
Yucatan,508,948
Guanajuato,512,606
Oajaca,500,278
Michoacan,497,906
San Luis Potosi,321,840
Zacatecas,273,575
Vera Cruz,254,380
Durango,162,618
Chihuahua,147,600
Sinaloa,147,000
Chiapas,141,206
Sonora,124,000
Queretaro,120,560
Nuevo Leon,101,108
Tamaulipas,100,068
Coahuila,75,340
Aguas Calientes,69,698
Tabasco,63,580
Nuevo Mexico,57,026
Californias,33,439
7,015,509
Deduct for—New Mexico,57,026
Upper California, since25,000
added to the United States.82,026—82,026
Estimated actual population in 1842,6,933,483
Add 10 per cent. for the probable increase in 7 years693,348
Proximate actual population in 1850,7,626,831
This population may be relatively classed among races and castes as follows:
4,354,886Indians.
1,100,000Whites.
2,165,345Meztizos, Zambos, Mulattoes, &c.
6,600Negroes.
7,626,831
As Mexico, since the treaty of Guadalupe Hidalgo, in 1848, possesses 798,402 square miles, this will give nine inhabitants and a fraction, to the square mile.
From these calculations we deduce some very important facts as to the physical and intellectual condition of Mexico, which are very significant in the illustration of history. It appears that the total number of pure whites in the republic, is, in all probability, not more than 1,100,000; while the Indians, Negroes, Zambos, Mulattoes, Meztizos, and all the mixed bloods, amount to 6,526,831. During our residence in Mexico we ascertained from reliable authority that among the Indians and negroes but two per cent. could read and write, while among the whites, and castes, but twenty per cent. were estimated to enjoy those benefits. Thus we have:
87,229Indians and Negroes able to read and write.
653,069Whites and mixed castes able to read and write;
or, only seven hundred and forty thousand, two hundred and ninety-eight individuals, either completely educated or instructed in the simplest rudiments, out of a population of more than seven and a half millions. These are startling statistics in regard to the citizens of a nation whose government is theoretically and practically based on the culture of the people or their capacity for self-rule; and, when considered in connexion with the historical details presented in the first volume of this work, they will show that the distracted condition of Mexico is a mingled cause and consequence of her intellectual darkness.[7]
One of the most interesting investigations in Mexican statistics would be to compare the number of births in the regions called the tierras calientes—or hot country, with those in the tierras frias, or cold region. From calculations made by Cortina in 1838, from data derived from nine departments, he concluded that the excess of births in the warm regions or tierras calientes was 15/10 per 100, over the tierras frias.
He gives the following actual statistics in evidence:
1st. Result of the general census of the department of Zacatecas since the year 1824, and progressive increase of population therein before the separation of the portion of Aguas Calientes:—
Years.Total population.Increase of population biennially.
1824247,295}
1826272,901}25,606
1828274,537}1,636
1830290,044}15,507
1832314,121}24,077
1834331,781}17,660
2d. In 1836, after the separation of the portion of Aguas Calientes, this department had264,505inhabitants.
In June, 1838, it had273,575"
Increase in one year and a half,9,070
3d. In the period from 1st of January, 1837 to 30th of June, 1838, there were born in the said department,21,941
Died in the said department,12,871
Increase of population,9,070
4th. In the department of Oajaca in 1834, it was calculated that there were457,033inhabitants.
In December, 1838,500,278"
Increase in four years,43,245
RESULTS.
Maximum of annual increase of population inOajaca,15,000
Minimum " " " 6,000
Maximum " " "Zacatecas 12,000
Minimum " " " 500
Of not less importance are the investigations upon the excess observed in one sex over the other. Before the appearance of Humboldt's work it was the opinion that in the New World nature did not follow the same law of equilibrium in the difference between the sexes as in Europe, and especially that in the tropical regions, the number of females exceeded greatly that of the males. Baron Humboldt combated this notion and demonstrated its error. He presents in his political essay upon New Spain a table of the population of eight Intendencies, in which it appears that out of 1,352,835 inhabitants there were 687,935 males and 664,900 females, which establishes a relative proportion of 100 to 95. In the Tablas Geografico politicas, already cited, it is expressly said that in New Spain, in the Intendencies of the tierras frias, or cold regions, as well as in those of the tierras calientes, or hot regions, the population inclines to a preponderance of males. Don Fernando Navarro y Noriega gives in his tables of population 71,642 more males than females; and, in the account of the taxes made by order of the government in 1781, it appears that the excess is still in favor of males, though in a much less proportion than assigned by Baron Humboldt. We present the following table, prepared in Mexico for the purpose of throwing more light on the subject:
Table of Population in various Departments in different years—Relative exceses—Births and deaths.
Years. Departments, States, or Cantons of States. Males. Females. Excess males. Excess females.
1829New Mexico21,79921,640159
1819Alta California10,9799,1071,872
1830Do. do.12,47310,0112,462
1832Nuevo Leon49,57148,601970
1829San Luis Potosi.—See following table.
1832Oajaca237,127247,887 10,760
1823Michoacan178,052187,028 8,976
1831-Canton of Vera Cruz29,85131,695 1,844
" of Misantla2,4512,658 207
" of Papantla4,2794,22554
" of Tampico11,11212,265 1,153
" of Jalacingo7,8168,046 230
" of Jalapa19,83722,867 3,030
1826Guanajuato165,896179,288 13,392
1834Chihuahua75,30369,8795,424
1838Tamaulipas49,23545,4603,775
1838Aguas calientes33,66136,032 2,371
1831Jalisco.—See following table.
1838Zacatecas.—See following table.
1821Tamaulipas34,35633,428928
1833New Mexico31,01226,1644,848
Births. Deaths. Excess.
Males.Females.Males.Females.Males.Females.
1829San Luis Potosi—first six months4,8825,1592,0291,885 421
1830Jalisco—whole year14,30713,90513,19411,972 820
1837Zacatecas—18 mo's.10,93511,0066,3766,49548
1834[8]State of Mexico, except 2 prefectures18,41018,804cholera this year.
1830Guanajuato——whole year14,69914,2527,2357,511276
It may, generally, be said that the excess of one sex over the other is in inverse proportion to the latitude; or, in other words, that, as we advance from the equator, the excess of females over males decreases, until the reverse occurs as the degrees of latitude augment. We must, however, except from this rule the department or state of Tamaulipas, in which the constancy with which nature sustains the excess of males, is somewhat extraordinary. The most ancient document possessed upon the subject, relative to this State, is of the year 1793, and from this we discover that, from that year until 1807, 124 more males than females were born therein, and that 30 more females than men died during the period—
More females than males are born in the following States, in the order in which they are placed: More males than females are born in the following States, according to the order in which they are placed:
1. Vera Cruz—greatest number. 2. Oajaca. 3. Puebla. 4. Michoacan. 5. Guanajuato. 6. Jalisco. 1. Alta California—greatest No. 2. New Mexico. 3. Sonora. 4. Chihuahua. 5. Coahuila. 6. New Leon. [9]
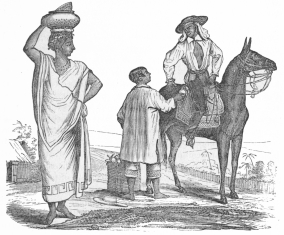
INDIANS OF THE TIERRA CALIENTE.