APPENDIX A
Reading edition
TABLE I
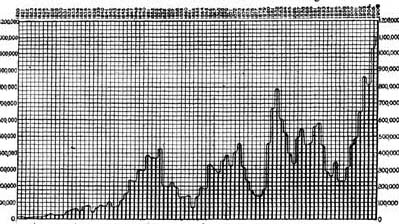
Number of Immigrants Arrived in the United States each Year from 1820 to 1905, both inclusive[100]
PeriodNumber
Year ending September 30—
18208,385
18219,127
18226,911
18236,354
18247,912
182510,199
182610,837
182718,875
182827,382
182922,520
183023,322
183122,633
Oct. 1, 1831, to Dec. 31, 183260,482
Year ending December 31—
183358,640
183465,365
183545,374
183676,242
183779,340
183838,914
183968,069
184084,066
184180,289
1842104,565
Jan. 1 to Sept. 30, 184352,496
Year ending September 30—
184478,615
1845114,371
1846154,416
1847234,968
1848226,527
1849297,024
1850310,004
Oct. 1 to Dec. 31, 185059,976
Year ending December 31—
1851379,466
1852371,603
1853368,645
1854427,833
1855200,877
1856195,857
Jan. 1 to June 30, 1857112,123
Year ending June 30—
1858191,942
1859129,571
1860133,143
Year ending June 30—
1861142,877
186272,183
1863132,925
1864191,114
1865180,339
1866332,577
1867303,104
1868282,189
1869352,768
1870387,203
1871321,350
1872404,806
1873459,803
1874313,339
1875227,498
1876169,986
1877141,857
1878138,469
1879177,826
1880457,257
1881669,431
1882788,992
1883603,322
1884518,592
1885395,346
1886334,203
1887490,109
1888546,889
1889444,427
1890455,302
1891560,319
1892579,663
1893439,730
1894285,631
1895258,536
1896343,267
1897230,832
1898229,299
1899311,715
1900448,572
1901487,918
1902648,743
1903857,046
1904812,870
19051,026,499
1906[101]1,100,735
TABLE II
RACE, SEX, AND AGE OF IMMIGRANTS ADMITTED IN 1905
Race or peopleMaleFemaleTotalUnder 14 years14 to 44 years45 yrs. and over
African (black) 2,325 1,273 3,598 433 2,974 191
Armenian 1,339 539 1,878 246 1,529 103
Bohemian and Moravian 6,662 5,095 11,757 2,620 8,442 695
Bulgarian, Servian, and Montenegrin 5,562 261 5,823 97 5,529 197
Chinese 1,883 88 1,971 28 1,666 277
Croatian and Slovenian 30,253 4,851 35,104 1,383 32,470 1,251
Cuban 4,925 2,334 7,259 1,346 5,225 688
Dalmatian, Bosnian, and Herzegovinian 2,489 150 2,639 62 2,450 127
Dutch and Flemish 5,693 2,805 8,498 1,699 6,085 714
East Indian 137 8 145 3 122 20
English 31,965 18,900 50,865 6,956 36,726 7,183
Filipino 4 1 5 4 1
Finnish 11,907 5,105 17,012 1,483 15,047 482
French 6,705 4,642 11,347 1,121 8,825 1,401
German 49,647 32,713 82,360 11,469 64,441 6,450
Greek 11,586 558 12,144 446 11,523 175
Hebrew 82,076 47,834 129,910 28,553 95,964 5,393
Irish 24,640 29,626 54,266 2,580 48,562 3,124
Italian (north) 31,695 8,235 39,930 3,569 34,561 1,800
Italian (south)155,007 31,383 186,390 16,915 159,024 10,451
Japanese 9,810 1,211 11,021 124 10,588 309
Korean 4,506 423 4,929 325 4,557 47
Lithuanian 13,842 4,762 18,604 1,474 16,875 255
Magyar 34,242 11,788 46,030 3,864 39,926 2,240
Mexican 152 75 227 29 169 29
Pacific Islander 13 4 17 1 15 1
Polish 72,452 29,985 102,437 9,867 89,914 2,656
Portuguese 2,992 1,863 4,855 1,035 3,381 439
Roumanian 7,244 574 7,818 153 7,293 372
Russian 2,700 1,046 3,746 591 2,988 167
Ruthenian (Russniak) 10,820 3,653 14,473 661 13,321 491
Scandinavian (Norwegians, Danes, and Swedes) 37,202 25,082 62,284 6,597 52,226 3,461
Scotch 10,472 5,672 16,144 2,270 12,109 1,765
Slovak 38,038 14,330 52,368 4,582 45,882 1,904
Spanish 4,724 866 5,590 403 4,612 575
Spanish-American 1,146 512 1,658 223 1,232 203
Syrian 3,248 1,574 4,822 742 3,843 237
Turkish 2,082 63 2,145 45 2,073 27
Welsh 1,549 982 2,531 464 1,726 341
West Indian (except Cuban) 892 656 1,548 187 1,209 152
All other peoples 288 63 351 22 311 18
Total724,914 301,585 1,026,499 114,668 855,419 56,412
Here we have forty-four races or nationalities differentiated. Surely this is a medley of peoples to be harmonized. Note the vast proportion of working age.
TABLE III
DEBARRED IN 1905, FOR REASONS GIVEN
Race or PeopleIdiotsInsanePaupers or likely to be public chargesLoathsome or contagious diseasesContract laborersRelieved in hospital
African (black)-- 107- 13 3
Armenian-- 25 50 5 78
Bohemian and
Moravian- 1 38 8 5 104
Bulgarian, Servian, and Montenegrin-- 314 19 62 37
Chinese- 1 9 74 3 2
Croatian and Slovenian-- 263 88 32 128
Cuban- 1 22 4 11-
Dalmatian, Bosnian,
and Herzegovinian-- 41 3 13 18
Dutch and Flemish 2 1 51 7 5 41
East Indian-- 12- 1 3
English 4 9 328 28 58 144
Finnish 2 1 33 46 4 89
French- 2 94 9 23 48
German 5 8 420 100 60 747
Greek-- 193 22 60 70
Hebrew 10 10 1,208 353 33 1,534
Irish 4 13 175 28 15 243
Italian (north)- 2 169 41 42 158
Italian (south) 6 19 1,578 247 205 1,290
Japanese- 1 238 285 13 2
Korean-- 4 18- 1
Lithuanian 2 1 48 92 8 269
Magyar-- 427 103 18 363
Mexican-- 7 8- 2
Polish- 4 444 204 125 991
Portuguese-- 50 7 1 26
Roumanian-- 388 14 111 47
Russian- 3 66 27 1 59
Ruthenian (Russniak) 1 1 186 14 13 115
Scandinavian
(Norwegians, Danes,
and Swedes) 2 9 152 43 14 253
Scotch- 2 77 10 21 75
Slovak-- 275 66 47 491
Spanish- 1 66 6 63 23
Spanish American-- 13 4 1 6
Syrian-- 124 155 59 200
Turkish-- 46 9 5 17
Welsh- 1 12 1 13 8
West Indian (except Cuban)- 1 20-- 17
All other peoples-- 195 5- 74
Grand total 38 92 7,898 2,198 1,164 7,776
Wave of Immigration into the United States from all Countries during 87 Years