Part II
Reading edition
81
MATHEMATICAL STUDY OF SUPPLY AND DEMAND IN THE HOG MARKET
Mathematical formulation of price-making factors is necessary in order to know when extraordinary or strategic considerations are influencing the market. The mathematical methods are highly technical, and in order to explain most clearly we shall follow a specific problem thru from beginning to end.
The problem is to determine the price of hogs from hog receipts (supply) and from business conditions (demand). To represent business conditions, we are using bank clearings outside of New York City. The actual figures for heavy hog prices at Chicago are given in the Appendix. Hog receipts at Chicago and bank clearings outside of New York City are given on pages 81 and 82. The problem is to evolve from these figures the law of hog prices.
The first step is to determine the secular or long-time trend of these figures. Find, for example, the secular trend of such a series as:
1901 2
1902 3
1903 2
1904 5
1905 2
1906 6
1907 4
1908 6
1909 6
From looking at these figures, we know that the secular trend slopes upward, starting with about 2 in 1901, reaching 3 or 4 by 1905, and 5 or 6 by 1909. To express the matter with mathematical accuracy, the method as applied to this series is as follows: First add all the figures together. Answer in this case, 36. Then divide by the number of figures—in this case 9. Thirty-six divided by 9 gives 4, which is the value of the secular trend for 1905, which is the central year.
The year 1904 is the −1 year, 1903 the −2 year, 1902 the −3 year, 1901 the −4 year, and in like manner 1906 is the +1 year, 1907 the +2 year, 1908 the +3 year and 1909 the +4 year. Multiply the minus years by their respective values: −1 by 5, −2 by 2, −3 by 3 and −4 by 2, and also the plus years, +1 by 6, +2 by 4, +3 by 6 and +4 by 6. The totals are −26 and +56, or a net of +30. Now the sum of the squares of −1, −2, −3, −4, +1, +2, +3 and +4 is 60. Sixty divided into 30 gives .5, which is the rate of movement of the secular trend each year, or if, as we found, 4 is the secular trend value for 1905, then 3.5 is the value for 1904, 3.0 for 1903, 2.5 for 1902, and 2.0 for 1901, and in like manner 4.5 for 1906, 5.0 for 1907, 5.5 for 1908 and 6 for 1909. The secular trend is a straight line, and the actual goes above and below the secular trend in more or less wave-like fashion. In Chart I, the straight line is the secular trend of heavy hog prices at Chicago for 1903–1916, and the irregular line fluctuating above and below is the actual price of heavy hogs.
82
BANK CLEARINGS OF THE UNITED STATES OUTSIDE NEW YORK CITY.
(7 ciphers omitted)
1903. 1904. 1905. 1906. 1907. 1908. 1909. 1910. 1911. 1912.
$ $ $ $ $ $ $ $ $ $
Jan. 390 376 411 510 542 463 516 591 597 623
Feb. 323 330 353 415 449 388 437 498 497 566
Mar. 358 359 419 463 510 430 513 600 585 604
Apr. 364 353 405 436 499 430 507 570 543 614
May 354 339 418 444 507 421 491 537 557 604
June 368 350 408 443 479 419 504 548 562 567
July 379 348 403 440 506 448 515 543 555 602
Aug. 326 336 392 432 467 404 482 508 528 572
Sep. 338 350 403 420 454 434 506 516 542 564
Oct. 394 405 460 521 561 491 582 592 606 701
Nov. 356 418 461 505 418 480 572 582 603 655
Dec. 380 430 476 504 406 512 594 591 609 655
Totals 4330 4394 5009 5533 5798 5320 6219 6676 6784 7327
1913. 1914. 1915. 1916. 1917. 1918. 1919. 1920. 1921. 1922.
$ $ $ $ $ $ $ $ $ $
Jan. 693 683 620 781 1051 1182 1456
Feb. 584 563 543 719 884 1000 1160
Mar. 628 640 628 820 1056 1224 1359
Apr. 626 635 620 775 1036 1239 1326
May 618 593 599 816 1073 1271 1428
June 598 610 610 810 1064 1246 1449
July 621 631 623 799 1048 1324 1562
Aug. 563 535 573 805 1041 1320 1516
Sep. 599 540 614 850 1015 1271 1598
Oct. 703 613 741 1002 1254 1516 1809
Nov. 631 568 756 1016 1239 1375 1672
Dec. 668 611 797 1036 1192 1415 1576
Totals 7532 7222 7724 10229 12953 15383 17909
83
RECEIPTS OF HOGS AT CHICAGO IN MILLIONS OF POUNDS.
(000,000 omitted)
1903. 1904. 1905. 1906. 1907. 1908. 1909. 1910. 1911. 1912.
Jan. 170 179 198 195 180 239 166 119 115 187
Feb. 144 174 152 158 151 184 141 122 150 172
Mar. 112 126 143 135 132 153 152 86 168 143
Apr. 117 116 121 111 136 108 102 74 125 129
May 130 124 143 127 152 132 123 110 154 146
June 156 128 139 141 139 136 113 120 132 128
July 128 79 115 135 147 118 101 96 118 125
Aug. 133 120 115 138 128 105 92 112 116 103
Sep. 120 87 115 113 121 83 82 92 99 95
Oct. 109 110 135 121 104 131 91 107 124 118
Nov. 145 164 162 127 99 174 127 127 144 127
Dec. 194 184 178 148 172 184 138 136 145 147
Totals 1,658 1,591 1,716 1,649 1,661 1,747 1,428 1,301 1,590 1,620
1913. 1914. 1915. 1916. 1917. 1918. 1919. 1920. 1921. 1922.
Jan. 182 157 200 239 224 157 256
Feb. 149 145 166 193 162 212 212
Mar. 141 127 149 157 131 232 155
Apr. 129 103 109 119 116 190 147
May 133 110 132 135 127 157 163
June 149 139 130 128 114 121 182
July 126 112 122 122 110 153 146
Aug. 132 102 109 136 79 105 96
Sep. 131 90 97 106 58 98 110
Oct. 134 119 85 164 92 159 135
Nov. 133 95 152 207 146 202 182
Dec. 189 226 223 218 168 223 234
Totals 1,728 1,525 1,674 1,924 1,527 2,009 2,018
84The next problem is to eliminate the normal seasonal variation. For example, hog prices have a normal tendency to go down in the fall of the year, whereas bank clearings have an equally normal tendency to go up. Obviously, seasonal trends must be eliminated if such series as hog prices and bank clearings are to be compared.
As an average of the fourteen years from 1903 to 1916, inclusive, heavy hog prices at Chicago averaged in January, $6.54; February, $6.83; March, $7.22; April, $7.30; May, $7.10; June, $7.10; July, $7.18; August, $7.14; September, $7.29; October, $7.08; November, $6.65; December, $6.55; average for the entire year, $7. On this basis, January is 93 per cent of the yearly average; February, 98 per cent; March, 103 per cent; April, 104 per cent; May, 101 per cent; June, 101 per cent; July, 103 per cent; August, 102 per cent; September, 104 per cent; October, 101 per cent; November, 95 per cent, and December, 94 per cent. The December average for 1902–1915 is $6.30, or 90 per cent. Obviously, the seasonal variation as just stated in percentages is affected to some extent by the secular trend, for the Decembers of 1902–1915 average 90 per cent, and those of 1903–1916 average 94 per cent. Taking the secular trend out of our seasonal, or adding 2 points to the early months of the year and subtracting 2 points from the last months of the year, we get approximately: January, 95; February, 99; March, 104; April, 105; May, 102; June, 101; July, 103; August, 102; September, 103; October, 100; November, 94, and December, 92.[6]
Hog receipts at Chicago, in the same manner, have a modified seasonal factor of January, 132 per cent; February, 117 per cent; March, 102 per cent; April, 85 per cent; May, 99 per cent; June, 99 per cent; July, 87 per cent; August, 87 per cent; September, 74 per cent; October, 86 per cent; November, 103 per cent; December, 129 per cent.
For bank clearings outside of New York City, the modified seasonal factors are: January, 109; February, 93; March, 104; 85April, 100; May, 99; June, 97; July, 98; August, 90; September, 93; October, 108; November, 103, and December, 106.
After securing normal seasonal variation, the next step is to modify secular trend for seasonal variation. Secular trend of hog prices, as modified seasonally, is portrayed in Chart II. The secular trend price of hogs in January, 1903, is $5.19, which sum, multiplied by the seasonal factor 96, gives $4.98 as the secular price of hogs modified seasonally for January, 1903. The actual price was $6.60, or $1.62 above the secular modified seasonally, or 31 per cent greater than the secular price of $5.19. In this way the percentage of departure for each month from 1903 thru 1916 may be figured. This has been done for hog prices, hog receipts and bank clearings outside of New York City.[7]
Now, as it happens, hog receipts are a much more violently fluctuating series than bank clearings outside of New York City. To put the series on an even footing, resort is made to what is known as the standard deviation. To secure the standard deviation of hog price percentage departures, add up the squares of these departures. The total for the 168 months from 1903 thru 1916 is 31,894, or, dividing by 168, we get 190. The square root of 190 is 13.8, which is the standard deviation of hog prices. Standard deviation means that the probabilities are that on the average not more than one out of three of the series of figures under consideration will exceed the standard deviation. Standard deviation for hog receipts is 15, and for bank clearings 8.7. This indicates that hog receipts depart from the secular trend as modified seasonally with nearly twice as great violence as do bank clearings.
To put all three series on the same footing, we divide the percentage departures by the standard deviation, 13.8 in the case of hog prices, 15 in the case of hog receipts, and 8.7 in the case of bank clearings. In January of 1903, for example, hog prices were greater than the secular modified seasonally by 2.3 times the standard deviation; hog receipts were less by .3 of the standard deviation, and bank clearings were over by .9 of the standard deviation. The cycles of the hog prices, hog receipts and bank clearings, as secured in this way by reducing for standard deviation, are comparable. The results are charted in Charts III, IV, V.
86
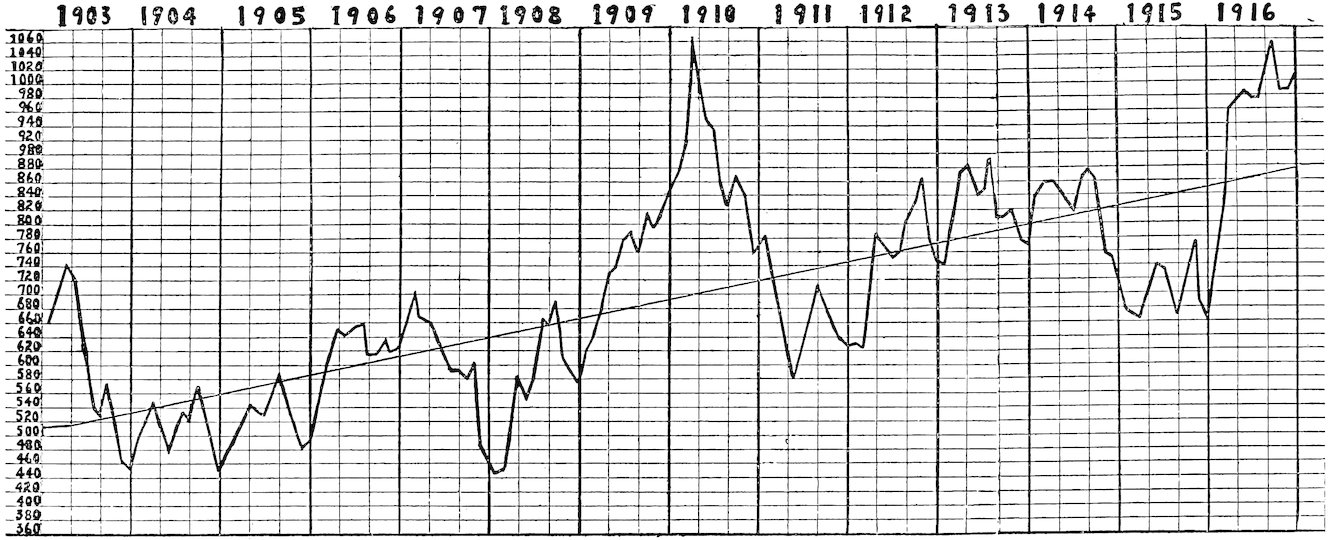
Chart I—Irregular line represents actual Chicago hog prices. Straight line represents secular trend.
87
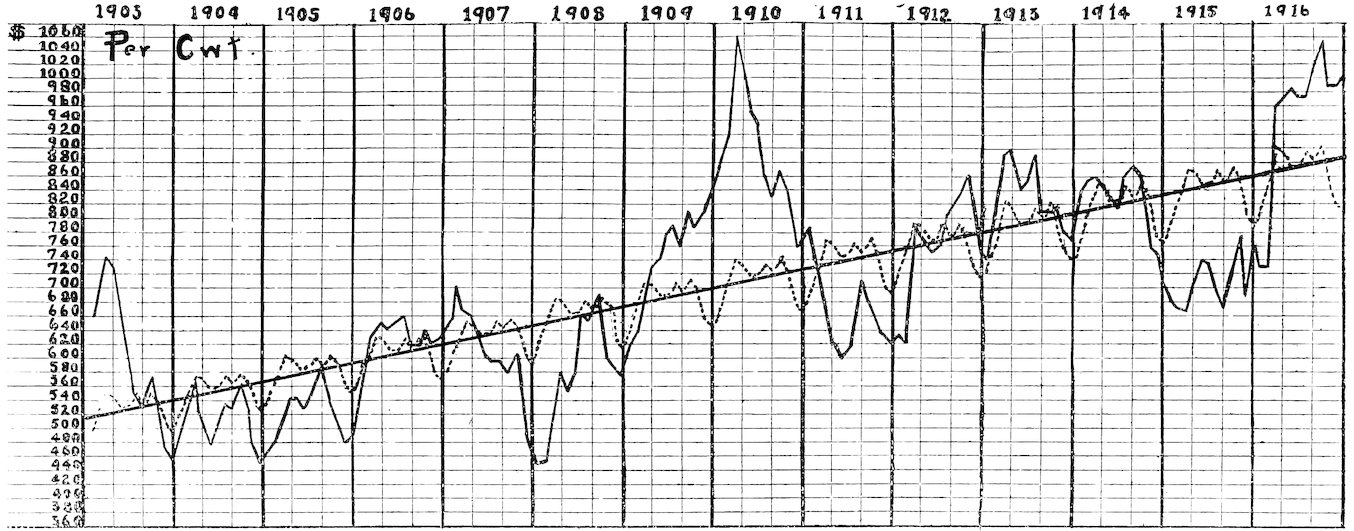
Chart II is identical with Chart I except that the dotted line has been added, which represents the secular trend as corrected seasonally.
88It may be seen from examining these charts that hog prices seem to be related directly to bank clearings and inversely to hog receipts. The problem is: Blend hog receipts and bank clearings together in such a way as to secure hog prices. The mathematical method of approach is by correlation coefficients and lines of regression.
First, a simple illustration of the method of securing correlation coefficients:
Take the two series, A and B, which deviate from their respective means by the amounts stated in Columns 2 and 3. In Column 1 is the year, which has nothing to do with the mathematics of the case. Column 4 is A squared, Column 5 is B squared, and Column 6 is A multiplied by B.
1 2 3 4 5 6
A B A squared B squared A times B
1901 −3 −5 9 25 +15
1902 −1 +1 1 1 −1
1903 +2 +3 4 9 +6
1904 +2 +1 4 1 +2
Sum 18 36 +22
The standard deviation of A is the square root of the sum of the A squares, or 18, divided by 4. The square root of 18 divided by 4 is 2.1. Standard deviation of B, in like manner, is 3. The sum of AB divided by 4, or +22 divided by 4, equals +5.5. The correlation coefficient is +5.5 divided by the standard deviation of A multiplied by the standard deviation of B, or 5.5 divided by 6.3, which gives +.87. A correlation coefficient of .87 is very high, perfect correlation being 1. Correlation over .5 is considered fairly good, especially if there is a long list (fifty or more) of figures in each series.
The formula for determining A in terms of B is:
A equals r(σa σb)B
89In this formula, r is the correlation coefficient and σa is the standard deviation of A, and σb is the standard deviation of B. Substituting for the specific problem, we get:
A equals .87(2.1 3.0)B or
A equals .609 B
When B is −5 we would expect A to be 3.05; when B is +1 we would expect A to be +.609; when B is +3, we would expect A to be 1.827.
Suppose now, in addition, that there are three series: A, B and C, and that the object is to determine A in terms of B and C. The three series stand:
A B C
1901 −3 −5 +2
1902 −1 +1 +3
1903 +2 +3 −3
1904 +2 +1 −2
We already know that the standard deviation of A is 2.1, and of B is 3.0, and that the correlation coefficient between A and B is +.87. Using the customary method, we find that the standard deviation of C is 2.55 and that the correlation coefficient of A and C is −.89, and of B and C −.59. To find A in terms of B and C, we use the following formula:
A equals (rab − racrbc 1 − r2bc)(σa σb)B + (rac − rabrbc 1 − r2bc)(σa σc)C
In this formula rab means correlation coefficient between A and B, etc.; σa means standard deviation of A.
Substituting, we get:
A equals (+.87 − .53 .65)(2.1 3.0)B − (−.89 + .51 .65)(2.1 2.55)C or, A equals .37B − .49C
90
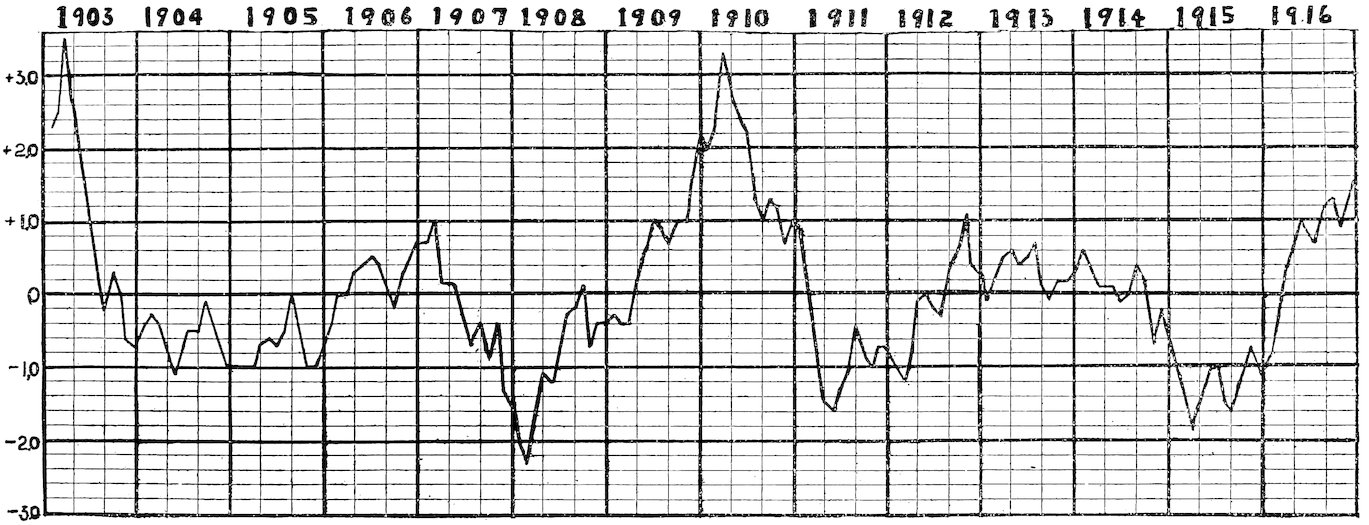
Chart III. Cycles of hog prices secured by dividing the percentage deviation of actual prices from the secular corrected seasonally, by the standard deviation.
91
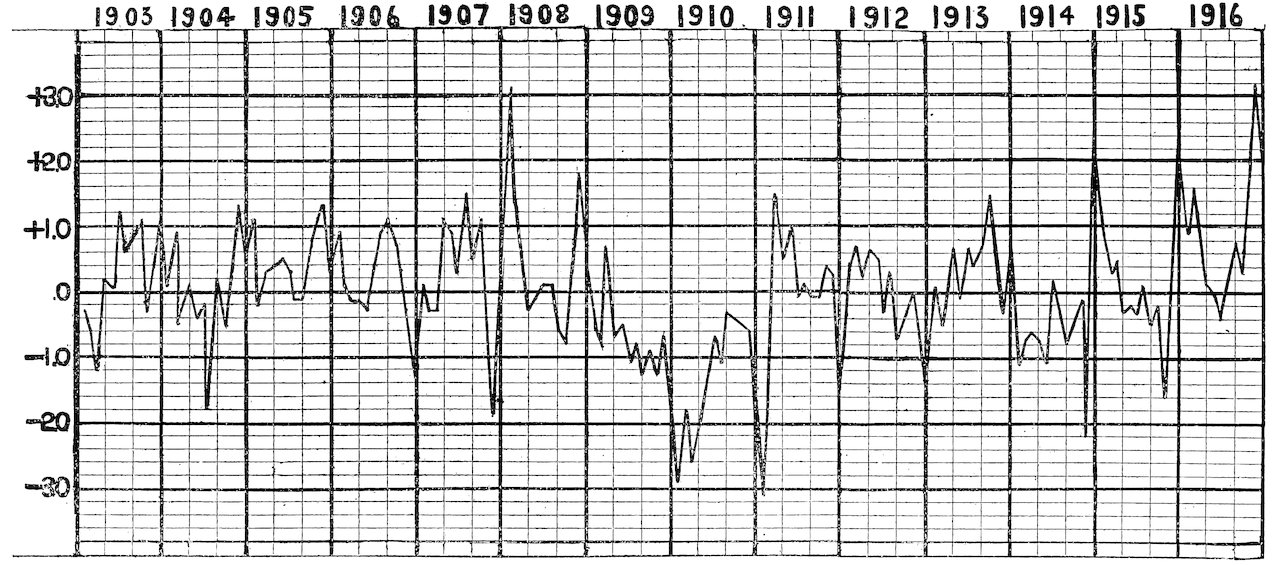
Chart IV—Cycles of hog receipts, secured by dividing the percentage deviation from secular trend corrected seasonally, by the standard deviation.
92
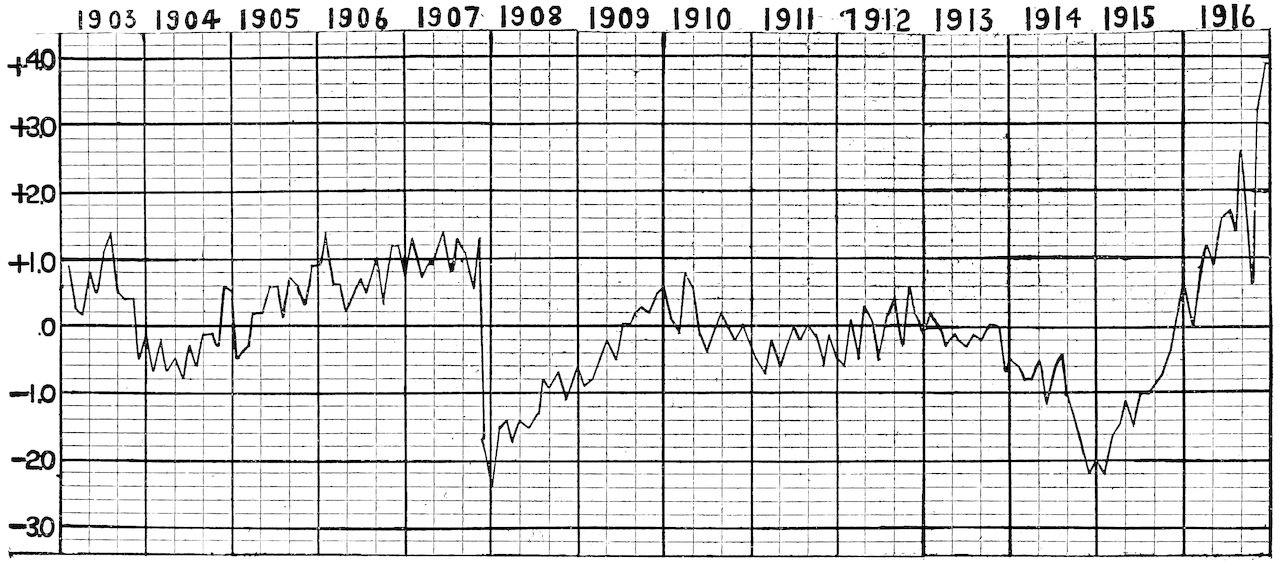
Chart V—Cycles of bank clearings outside of New York City, secured by dividing the percentage deviation from the secular trend corrected seasonally, by the standard deviation.
93Applying this formula, we find that when C is +2 and B is −5, as in the year 1901, we would expect A to be −2.83, and when C is +3 and B is +1, as in 1902, we would expect A to be −1.1. In like manner, in 1903, we would expect A to be +2.60 and in 1904 +1.35.
The results expressed in a table are:
Actual A A as predicted by formula from B and C
1901 −3 −2.83
1902 −1 −1.10
1903 +2 +2.60
1904 +2 +1.35
The practical problem is to express hog prices in terms of hog receipts and bank clearings. Practically the same method is used with the 168 months from 1903 thru 1916, as with the four years which have just been used for illustration.
The standard deviations are 10.1 for hog receipts, 10.5 for hog prices and 9.8 for bank clearings. The correlation coefficients are +.39 between hog prices and bank clearings, +.26 between hog receipts and bank clearings, and −.4 between hog receipts and hog prices.
Using the formula:
A equals r(σa σb)B
and allowing A to represent hog prices and B to represent bank clearings, we get:
Hog prices equal .39(10.5 0.8) bank clearings, or
Hog prices equal .417 bank clearings
This formula is converted back into percentage departures from secular trend modified seasonally, and finally into hog prices as affected by bank clearings. The demand, or bank clearing, price, of hogs as compared with the actual is shown in Chart VI.
In like manner we get:
Hog prices equal −.4(10.5 10.1) hog receipts, or
Hog prices equal −.426 hog receipts
This formula is converted back into percentage departures from the secular trend modified seasonally, and finally into hog prices as affected by hog receipts. The supply price of hogs as compared with the actual is shown in Chart VII.
94
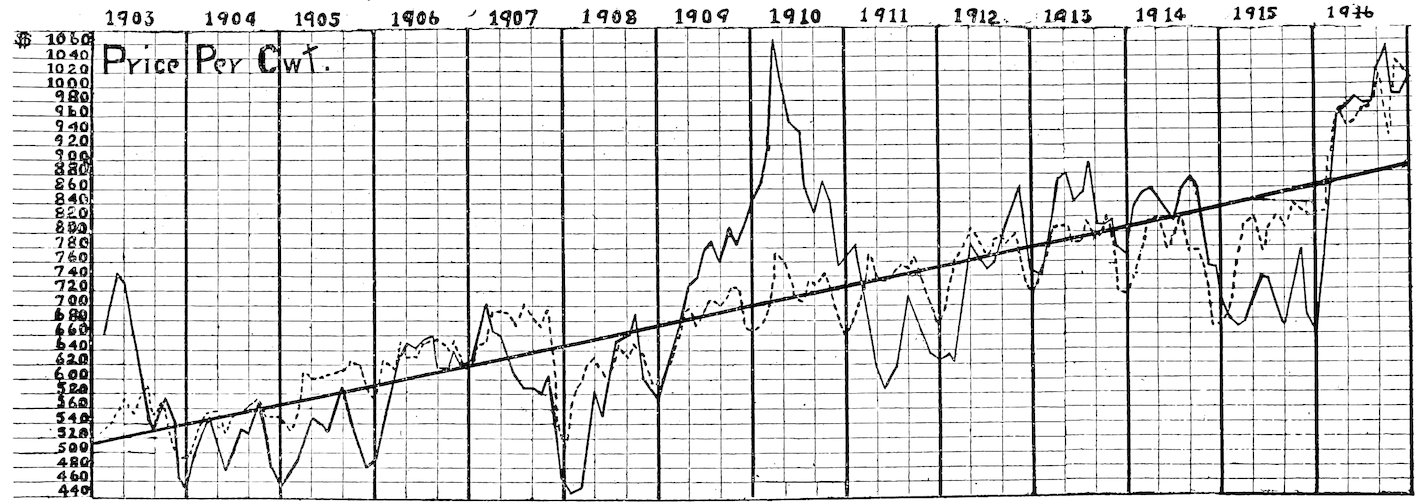
Chart VI—Dotted line is the demand price of hogs, based on bank clearings. Irregular solid line is actual price, and straight line is secular trend.
95
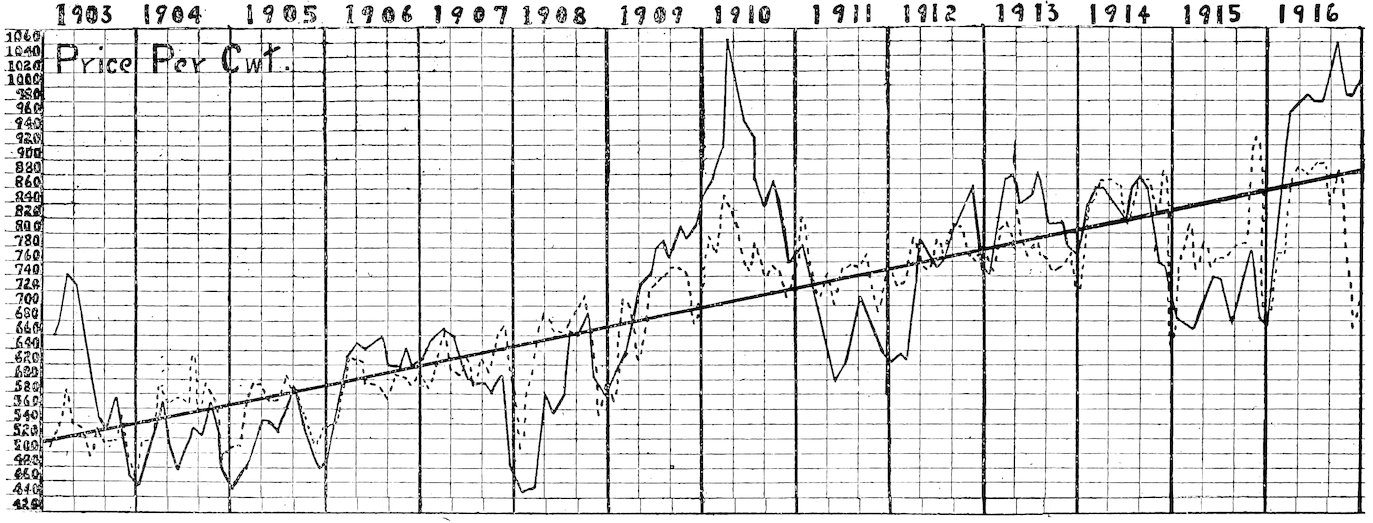
Chart VII—Dotted line is supply price of hogs, based on receipts at Chicago. Irregular solid line is actual price, and straight line is secular trend.
96
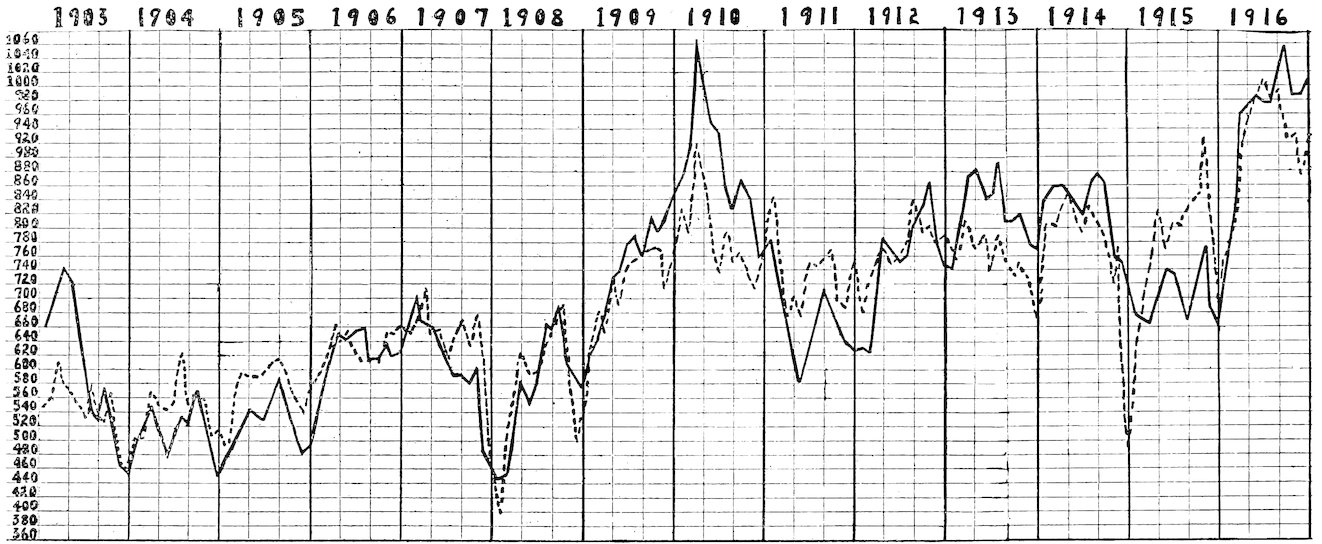
Chart VIII—Dotted line is supply-and-demand price of hogs, based on bank clearings and hog receipts. Irregular solid line is actual price.
97Using the longer formula on page 89, we get: Hog prices equal .56 bank clearings minus .56 hog receipts. Or converted into percentage departures from the secular trend corrected seasonally: .90 of bank clearings in percentage departures minus .51 of hog receipts in percentage departures equals the percentage which hog prices depart from their secular corrected seasonally. For instance, in January, 1903, bank clearings were 8 per cent above the secular corrected seasonally, and hog receipts were 5 per cent below. Eight times .90 plus 5 times .51 gives 9.7 as the percentage which we would expect hog prices to be over their secular corrected seasonally. The secular for January, 1903, was $5.19; 9.7 per cent of $5.19 gives 50 cents. The secular corrected seasonally for January, 1903, is $4.98. Add 50 cents to $4.98 and we get $5.48 as the price which we would have expected heavy hogs to sell at Chicago in January, 1903, on the basis of good business and small hog receipts. Actually, hogs sold for $6.60, or $1.12 over the price predicted by formula.
This is done for all the months from 1903 to 1916, and the supply-and-demand price of hogs, as derived from hog receipts at Chicago and bank clearings outside of New York is charted in Chart VIII, in comparison with the actual prices.
98
PREDICTING THE FUTURE OF HOG PRICES
We assume that at the present time, and probably for some time to come, we are on a basis of 90 per cent above 1913 for hog prices, and 100 per cent over 1913 in bank clearings. This conclusion is based to some extent on the reasoning presented in the June monthly supplement of the Harvard Review of Economic Statistics for the year 1919.
On this basis, the secular trend of heavy hog prices at Chicago, modified seasonally, should be roughly as follows for the several years beginning with 1919: January, $14.35; February, $15.07; March, $15.82; April, $15.67; May, $15.22; June, $15.22; July, $15.52; August, $15.22; September, $15.52; October, $15.07; November, $14.16, and December, $13.86.[8] This is on the assumption that hog prices and prices generally will have for their normal mean a level 90 per cent above the 1913 level. It is expected that in a rough way hog prices will depart from this level according to the size of hog receipts and the condition of general business as expressed by bank clearings. (During 1920, and possibly 1921, heavy exports will doubtless have influence.)
The secular trend of bank clearings outside New York, modified seasonally, for the year beginning with 1919, is taken as: January, $13,952,000,000; February, $11,648,000,000; March, $13,056,000,000; April, $12,800,000,000; May, $12,416,000,000; June, $12,416,000,000; July, $12,544,000,000; August, $11,648,000,000; September, $12,032,000; October, $13,824,000,000; November, $13,440,000,000, and December, $13,824,000,000.
The secular trend of hog receipts at Chicago in millions of pounds, modified seasonally, for the period beginning with 1919, is taken as: January, 184; February, 163; March, 143; April, 118; May, 139; June, 139; July, 121; August, 121; September, 103; October, 120; November, 144, and December, 180.
Based on the formula as secured in the preceding chapter (hog price equals .56 bank clearings minus .56 hog receipts), we would expect the following scale of hog prices in January, when receipts 99follow the secular trend (184,000,000 pounds at Chicago), but bank clearings are variable:
Bank Clearings in January. Heavy Hog Prices.
$11,000,000,000 $11.35
11,500,000,000 11.85
16,500,000,000 16.85
In like manner, tables may be made up for each month of the year, the idea being that for each $500,000,000 the bank clearings outside of New York are above or below the secular trend seasonally modified, fifty cents is added to or subtracted from the secular trend hog price seasonally modified. Thus for April the tables would be:
Bank Clearings in April. Heavy Hog Prices.
$ 9,800,000,000 $12.67
12,800,000,000 15.67
15,800,000,000 18.67
Taking the tables as worked out for bank clearings and hog prices, we next modify for hog receipts. An excess of 33,000,000 pounds of hog receipts at Chicago in a month means on the average $1.80 lower prices, and vice versa. Thus, in January, with bank clearings at $13,952,000,000, we would expect the following prices with various sizes of hog receipts:
Hog Receipts (in Pounds). Heavy Hog Prices.
162,000,000 $15.55
184,000,000 14.35
195,000,000 13.75
206,000,000 13.15
228,000,000 11.95
The tables herewith give this problem worked out in detail for the various months. It is realized that at this writing, in early 1920, financial matters are still so deranged by the great war that our secular trend for bank clearings may be wide of the mark. This is the best prediction we can offer at this writing, and we are offering it fully aware of its weakness, but fully believing that predictions of this sort will stimulate more thoro research. It is believed that better measures of demand may eventually be found than bank clearings outside of New York City, and that better measures of supply may be found than receipts at Chicago. Also there is a possibility that the varying size of exports of hog products should be taken into account.
100
PRICE OF HEAVY HOGS PER HUNDREDWEIGHT, AS PREDICTED FROM HOG RECEIPTS AND BANK CLEARINGS OUTSIDE OF NEW YORK CITY.
JANUARY.
Bank Clearings Outside New York. Hog Receipts at Chicago, in Millions of Pounds.
162 173 184 195 206 217 228 239
$13,000,000,000 $14.55 $13.95 $13.35 $12.75 $12.15 $11.55 $10.95 $10.35
13,500,000,000 15.05 14.45 13.85 13.25 12.65 12.05 11.45 10.85
14,000,000,000 15.55 14.95 14.35 13.75 13.15 12.55 11.95 11.35
14,500,000,000 16.05 15.45 14.85 14.25 13.65 13.05 12.45 11.85
15,000,000,000 16.55 15.95 15.35 14.75 14.15 13.55 12.95 12.35
15,500,000,000 17.05 16.45 15.85 15.25 14.65 14.05 13.45 12.85
16,000,000,000 17.55 16.95 16.35 15.75 15.15 14.55 13.95 13.35
16,500,000,000 18.05 17.45 16.85 16.25 15.65 15.05 14.45 13.85
FEBRUARY.
Bank Clearings Outside New York. Hog Receipts at Chicago, in Millions of Pounds.
141 152 163 174 185 196 207 218
$10,600,000,000 $15.27 $13.67 $14.07 $13.47 $11.87 $12.27 $11.67 $11.07
11,100,000,000 15.77 14.17 14.57 13.97 12.37 12.77 12.17 11.57
11,600,000,000 16.27 14.67 15.07 14.47 12.87 13.27 12.67 12.07
12,100,000,000 16.77 15.17 15.57 14.97 13.37 13.77 13.17 12.57
12,600,000,000 17.27 15.67 16.07 15.47 13.87 14.27 13.67 13.07
13,100,000,000 17.77 16.17 15.57 15.97 14.37 14.77 14.17 13.57
13,600,000,000 18.27 16.67 17.07 16.47 14.87 15.27 14.67 14.07
14,100,000,000 18.77 17.17 17.57 16.97 15.37 15.77 15.17 14.57
MARCH.
Bank Clearings Outside New York. Hog Receipts at Chicago, in Millions of Pounds.
121 132 143 154 165 176 187 198
$12,100,000,000 $16.02 $15.42 $14.82 $14.22 $13.62 $13.02 $12.42 $11.82
12,600,000,000 16.52 15.92 14.32 14.72 14.12 13.52 12.92 12.32
13,100,000,000 17.02 16.42 15.82 15.22 14.62 14.02 13.42 12.82
13,600,000,000 17.52 16.92 16.32 15.72 15.12 14.52 13.92 13.32
14,100,000,000 18.02 17.42 16.82 16.22 15.62 15.02 14.42 13.82
14,600,000,000 18.52 17.92 17.32 16.72 16.12 15.52 14.92 14.32
15,100,000,000 19.02 18.42 17.72 17.22 16.62 16.02 15.42 14.82
15,600,000,000 19.52 18.92 18.32 17.72 17.12 16.52 15.92 15.32
APRIL.
Bank Clearings Outside New York. Hog Receipts at Chicago, in Millions of Pounds.
96 107 118 129 140 151 162 173
$11,800,000,000 $15.87 $15.27 $14.67 $14.07 $13.47 $12.87 $12.27 $11.67
12,300,000,000 16.37 15.77 15.17 14.57 13.97 13.37 12.77 12.17
12,800,000,000 16.87 16.27 15.67 15.07 14.47 13.87 13.27 12.67
13,300,000,000 17.37 16.77 16.17 15.57 14.97 14.37 13.77 13.17
13,800,000,000 17.87 17.27 16.67 16.07 15.47 14.87 14.27 13.67
14,300,000,000 18.37 17.77 17.17 16.57 15.97 15.37 14.77 14.17
14,800,000,000 18.87 18.27 17.67 17.07 16.47 15.87 15.27 14.67
15,300,000,000 19.37 18.77 18.17 17.57 16.97 16.37 15.77 15.17
101 MAY.
Bank Clearings Outside New York. Hog Receipts at Chicago, in Millions of Pounds.
117 128 139 150 161 172 183 194
$11,400,000,000 $15.42 $14.82 $14.22 $13.62 $13.02 $12.42 $11.82 $11.22
11,900,000,000 15.92 15.32 14.72 14.12 13.52 12.92 12.32 11.72
12,400,000,000 16.42 15.82 15.22 14.62 14.02 13.42 12.82 12.22
12,900,000,000 16.92 16.32 15.72 15.12 14.52 13.92 13.32 12.72
13,400,000,000 17.42 16.82 16.22 15.62 15.02 14.42 13.82 13.22
13,900,000,000 17.92 17.32 16.72 16.12 15.52 14.92 14.32 13.72
14,400,000,000 18.42 17.82 17.22 16.62 16.02 15.42 14.82 14.22
14,900,000,000 18.92 18.32 17.72 17.12 16.52 15.92 15.32 14.72
JUNE.
Bank Clearings Outside New York. Hog Receipts at Chicago, in Millions of Pounds.
117 128 139 150 161 172 183 194
$11,400,000,000 $15.42 $14.82 $14.22 $13.62 $13.02 $12.42 $11.82 $11.22
11,900,000,000 15.92 15.32 14.72 14.12 13.52 12.92 12.32 11.72
12,400,000,000 16.42 15.82 15.22 14.62 14.02 13.42 12.82 12.22
12,900,000,000 16.92 16.32 15.72 15.12 14.52 13.92 13.32 12.72
13,400,000,000 17.42 16.82 16.22 15.62 15.02 14.42 13.82 13.22
13,900,000,000 17.92 17.32 16.72 16.12 15.52 14.92 14.32 13.72
14,400,000,000 18.42 17.82 17.22 16.62 16.02 15.42 14.82 14.22
14,900,000,000 18.92 18.32 17.72 17.12 16.52 15.92 15.32 14.72
JULY.
Bank Clearings Outside New York. Hog Receipts at Chicago, in Millions of Pounds.
99 110 121 132 143 154 165 176
$11,500,000,000 $15.72 $15.12 $14.52 $13.92 $13.32 $12.72 $12.12 $11.52
12,000,000,000 16.22 15.62 15.02 14.42 13.82 13.22 12.62 12.02
12,500,000,000 16.72 16.12 15.52 14.92 14.32 13.72 13.12 12.52
13,000,000,000 17.22 16.62 16.02 15.42 14.82 14.22 13.62 13.02
13,500,000,000 17.72 17.12 16.52 15.92 15.32 14.72 14.12 13.52
14,000,000,000 18.22 17.62 17.02 16.42 15.82 15.22 14.62 14.02
14,500,000,000 18.72 18.12 17.52 16.92 16.32 15.72 15.12 14.52
15,000,000,000 19.22 18.62 18.02 17.42 16.82 16.22 15.62 15.02
AUGUST.
Bank Clearings Outside New York. Hog Receipts at Chicago, in Millions of Pounds.
99 110 121 132 143 154 165 176
$10,600,000,000 $15.42 $14.82 $14.22 $13.62 $13.02 $12.42 $11.82 $11.22
11,100,000,000 15.92 15.32 14.72 14.12 13.52 12.92 12.32 11.72
11,600,000,000 16.42 15.82 15.22 14.62 14.02 13.42 12.82 12.22
12,100,000,000 16.92 16.32 15.72 15.12 14.52 13.92 13.32 12.72
12,600,000,000 17.42 16.82 16.22 15.62 15.02 14.42 13.82 13.22
13,100,000,000 17.92 17.32 16.72 16.12 15.52 14.92 14.32 13.72
13,600,000,000 18.42 17.82 17.22 16.62 16.02 15.42 14.82 14.22
14,100,000,000 18.92 18.32 17.72 17.12 16.52 15.92 15.32 14.72
102 SEPTEMBER.
Bank Clearings Outside New York. Hog Receipts at Chicago, in Millions of Pounds.
81 92 103 114 125 136 147 158
$11,000,000,000 $15.72 $15.12 $14.52 $13.92 $13.32 $12.72 $12.12 $11.52
11,500,000,000 16.22 15.62 15.02 14.42 13.82 13.22 12.62 12.02
12,000,000,000 16.72 16.12 15.52 14.92 14.32 13.72 13.12 12.52
12,500,000,000 17.22 16.62 16.02 15.42 14.82 14.22 13.62 13.02
13,000,000,000 17.72 17.12 16.52 15.92 15.32 14.72 14.12 13.52
13,500,000,000 18.22 17.62 17.02 16.42 15.82 15.22 14.62 14.02
14,000,000,000 18.72 18.12 17.52 16.92 16.32 15.72 15.12 14.52
14,500,000,000 19.22 18.62 18.02 17.42 16.82 16.22 15.62 15.02
OCTOBER.
Bank Clearings Outside New York. Hog Receipts at Chicago, in Millions of Pounds.
98 109 120 131 142 153 164 175
$12,800,000,000 $15.27 $14.67 $14.07 $13.47 $12.87 $12.27 $11.67 $11.07
13,300,000,000 15.77 15.17 14.57 13.97 13.37 12.77 12.17 11.57
13,800,000,000 16.27 15.67 15.07 14.47 13.87 13.27 12.67 12.07
14,300,000,000 16.77 16.17 15.57 14.97 14.37 13.77 13.17 12.57
14,800,000,000 17.27 16.67 16.07 15.47 14.87 14.27 13.67 13.07
15,300,000,000 17.77 17.17 16.57 15.97 15.37 14.77 14.17 13.57
15,800,000,000 18.27 17.67 17.07 16.47 15.87 15.27 14.67 14.07
16,300,000,000 18.77 18.17 17.57 16.97 16.37 15.77 15.17 14.57
NOVEMBER.
Bank Clearings Outside New York. Hog Receipts at Chicago, in Millions of Pounds.
122 133 144 155 166 177 188 199
$12,400,000,000 $14.36 $13.76 $13.16 $12.56 $11.96 $11.36 $10.76 $10.16
12,900,000,000 14.86 14.26 13.66 13.06 12.46 11.86 11.26 10.66
13,400,000,000 15.36 14.76 14.16 13.56 12.96 12.36 11.76 11.16
13,900,000,000 15.86 15.26 14.66 14.06 13.46 12.86 12.26 11.66
14,400,000,000 16.36 15.76 15.16 14.56 13.96 13.36 12.76 12.16
14,900,000,000 16.86 16.26 15.66 15.06 14.46 13.86 13.26 12.66
15,400,000,000 17.36 16.76 16.16 15.56 14.96 14.36 13.76 13.16
15,900,000,000 17.86 17.26 16.66 16.06 15.46 14.86 14.26 13.66
DECEMBER.
Bank Clearings Outside New York. Hog Receipts at Chicago, in Millions of Pounds.
158 169 180 191 202 213 224 235
$12,800,000,000 $14.06 $13.46 $12.86 $12.26 $11.66 $11.06 $10.46 $ 9.86
13,300,000,000 14.56 13.96 13.36 12.76 12.16 11.56 10.96 10.36
13,800,000,000 15.06 14.46 13.86 13.26 12.66 12.06 11.46 10.86
14,300,000,000 15.56 14.96 14.36 13.76 13.16 12.56 11.96 11.36
14,800,000,000 16.06 15.46 14.86 14.26 13.66 13.06 12.46 11.86
15,300,000,000 16.56 15.96 15.36 14.76 14.16 13.56 12.96 12.36
15,800,000,000 17.06 16.46 15.86 15.26 14.66 14.06 13.46 12.86
16,300,000,000 17.56 16.96 16.36 15.76 15.16 14.56 13.96 13.36
103
LIMITATIONS OF THE MATHEMATICAL METHOD
Such a mathematical formula as: Hog prices equal .56 bank clearings—.56 hog receipts must always be applied with common sense. In November of 1914, for instance, hog receipts at Chicago were abnormally small on account of foot-and-mouth disease, and in December of the same year they were abnormally large for the same reason. Judging from receipts, we might have expected heavy hogs to sell for $8.83 in November and $6.44 in December. As a matter of fact, the actual price was $7.50 in November and $7.10 in December. It was commonly recognized by the trade that hog receipts at Chicago in November and December of 1914 were abnormal, and not representative of the potential supply in the country at large.
Occasionally, as in November of 1907, falling prices act to curtail receipts. The small receipts in November, 1907, would have indicated a price of $6.75, whereas the actual price was $4.90. As a matter of fact, there was a large number of hogs that year, and the actual price reflected the potential supply rather than the temporary supply.
It is possible to refine the method considerably. For instance, it may be worth while to proceed on the assumption that the relation between hog prices and hog receipts is best expressed by an equation representative of a hyperbola or skew curve instead of a straight line. The straight line equation, based on the years 1903 to 1915, inclusive, is:
Hog prices equal −.8 −.56 hog receipts.
The hyperbola equation for these years is:
Hog prices equal −1.24 −.55 hog receipts
+.0046 hog receipts squared.
The skew or cubic curve equation is:
Hog prices equal −1.18 −.24 hog receipts
+.0027 hog receipts squared
−.00079 hog receipts cubed.
Using these more complex mathematical methods, it is often possible to express the relationships more exactly. But no method, however far refined, will take the place of common sense market judgment. Nevertheless, it may be decidedly helpful to a better understanding of the normal working of supply and demand to use both hyperbolas and cubic curves on occasion.
104
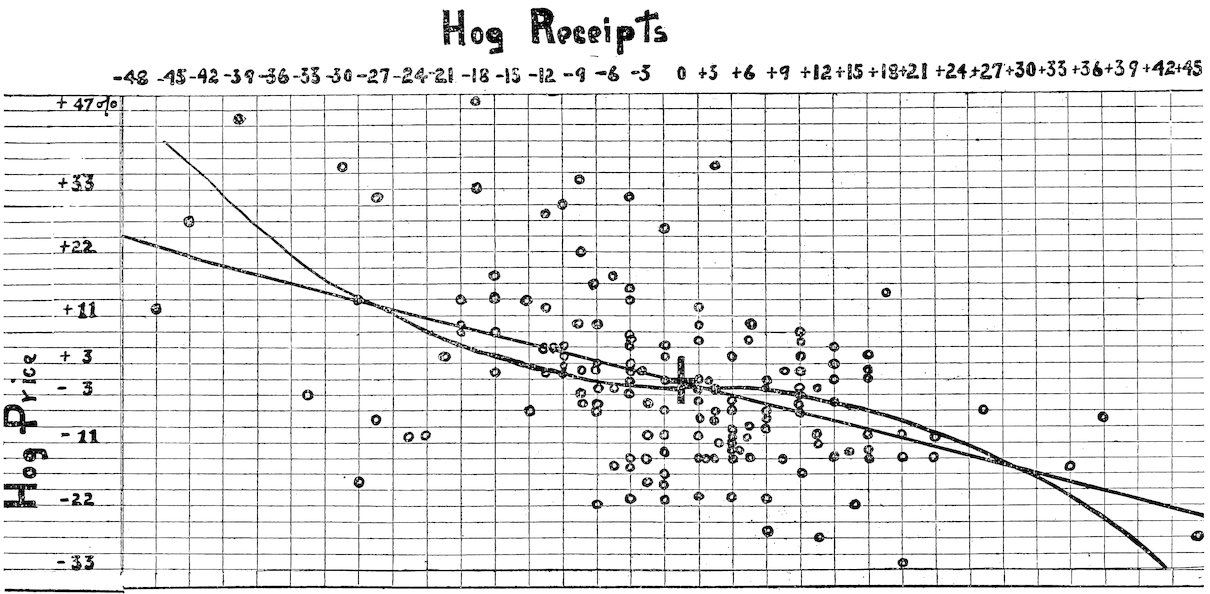
Chart illustrating the straight line as compared with the skew curve, for purposes of expressing the relation between hog receipts at Chicago and hog prices at Chicago. On the basis of the curve when the receipts are 45 per cent less than the secular trend corrected seasonally, the price should be 38 per cent over, and when the receipts are 42 per cent over the secular trend corrected seasonally, the price should be 33 per cent under.
105Other refinements of the mathematical study of hog prices may consist in working out the correlation coefficients between hog prices and receipts at six markets or eleven markets instead of using Chicago receipts alone. Work may be done looking into the relation between hog prices and potential supply as contrasted with the temporary or month-by-month supply. So far as the relation between hog prices and business conditions is concerned, it should be worth while to work out correlation coefficients between hog prices and the amount of new building, or hog prices and Dun’s index number. In fact, there are a great many measures of business activities which may possibly measure the demand for hogs better than bank clearings outside of New York City.[9]
Some people may think it advisable to work out a correlation and line of regression illustrating the relation between hog prices and corn prices. This has been attempted, but it has been found that after the secular and seasonal trends are taken out of both corn prices and hog prices there is practically no relation between them. It is a curious commentary on our present marketing systems that corn prices and hog prices, while very closely related decade by decade, have very little influence on each other month by month. In other words, changing costs of production can have practically nothing to do with the month-by-month changes in the market price under our present economic system. Unusually high corn prices today are more likely to influence the hog prices of next year than the hog prices of today.
After everything has been done which can be done by mathematical method, there will still be room for common sense judgment. But such judgment is best applied by men wise in market lore, men familiar with the technique of production, and who also are familiar with such mathematical methods as are here described.
106
CONCLUSIONS BASED ON RATIOS AND MATHEMATICS OF SUPPLY AND DEMAND
By means of corn-hog ratios, it is possible to determine with great accuracy month by month the production cost of one hundred pounds of hog flesh. The actual price, however, has been quite different from the cost-of-production price, except as an average of long periods of time. This is indicated by the profit and loss chart on page 32, the black areas above and below the zero line indicating the departure of the actual price from the ratio or cost of production price.
The actual price heretofore has been determined chiefly by the action of supply and demand and not by cost of production. The close agreement between actual price and the supply-and-demand price as based on a formula derived from bank clearings and hog receipts is shown on page 96. In the chart on page 107 are presented the cost-of-production price based on ratios and the supply-and-demand price as based on bank clearings and hog receipts.
The ratio or cost-of-production price is much steadier than the supply-and-demand price. If the farmers could arrange with the packers for a price more nearly representing the cost-of-production or ratio price, it is obvious that the supply of hogs might be considerably steadied. Once farmers realize that neither excessive profits nor excessive losses are to be expected in the hog business, they will steady down to producing about the same number of hogs each year, and they will send them to market in a uniform stream, instead of in irregular spurts.
Of course, there are always uncertainties in the way of weather, disease, etc. Hot, dry weather in July and August may curtail the corn crop and shoot up the price of corn and the cost of producing hogs. Such hot, dry weather immediately increases the cost of producing hogs. The packers, heretofore, have been either unable or unwilling to pay a price for hogs sufficient to cover the increased cost of production caused by the hot, dry weather, and as a result they have been compelled to pay more than cost of production a year or so later. Why shouldn’t the packers and farmers constantly educate the public to pay the cost-of-production price? Tell the public that the drouth and high corn prices have increased the cost of producing hogs, and the price must be increased to prevent a shortage next year. Why shouldn’t the farmers try to find a way to regulate the supply with an iron hand, in an endeavor to maintain approximately the cost-of-production price at all times? This means willingness to lower the price of hogs in years when the corn crop is large, as well as ability to raise the price in years of a short corn crop.
107
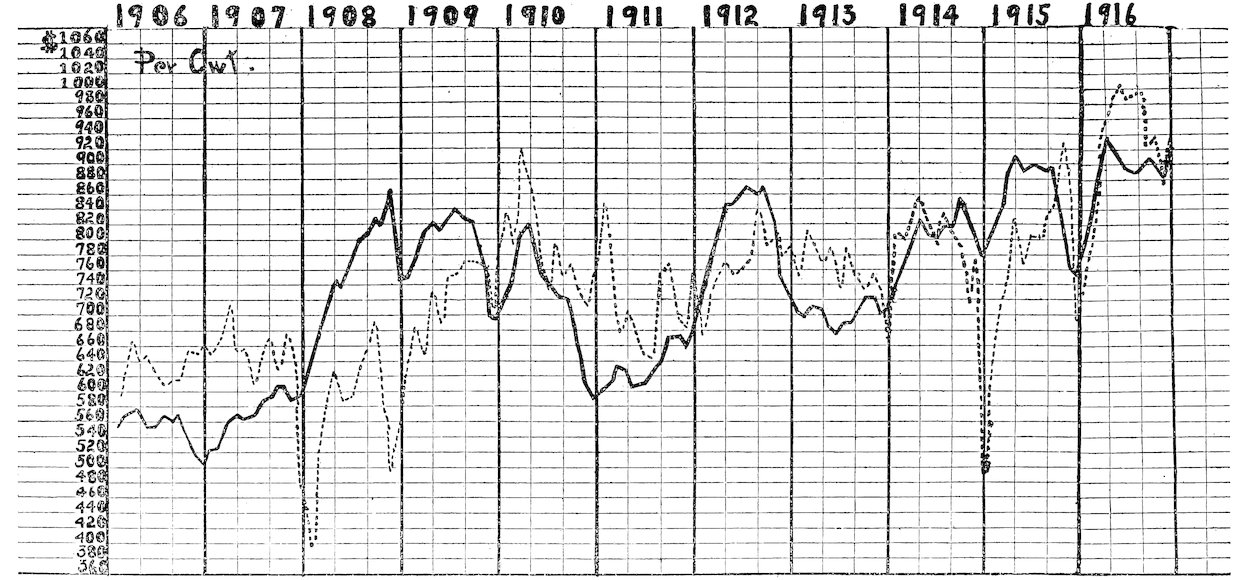
Dotted line represents the supply-and-demand price of hogs as derived from bank clearings and hog receipts. Solid line represents cost of producing hogs, based on corn-hog ratios.
108Unquestionably there are vagaries in the consuming demand for pork which might make the payment of a cost-of-production price difficult for a time. It is believed, however, that powerful corn belt farmers’ organizations working in co-operation with the packers should be able to educate consumers to the cost-of-production idea, and so far as seasonal vagaries in the demand are concerned, the farmers and packers should be able to come to an agreement providing for paying rather more than the demand price for hogs in times of poor demand and rather less than the demand price for hogs in times of good demand, in an effort to make price meet cost of production rather than temporary demand idiosyncrasies.
It is realized that the difficulties in the way of paying cost of production at all times are even greater than here indicated. The idea, in fact, runs counter to the laissez faire, competitive price system under which business is conducted today. It is believed, however, that in the future more and more attention must be paid to production and less and less to price manipulation. To this end, products must be sold at all times as nearly as possible at the cost-of-production price. There must be no prospect of unusual profit or unusual loss in the production of staple products. We are now referring to industries as a whole. It is inevitable, of course, that certain individuals will make great profits and others will incur losses, even in years when the cost-of-production or ratio price is paid. Full consideration must always be given to the physical facts and to special emergencies as they arise. Standard ratios representing cost of production for an industry may suddenly be rendered out-of-date by a new invention. New situations must be recognized frankly, but at all times the guiding motive should be to pay the cost-of-production price, in order that supply and demand may operate more smoothly.
To give the cost of production price broader sway in our price system does not necessarily involve governmental control. The first step is education in price judging. Even in the grade schools and country schools, ratio methods of price judgment should be taught. In high schools the matter may be carried farther, and it is suggested that not only should the ratio method of price judging be taught in high school, but also the practical use of correlation 109coefficients and lines of regression in determining prices from business conditions and the supply. In college (and the colleges have been most neglectful in this matter) specific problems should be worked out in great detail. Students in such classes should have access to adding machines, calculating machines, rechentaffels, and other modern devices for making calculations easy and accurate. But the most important thing of all just now is adequate research by colleges, by experiment stations, and by governmental departments. The government and market agencies must continue to improve their statistical records, and research students must study these records with all the refinements of statistical method.
An excellent start along this line has been made by the Harvard University Committee on Economic Research. This committee seems to be concerned altogether with the industrial world. It is essential that the agricultural world be given similar service.
The object of it all is to discover the best possible kind of machinery thru which the law of supply and demand may work to the end that violent fluctuations in supply and demand may be reduced to the lowest possible point consistent with changing weather and unforeseeable accidents. The present price system is not perfect; it can be improved. But before improvements can be made, the present system must be studied with the greatest thoroness. The great weakness of the present price system is that the men who operate it are concerned chiefly with making the greatest possible profit, and not at all with making the law of supply and demand operate smoothly on a price level roughly equivalent to cost of production.
The highest purpose of our price system should be to tell producers truthfully what to do in the future, instead of capitalizing a temporary supply and demand situation to the advantage of certain bright speculators. The $4.50 price for hogs in January of 1908 was a lie so far as it guided the future action of hog producers. So also was the $11 price in March of 1910. Both prices told the approximate truth about a temporary supply-and-demand situation. But both were fundamentally lies. Our whole laissez faire system is full of lies of this sort. Surely we have enough in the way of legitimate physical handicaps such as weather and pests so that we should be willing to run our price system more truthfully.
So far as farmers are concerned, the object of studies of this kind is, first, to play the price game as well as capital and labor; and, second, to co-operate with capital and labor to enforce prices 110roughly equivalent to cost of production, to the end that supply and demand may operate more smoothly.
It is anticipated that greater emphasis on “cost-of-production price” and less emphasis on “supply-and-demand price” will result in gradually replacing most business men with production engineers and statistical economists. Business men have had profit as their sole motive. What we need is production engineers whose chief concern is production methods, and statistical economists who are able to understand the delicate inter-relations of different industries. It is believed that there is in most men a desire to do their work well, and that this desire will find more complete expression, to the benefit of the bulk of the people, under the guidance of men whose supreme motive is not profit but technical understanding and love of the work to be done. All this concerns the farmer, to the extent that when the industrial world shifts to this kind of basis, he may be more certain of a stable price for his products.
Substituting production engineers and statistical economists for business men means doing away with the chance of excessive gains and excessive losses. And this is proper so far as production of and trade in staple products is concerned.
The only place where the commercial imagination of the old-fashioned risk-taking business men has legitimate place is in working with things which are not staple, such as theaters, luxuries, newspapers, etc.
111
APPENDIX
113
SUGGESTIONS CONCERNING THE TABLES IN THE APPENDIX
The man who studies the figures as to receipts, prices, etc., as they unroll day by day and month by month in the great central markets gradually develops market judgment. Of course, there is more in the market than figures, but a thoro understanding of statistical relationships, of normal seasonal trends, etc., is necessary before one can fully appreciate the extraordinary or strategical considerations which are occasionally involved.
It is suggested that those who are really interested in prices should fill in month by month in the blank tables the figures as they become available. Sources of current figures are the Market Reporter, published weekly by the United States Department of Agriculture; the daily live stock papers published at the great central markets; the Monthly Crop Reporters, published by the United States Department of Agriculture, and, so far as retail prices are concerned, the monthly publications of the Bureau of Labor Statistics. It is hoped that eventually the Bureau of Markets of the United States Department of Agriculture will have available exceedingly valuable figures. At present, however, the Bureau of Markets figures are practically worthless because they have not been continued long enough to have sufficient background to enable anyone to judge them properly.
The effort has been made in the prices here collected to cover the period immediately preceding the war quite thoroly, in order that those who are interested may work out normal pre-war relationships.
In all price questions, the problem of grade is involved. Gradually the grade classifications have been made more and more scientific, but even to this day there is haziness in certain products, notably cattle. It is believed, therefore, that the cattle prices are more unreliable than any other. Scientific grading of cattle is possible, and will be adopted as soon as the producers are in position to demand it.
Market figures furnish the laboratory of economics. It is believed that it is as essential for students at agricultural colleges to do laboratory work in economics as it is for them to spend such a large part of their time in the chemical, zoological or botanical laboratories. When the agricultural students judge marketable live stock, it is suggested that they be required to estimate the 114weight, grade, dressing percentage and probable Chicago price. An ingenious teacher, who is familiar with economics and market grades of grain and live stock, can think of many devices to bring home to his students the fact that the market is a living thing, yet subject to certain laws which are almost as exact as Mendel’s law of inheritance.
The author will appreciate being informed of any mistakes in the figures. Great pains have been taken to make them accurate, but it is inevitable that a few mistakes will creep in.
The following gives a description of grades and sources of information for some of the products for which figures are given in the tables of the Appendix:
HEAVY HOG PRICES AT CHICAGO.
From 1896 to date, heavy hog prices, as compiled by Chas. A. S. McCracken for the Chicago Drovers’ Journal Year Book, have been used. From 1881 to 1895, inclusive, the average of the range of Chicago hog prices, as compiled by the Cincinnati Price Current, has been used. Properly speaking, these prices refer more nearly to average hogs than to heavy hogs. Previous to 1881, prices have been compiled from the Chicago Board of Trade Reports, the grade known as heavy packers and shippers being used so far as possible.
CORN PRICES AT CHICAGO.
No. 2 mixed has been used thruout. From 1880 to 1916, inclusive, the average of the high and low for the month has been taken. Since January, 1917, each day of the month has been averaged. Previous to 1880, averages were taken either weekly or semi-monthly. All figures are derived either from the Howard-Bartels Red Book or the Chicago Board of Trade Reports. The two sources generally agree.
OATS PRICES AT CHICAGO.
Previous to 1876, the grade known as No. 1 was chiefly used. Since 1876, No. 2, Standard or Contract oats has been used. Previous to 1881, averages were taken weekly or semi-monthly. Since 1881, the high and low for the month have been averaged. Previous to 1881, Chicago Board of Trade Reports were used. Since 1881, the Howard-Bartels Red Books have been used, which quote practically the same figures as the Board of Trade.
WHEAT PRICES AT CHICAGO.
Previous to 1883, the grade known as No. 2 Spring was used, weekly or semi-monthly averages being taken from the Chicago Board of Trade Reports. From 1883 to 1903, inclusive, there is a slight confusion in grades, but the No. 2 Spring is used chiefly, averages of high and low for the month being taken from the Howard-Bartels Red Book.
From 1904 to 1913, inclusive, prices are based on No. 2 Red and No. 1 Northern, the high of the one and the low of the other being used. From 1914 on, prices are based on No. 2 Red, No. 2 Hard and No. 1 Northern, 115the highest of the highest-priced grade and the lowest of the lowest-priced grade being averaged.
LIVE STOCK PRICES AND RECEIPTS.
Practically all of the live stock figures since 1903 have been compiled from the Chicago Drovers’ Journal Year Books. Mr. Chas. A. S. McCracken has compiled the price figures from actual transactions day by day in the stockyards for the past thirty years, and is still with the Drovers’ Journal. The original source for live stock receipts is the stock yards companies, but we have used the reports of the Drovers’ Journal. For the years 1903, 1904 and 1905, for receipts at six markets, we have used figures furnished by Mr. M. F. Horine, statistician for the Chicago Union Stock Yards. These figures seem to be comparable with the figures for the later years, except in the case of cattle, where there is evidently some confusion in the counting of calves. The cattle receipts at six markets, as published by 1903, 1904 and 1905 reports, are about 8 per cent too large to be truly comparable with the later years.
RETAIL PRICES.
Retail price figures are taken from the publications of the Bureau of Labor Statistics. Concerning the significance of these figures, the following statement of Royal Meeker, Commissioner of Labor Statistics, is of value: “We secure retail prices of 44 articles of food from 50 cities on the 15th of each month. The stores selected are those patronized by wage-earners. The goods carried are standard grades and brands. The Bureau requests that these grades and brands be uniform thruout the year, as nearly as possible. Some of these stores are ‘cash-and-carry,’ and some of them deliver, depending on the locality in which they are situated. The Bureau makes every effort to have each city represented by a sufficient number of stores so the prices published for that city will represent the average prices charged to the wage-earner. Of course, the chances are that there will be differences, as we do not carry either the high-class stores or the cut-rate stores.”
116 CHICAGO HEAVY HOG PRICES.
1860. 1861. 1862. 1863. 1864. 1865. 1866. 1867. 1868. 1869. Ten-yr. av.
$ $ $ $ $ $ $ $ $ $ $
January 4.85 5.05 2.35 3.60 5.90 11.15 9.30 6.10 6.60 10.15 6.51
February 5.25 5.00 2.50 4.05 6.35 11.30 9.45 6.50 7.75 10.35 6.85
March 5.05 4.75 3.00 4.15 6.55 11.15 9.40 6.60 8.65 9.85 6.92
April 4.90 4.55 2.90 4.25 6.95 9.50 8.55 6.80 8.55 9.75 6.67
May 4.80 3.85 2.50 3.75 6.45 7.80 8.95 5.90 7.65 8.75 6.08
July 5.20 2.70 2.55 4.25 8.55 9.25 9.40 6.05 8.35 8.95 6.53
August 5.35 2.75 2.60 3.80 8.90 10.85 9.85 6.35 9.15 9.20 6.88
September 5.30 2.80 2.90 4.20 9.50 11.70 9.30 6.15 8.70 9.25 6.98
October 5.30 2.80 2.90 4.10 8.65 12.20 8.65 5.85 7.50 9.30 6.73
November 5.30 2.65 3.45 4.50 9.75 11.15 6.95 5.75 7.00 9.10 6.56
December 4.60 2.45 3.80 5.05 10.05 9.05 5.85 6.60 8.35 9.80 6.56
Yearly aver. 5.06 3.54 2.83 4.16 7.91 10.23 8.69 6.24 8.04 9.44 6.61
1870. 1871. 1872. 1873. 1874. 1875. 1876. 1877. 1878. 1879. Ten-yr. av.
January 9.05 6.60 4.35 3.85 5.20 6.60 7.15 6.45 4.05 2.90 5.62
February 9.00 7.30 4.45 4.20 5.35 6.95 7.95 6.15 3.90 3.70 5.90
March 8.55 6.75 4.45 4.95 5.30 7.50 8.55 5.50 3.70 3.95 5.92
April 8.80 5.60 4.25 5.40 5.50 8.25 8.05 5.55 3.55 3.70 5.87
May 8.75 4.55 4.05 4.90 5.50 7.90 7.15 5.30 3.30 3.50 5.49
June 8.60 3.80 3.90 4.45 5.55 7.00 6.05 4.85 3.50 3.75 5.15
July 9.00 4.40 4.05 4.55 6.05 7.05 7.00 4.95 4.10 3.60 5.48
August 9.50 4.40 4.65 4.60 6.90 7.75 6.15 5.05 4.25 3.40 5.67
September 9.30 4.45 4.90 4.50 7.25 8.00 6.00 5.30 3.95 3.45 5.71
October 7.90 4.30 4.60 4.30 6.00 7.95 5.90 5.35 3.45 3.60 5.34
November 6.85 4.00 4.25 3.85 6.50 7.30 5.75 4.70 2.95 3.85 5.00
December 6.15 4.15 3.75 4.70 6.85 6.95 5.95 4.25 2.70 4.55 5.00
Yearly aver. 8.46 5.03 4.31 4.53 6.00 7.44 6.81 5.29 3.62 3.67 5.51
1880. 1881. 1882. 1883. 1884. 1885. 1886. 1887. 1888. 1889. Ten-yr. av.
January 4.60 5.15 6.60 6.35 5.85 4.60 3.85 4.45 5.40 5.00 5.19
February 4.45 5.90 6.80 6.90 6.70 4.60 4.05 5.20 5.35 4.70 5.47
March 4.45 5.90 6.80 7.25 6.50 4.55 4.15 5.30 5.45 4.75 5.51
April 4.50 5.95 7.10 7.50 5.95 4.55 4.00 5.00 5.50 4.75 5.48
May 4.30 6.05 7.70 7.30 5.55 4.05 4.00 4.60 5.55 4.50 5.36
June 4.30 5.90 7.90 6.50 5.20 4.00 4.15 4.55 5.55 4.35 5.24
July 4.55 6.40 8.20 5.65 5.25 4.55 4.60 5.30 6.10 4.40 5.50
August 4.95 6.50 8.45 5.50 5.70 4.55 4.45 4.75 6.20 4.15 5.52
September 5.25 6.75 8.40 5.20 5.20 4.10 4.35 5.00 6.20 4.20 5.47
October 4.85 6.60 7.65 4.70 4.70 3.80 4.10 4.50 6.05 4.25 5.12
November 4.75 6.20 6.75 4.75 4.45 3.50 3.75 4.85 5.95 3.85 4.88
December 4.75 6.15 6.20 5.20 4.20 3.65 4.25 5.20 5.20 3.60 4.84
Yearly aver. 4.64 6.13 7.38 6.07 5.44 4.21 4.14 4.89 5.71 4.38 5.30
117
1890. 1891. 1892. 1893. 1894. 1895. 1896. 1897. 1898. 1899. Ten-yr. av.
January 3.70 3.55 4.25 7.45 5.30 4.25 3.95 3.35 3.65 3.75 4.32
February 3.95 3.50 4.60 7.95 5.10 4.15 4.10 3.35 4.00 3.80 4.45
March 4.10 4.20 4.55 7.55 4.75 4.60 3.90 3.85 3.90 3.80 4.52
April 4.25 4.80 4.50 7.05 5.00 4.90 3.55 4.05 3.90 3.85 4.59
May 4.05 4.65 4.55 7.40 4.90 4.55 3.30 3.75 4.35 3.90 4.54
June 3.75 4.50 5.00 6.65 4.75 4.65 3.15 3.40 4.10 3.80 4.38
July 3.75 5.10 5.65 5.60 5.30 5.10 3.05 3.50 3.95 4.25 4.53
August 3.80 5.10 5.40 5.05 5.35 4.65 3.05 3.90 3.90 4.55 4.48
September 4.35 4.90 5.15 6.00 5.85 4.10 2.90 4.00 3.85 4.40 4.55
October 4.05 4.50 5.35 6.40 5.15 3.85 3.25 3.75 3.70 4.30 4.43
November 3.80 3.85 5.50 5.70 4.35 3.55 3.25 3.40 3.45 3.90 4.08
December 3.40 3.65 6.15 5.65 4.35 3.50 3.25 3.35 3.40 4.05 4.08
Yearly aver. 3.92 4.36 5.06 6.54 5.02 4.33 3.39 3.64 3.85 4.03 4.41
1900. 1901. 1902. 1903. 1904. 1905. 1906. 1907. 1908. 1909. Ten-yr. av.
January 4.55 5.25 6.40 6.60 4.95 4.70 5.40 6.60 4.45 6.20 5.51
February 4.90 5.40 6.30 7.00 5.25 4.90 6.00 7.05 4.50 6.45 5.78
March 5.00 5.90 6.50 7.45 5.50 5.20 6.30 6.65 5.05 6.80 6.04
April 5.55 5.85 7.10 7.30 5.15 5.45 6.50 6.60 5.85 7.30 6.27
May 5.30 5.80 7.00 6.60 4.75 5.40 6.45 6.35 5.50 7.40 6.06
June 5.20 6.00 7.50 6.05 5.05 5.30 6.55 6.05 5.80 7.80 6.13
July 5.25 5.90 7.80 5.45 5.35 5.60 6.60 5.90 6.55 7.90 6.23
August 5.20 5.95 7.25 5.30 5.25 5.90 6.15 5.90 6.60 7.60 6.11
September 5.25 6.65 7.55 5.75 5.70 5.40 6.15 5.80 6.90 8.10 6.33
October 4.80 6.10 7.00 5.40 5.35 5.10 6.40 6.05 6.05 7.85 6.01
November 4.80 5.70 6.35 4.60 4.80 4.80 6.20 4.90 5.90 8.10 5.62
December 4.75 6.20 6.35 4.50 4.50 4.90 6.25 4.65 5.75 8.45 5.63
Yearly aver. 5.05 5.89 6.93 6.00 5.14 5.23 6.25 6.04 5.74 7.50 5.97
1910. 1911. 1912. 1913. 1914. 1915. 1916. 1917. 1918. 1919. Ten-yr. av.
January 8.70 7.85 6.30 7.40 8.35 6.80 7.30 11.00 16.40 17.60 9.77
February 9.20 7.25 6.25 8.05 8.55 6.70 8.30 12.50 16.70 17.65 10.12
March 10.65 6.70 7.10 8.75 8.60 6.65 9.60 14.90 17.00 19.00 10.91
April 10.00 6.15 7.85 8.80 8.50 7.05 9.70 15.80 17.40 20.30 11.16
May 9.50 5.85 7.70 8.40 8.30 7.40 9.85 16.00 17.45 20.60 11.11
June 9.35 6.15 7.50 8.50 8.15 7.35 9.75 15.65 16.50 20.30 10.92
July 8.60 6.65 7.60 8.95 8.60 6.95 9.75 15.20 17.70 21.65 11.17
August 8.25 7.15 8.05 8.10 8.75 6.70 10.20 17.00 18.90 19.75 11.29
September 8.70 6.75 8.30 8.10 8.60 7.20 10.55 18.30 19.55 17.25 11.33
October 8.45 6.50 8.65 8.15 7.55 7.75 9.85 17.25 17.55 14.25 10.60
November 7.75 6.35 7.75 7.80 7.50 6.85 9.85 17.60 17.70 14.10 10.31
December 7.65 6.25 7.45 7.70 7.10 6.60 10.00 16.95 17.55 13.50 10.08
Yearly aver. 8.89 6.64 7.54 8.23 8.22 7.00 9.56 15.68 17.53 18.00 10.73
118 CHICAGO CORN PRICES.
1860. 1861. 1862. 1863. 1864. 1865. 1866. 1867. 1868. 1869. Ten-yr. av.
$ $ $ $ $ $ $ $ $ $ $
January .48 .29 .23 .47 .82 .90 .38 .70 .86 .55 .568
February .41 .28 .23 .51 .89 .88 .35 .68 .82 .56 .561
March .42 .27 .24 .50 .79 .79 .37 .74 .83 .54 .549
April .46 .30 .26 .47 .92 .63 .42 .93 .82 .54 .575
May .48 .33 .27 .48 1.04 .54 .48 .96 .88 .58 .604
June .46 .23 .26 .48 1.15 .52 .51 .88 .85 .62 .596
July .43 .23 .28 .48 1.30 .56 .56 .80 .88 .81 .633
August .40 .23 .33 .49 1.26 .67 .56 .90 .97 .90 .671
September .37 .21 .29 .60 1.30 .60 .54 1.00 .94 .84 .669
October .38 .22 .34 .79 1.25 .49 .66 1.06 .87 .67 .673
November .32 .22 .31 .88 1.35 .52 .87 .97 .76 .73 .693
December .28 .24 .37 .93 .97 .43 .76 .84 .64 .76 .622
Yearly aver. .407 .254 .284 .590 1.082 .628 .540 .872 .843 .675 .618
1870. 1871. 1872. 1873. 1874. 1875. 1876. 1877. 1878. 1879. Ten-yr. av.
January .72 .47 .41 .31 .55 .66 .43 .44 .42 .30 .471
February .70 .52 .40 .31 .58 .64 .41 .42 .40 .32 .470
March .72 .54 .38 .32 .60 .66 .44 .40 .42 .33 .481
April .82 .54 .40 .34 .63 .71 .47 .46 .40 .32 .509
May .87 .54 .46 .39 .62 .71 .47 .53 .40 .34 .533
June .83 .53 .49 .34 .60 .67 .45 .46 .36 .36 .509
July .83 .51 .41 .36 .62 .70 .46 .48 .38 .36 .511
August .74 .45 .41 .39 .67 .69 .45 .45 .39 .33 .497
September .64 .47 .36 .40 .77 .59 .45 .44 .36 .35 .483
October .60 .47 .33 .38 .76 .55 .44 .43 .34 .41 .471
November .61 .46 .33 .38 .77 .52 .44 .45 .32 .42 .470
December .50 .41 .31 .50 .78 .49 .45 . 44 .31 .41 .460
Yearly aver. .715 .492 .381 .368 .662 .632 .446 .450 .375 .354 .487
1880. 1881. 1882. 1883. 1884. 1885. 1886. 1887. 1888. 1889. Ten-yr. av.
January .39 .37 .62 .60 .54 .37 .37 .36 .49 .34 .445
February .37 .37 .58 .57 .54 .37 .37 .35 .47 .35 .434
March .35 .40 .64 .56 .52 .39 .37 .37 .49 .34 .443
April .34 .42 .74 .53 .50 .45 .37 .38 .52 .34 .459
May .37 .43 .73 .55 .55 .47 .36 .38 .57 .34 .475
June .36 .45 .72 .54 .54 .47 .35 .37 .51 .34 .465
July .36 .48 .78 .50 .53 .47 .40 .36 .48 .36 .472
August .38 .57 .77 .52 .53 .45 .42 .40 .45 .35 .484
September .40 .67 .67 .50 .69 .43 .39 .42 .43 .33 .493
October .40 .68 .65 .48 .50 .42 .35 .42 .43 .32 .465
November .42 .61 .68 .52 .40 .43 .35 .44 .39 .46 .470
December .39 .61 .55 .59 .37 .39 .37 .49 .35 .32 .443
Yearly aver. .378 .505 .678 .539 .518 .426 .373 .395 .465 .349 .463
119
1890. 1891. 1892. 1893. 1894. 1895. 1896. 1897. 1898. 1899. Ten-yr. av.
January .29 .49 .38 .42 .35 .43 .27 .23 .27 .37 .350
February .28 .52 .40 .42 .35 .41 . 28 .23 .29 .35 .353
March .29 .62 .39 .41 .36 .44 .29 .24 .29 .35 .368
April .31 .71 .41 .41 .38 .47 .30 .24 .32 .35 .390
May .34 .62 .70 .42 .38 .52 .29 .24 .35 .33 .419
June .34 .58 .51 .40 .40 .50 .27 .24 .32 .34 .390
July .40 .62 .50 .39 .44 .45 .26 .26 .34 .33 .399
August .48 .63 .52 .38 .53 .40 .23 .30 .32 .32 .411
September .48 .58 .46 .40 .53 .34 .21 .30 .30 .33 .393
October .51 .55 .42 .39 .51 .30 .24 .27 .31 .32 .382
November .51 .64 .42 .37 .50 .28 .24 .27 .33 .32 .388
December .50 .49 .41 .35 .46 .26 .23 .26 .36 .31 .363
Yearly aver. .394 .588 .460 .397 .433 .400 .259 .257 .317 .335 .384
1900. 1901. 1902. 1903. 1904. 1905. 1906. 1907. 1908. 1909. Ten-yr. av.
January .31 .37 .61 .46 .45 .43 .42 .42 .59 .60 .466
February .33 .39 .59 .44 .50 .44 .41 .44 .58 .63 .475
March .36 .42 .59 .44 .53 .47 .42 .44 .62 .66 .495
April .40 .45 .61 .44 .51 .48 .46 .48 .67 .70 .520
May .38 .51 .62 .45 .49 .56 .49 .53 .75 .74 .552
June .40 .43 .66 .50 .49 .54 .52 .53 .71 .74 .552
July .42 .51 .72 .51 .49 .56 .49 .54 .74 .71 .569
August .39 .57 .57 .52 .54 .55 .51 .58 .79 .68 .570
September .41 .57 .60 .49 .53 .53 .50 .62 .80 .66 .571
October .39 .56 .58 .45 .54 .52 .49 .61 .73 .61 .548
November .42 .61 .55 .43 .54 .49 .46 .58 .64 .63 .535
December .38 .65 .51 .42 .46 .46 .46 .60 .60 .64 .518
Yearly aver. .383 .504 .601 .463 .506 .503 .469 .531 .685 .667 .531
1910. 1911. 1912. 1913. 1914. 1915. 1916. 1917. 1918. 1919. Ten-yr. av.
January .65 .47 .67 .49 .63 .73 .76 .99 1.81 1.40 .860
February .65 .47 .65 .50 .62 .73 .76 1.01 1.75 1.31 .845
March .63 .47 .70 .52 .67 .73 .74 1.12 1.72 1.51 .881
April .59 .50 .78 .56 .67 .76 .77 1.45 1.66 1.63 .937
May .60 .54 .79 .58 .70 .77 .74 1.64 1.62 1.77 .975
June .59 .56 .74 .61 .71 .74 .74 1.71 1.59 1.92 .991
July .63 .63 .72 .64 .72 .79 .81 2.00 1.65 2.19 1.078
August .63 .64 .78 .73 .80 .79 .85 1.97 1.71 1.95 1.085
September .55 .67 .74 .75 .78 .72 .87 2.10 1.59 1.53 1.030
October .50 .72 .64 .70 .74 .63 1.00 1.99 1.38 1.39 .969
November .50 .73 .54 .73 .70 .65 1.02 2.10 1.37 1.47 .981
December .48 .70 .51 .70 .65 .72 .92 1.73 1.45 1.47 .933
Yearly aver. .584 .592 .689 .626 .699 .730 .832 1.650 1.608 1.628 .964
120 CHICAGO CORN-HOG RATIOS BY DECADES.
1860–1869. 1870–1879. 1880–1889. 1890–1899. 1900–1909. 1910–1919.
January 11.5 11.9 11.7 12.3 11.8 11.4
February 12.2 12.6 12.6 12.6 12.2 12.0
March 12.6 12.3 12.4 12.3 12.2 12.4
April 11.6 11.5 11.9 11.8 12.1 11.9
May 10.1 10.3 11.3 10.8 11.0 11.4
June 10.2 10.1 11.3 11.2 11.1 11.0
July 10.3 10.7 11.7 11.4 11.0 10.4
August 10.3 11.4 11.4 10.9 10.7 10.3
September 10.4 11.8 11.1 11.6 11.1 11.1
October 10.0 11.3 11.0 11.6 11.0 11.0
November 9.5 10.6 10.2 10.5 10.5 10.6
December 10.5 10.9 10.9 11.2 10.9 10.5
121 CHICAGO OATS PRICES.
1860. 1861. 1862. 1863. 1864. 1865. 1866. 1867. 1868. 1869. Ten-yr. av.
$ $ $ $ $ $ $ $ $ $ $
January .37 .17 .16 .46 .65 .64 .24 .43 .59 .50 .421
February .33 .17 .17 .57 .65 .61 .23 .42 .57 .55 .427
March .32 .15 .18 .56 .64 .53 .25 .47 .58 .56 .424
April .31 .17 .19 .59 .67 .42 .28 .58 .60 .56 .437
May .30 .18 .25 .56 .68 .39 .32 .70 .69 .62 .469
June .28 .14 .26 .58 .73 .48 .32 .65 .67 .62 .473
July .27 .15 .27 .56 .78 .44 .30 .62 .67 .68 .474
August .20 .16 .32 .38 .69 .42 .28 .53 .56 .52 .406
September .20 .14 .31 .47 .65 .33 .33 .50 .54 .47 .394
October .18 .16 .35 .60 .62 .29 .39 .55 .51 .42 .407
November .17 .16 .34 .65 .64 .28 .41 .55 .49 .43 .412
December .17 .18 .39 .66 .66 .26 .42 .55 .49 .44 .422
Yearly aver. .259 .161 .266 .554 .672 .424 .314 .546 .580 .531 .431
1870. 1871. 1872. 1873. 1874. 1875. 1876. 1877. 1878. 1879. Ten-yr. av.
January .42 .43 .34 .27 .42 .55 .31 .35 .24 .20 .353
February .41 .49 .34 .28 .44 .55 .31 .35 .24 .21 .362
March .39 .52 .33 .28 .45 .56 .33 .33 .24 .23 .366
April .45 .51 .33 .29 .47 .60 .32 .37 .24 .22 .380
May .51 .50 .39 .34 .49 .65 .30 .42 .26 .27 .413
June .52 .51 .41 .31 .48 .60 .30 .46 .24 .32 .415
July .51 .50 .29 .31 .49 .53 .29 .31 .25 .31 .379
August .42 .32 .30 .29 .44 .48 .31 .25 .23 .24 .328
September .38 .32 .27 .31 .46 .38 .33 .24 .20 .24 .313
October .38 .33 .24 .32 .50 .36 .33 .23 .19 .29 .317
November .41 .33 .23 .32 .50 .33 .32 .25 .20 .32 .341
December .41 .34 .26 .39 .55 .32 .34 .25 .20 .35 .341
Yearly aver. .434 .425 .311 .309 .474 .493 .316 .318 .228 .267 .357
1880. 1881. 1882. 1883. 1884. 1885. 1886. 1887. 1888. 1889. Ten-yr. av.
January .38 .31 .44 .37 .33 .27 .32 .26 .30 .25 .323
February .32 .31 .42 .39 .33 .28 .29 .25 .29 .26 .314
March .30 .32 .44 .42 .31 .29 .30 .24 .29 .25 .316
April .28 .35 .49 .41 .30 .32 .27 .25 .30 .23 .320
May .38 .38 .52 .41 .32 .34 .28 .25 .35 .23 .339
June .29 .38 .52 .35 .32 .33 .27 .26 .32 .22 .326
July .25 .41 .57 .32 .30 .27 .30 .26 .31 .22 .321
August .25 .36 .48 .27 .27 .24 .26 .25 .28 .20 .286
September .29 .42 .34 .27 .25 .26 .25 .25 .24 .19 .276
October .31 .45 .34 .28 .27 .25 .24 .26 .24 .19 .283
November .31 .44 .36 .30 .26 .29 .26 .28 .26 .20 .296
December .31 .45 .38 .33 .24 .28 .25 .30 .26 .21 .301
Yearly aver. .300 .382 .442 .344 .292 .285 .274 .259 .287 .221 .308
122
1890. 1891. 1892. 1893. 1894. 1895. 1896. 1897. 1898. 1899. Ten-yr. av.
January .21 .44 .29 .31 .28 .29 .18 .16 .23 .27 .266
February .20 .46 .30 .31 .28 .28 .20 .16 .26 .28 .273
March .21 .51 .29 .30 .30 .29 .19 .17 .26 .26 .278
April .24 .53 .29 .28 .31 .29 .19 .17 .28 .26 .284
May .27 .50 .31 .31 .35 .30 .19 .18 .28 .26 .295
June .28 .40 .32 .29 .42 .28 .17 .18 .24 .25 .283
July .31 .33 .32 .26 .38 .24 .17 .18 .23 .22 .264
August .37 .30 .33 .24 .31 .21 .17 .18 .21 .21 .253
September .37 .28 .33 .26 .29 .19 .16 .20 .21 .22 .251
October .41 .28 .30 .27 .29 .18 .18 .19 .23 .23 .256
November .43 .32 .31 .28 .29 .19 .19 .21 .26 .23 .271
December .42 .32 .31 .28 .30 .17 .18 .22 .27 .25 .272
Yearly aver. .310 .389 .309 .283 .317 .243 .181 .184 .247 .245 .271
1900. 1901. 1902. 1903. 1904. 1905. 1906. 1907. 1908. 1909. Ten-yr. av.
January .23 .24 .42 .33 .39 .30 .31 .35 .50 .50 .357
February .23 .25 .43 .35 .43 .31 .30 .39 .51 .53 .373
March .24 .26 .43 .33 .40 .31 .30 .41 .53 .54 .375
April .24 .27 .43 .34 .39 .31 .32 .44 .53 .55 .382
May .23 .29 .45 .36 .42 .30 .33 .47 .55 .59 .399
June .24 .28 .44 .39 .41 .32 .38 .45 .52 .56 .399
July .23 .33 .43 .39 .42 .31 .35 .44 .56 .49 .395
August .22 .36 .28 .35 .36 .27 .31 .49 .48 .40 .352
September .22 .35 .27 .37 .32 .28 .32 .54 .49 .43 .359
October .22 .36 .29 .37 .30 .29 .34 .50 .48 .40 .355
November .22 .41 .29 .36 .31 .30 .34 .47 .49 .39 .358
December .22 .45 .31 .36 .30 .31 .34 .49 .49 .43 .370
Yearly aver. .229 .321 .373 .359 .371 .301 .329 .454 .511 .484 .373
1910. 1911. 1912. 1913. 1914. 1915. 1916. 1917. 1918. 1919. Ten-yr. av.
January .47 .32 .49 .33 .38 .54 .47 .56 .82 .65 .503
February .48 .31 .52 .34 .39 .57 .46 .54 .87 .60 .508
March .45 .30 .53 .33 .39 .57 .45 .59 .91 .64 .516
April .43 .31 .57 .35 .38 .56 .44 .67 .86 .71 .528
May .40 .34 .54 .39 .40 .53 .44 .67 .76 .71 .518
June .38 .40 .52 .41 .39 .48 .39 .66 .76 .71 .510
July .42 .43 .50 .40 .37 .54 .40 .77 .75 .76 .534
August .36 .41 .33 .41 .41 .53 .44 .66 .70 .76 .501
September .33 .44 .33 .42 .48 .37 .46 .59 .72 .70 .484
October .31 .46 .32 .39 .47 .38 .50 .59 .69 .73 .484
November .31 .46 .31 .38 .49 .39 .54 .66 .73 .76 .503
December .31 .47 .32 .39 .48 .42 .50 .76 .71 .84 .520
Yearly aver. .381 .388 .440 .379 .419 .490 .458 .644 .774 .714 .509
123 CHICAGO WHEAT PRICES.
1860. 1861. 1862. 1863. 1864. 1865. 1866. 1867. 1868. 1869. Ten-yr. av.
$ $ $ $ $ $ $ $ $ $ $
January .98 .76 .66 .96 1.11 1.40 .87 1.95 1.63 1.14 1.146
February .97 .75 .72 1.08 1.11 1.25 .84 1.90 2.01 1.16 1.179
March 1.01 .77 .73 1.08 1.10 1.16 .91 2.04 1.95 1.13 1.188
April 1.04 .86 .72 1.03 1.19 1.03 .96 1.93 1.96 1.07 1.179
May 1.06 .94 .71 .95 1.22 1.05 1.77 2.14 2.02 1.13 1.299
June 1.04 .63 .72 .94 1.56 1.06 1.19 1.96 1.92 1.16 1.218
July 1.00 .62 .79 .92 2.02 1.03 1.00 1.49 1.47 1.31 1.165
August .83 .67 .87 .86 1.91 1.17 1.41 1.75 1.72 1.38 1.257
September .85 .69 .81 .94 1.87 1.24 1.78 1.79 1.54 1.23 1.274
October .83 .71 .87 1.05 1.58 1.22 1.89 1.90 1.29 1.02 1.236
November .77 .66 .77 1.04 1.76 1.13 1.89 1.76 1.12 .89 1.179
December .74 .64 .83 1.08 1.52 .92 1.85 1.46 1.14 .86 1.104
Yearly aver. .927 .725 .767 .994 1.495 1.138 1.361 1.839 1.647 1.123 1.202
1870. 1871. 1872. 1873. 1874. 1875. 1876. 1877. 1878. 1879. Ten-yr. av.
January .79 1.14 1.23 1.23 1.22 .89 .99 1.28 1.06 .83 1.066
February .81 1.24 1.24 1.23 1.19 .85 1.02 1.29 1.05 .89 1.081
March .58 1.24 1.21 1.20 1.19 .91 1.01 1.25 1.08 .92 1.059
April .80 1.29 1.25 1.19 1.24 1.00 1.02 1.43 1.10 .89 1.121
May .95 1.27 1.48 1.29 1.23 1.01 1.03 1.62 1.10 .97 1.195
June 1.10 1.26 1.45 1.22 1.20 .96 1.05 1.48 .97 1.04 1.173
July 1.12 1.20 1.25 1.18 1.14 1.12 .96 1.42 .95 .99 1.133
August 1.09 1.04 1.37 1.22 1.02 1.21 .89 1.14 .99 .86 1.083
September .99 1.11 1.21 1.10 .97 1.13 1.02 1.13 .87 .94 1.047
October 1.06 1.22 1.13 1.04 .89 1.11 1.10 1.10 .81 1.12 1.058
November .81 1.23 1.07 1.01 .88 1.08 1.11 1.08 .82 1.16 1.025
December 1.06 1.19 1.14 1.12 .90 .98 1.19 1.09 .83 1.29 1.079
Yearly aver. .930 1.202 1.252 1.169 1.089 1.020 1.032 1.275 .969 .992 1.093
1880. 1881. 1882. 1883. 1884. 1885. 1886. 1887. 1888. 1889. Ten-yr. av.
January 1.25 .98 1.30 .99 .92 .79 .81 .79 .77 .96 .956
February 1.23 .98 1.27 1.08 .93 .77 .81 .75 .77 1.01 .960
March 1.21 1.01 1.30 1.07 .88 .77 .79 .77 .76 1.00 .956
April 1.11 1.02 1.35 1.07 .85 .85 .76 .80 .77 .91 .949
May 1.15 1.04 1.27 1.11 .90 .88 .76 .85 .86 .86 .968
June .97 1.10 1.30 1.06 .87 .87 .74 .81 .82 .83 .937
July .92 1.14 1.30 1.01 .82 .88 .77 .70 .82 .81 .917
August .89 1.29 1.09 1.02 .80 .84 .76 .68 .88 .78 .903
September .91 1.28 1.01 .96 .76 .82 .74 .69 1.45 .79 .941
October .98 1.36 .95 .93 .76 .88 .72 .71 1.11 .80 .920
November 1.06 1.28 .93 .96 .73 .87 .75 .74 1.09 .80 .921
December 1.01 1.27 .93 .97 .73 .86 .77 .77 1.01 .79 .911
Yearly aver. 1.057 1.145 1.175 1.019 .829 .840 .765 .755 .926 .862 .936
124
1890. 1891. 1892. 1893. 1894. 1895. 1896. 1897. 1898. 1899. Ten-yr. av.
$ $ $ $ $ $ $ $ $ $ $
January .76 .91 .87 .75 .61 .55 .62 .83 1.00 .71 .761
February .76 .95 .88 .74 .58 .54 .67 .80 1.02 .72 .766
March .79 1.01 .84 .76 .58 .57 .65 .80 1.03 .70 .773
April .85 1.09 .81 .79 61 .62 .66 .81 1.12 .73 .809
May .95 1.03 .83 .72 .57 .73 .62 .83 1.51 .74 .853
June .89 .96 .83 .65 .59 .77 .60 .75 .98 .74 .776
July .90 .92 .78 .60 .55 .68 .58 .74 .77 .72 .724
August .99 1.00 .77 .60 .55 .65 .58 .91 .70 .72 .747
September 1.00 .95 .73 .66 .53 .60 .63 .93 .65 .72 .740
October 1.00 .96 .72 .63 .54 .61 .73 .94 .66 .72 .751
November .95 .94 .71 .61 .57 .59 .83 .96 .67 .68 .751
December .90 .91 .71 .62 .58 .59 .84 1.01 .66 .67 .749
Yearly aver. .895 .969 .790 .678 .572 .625 .668 .859 .898 .714 .767
1900. 1901. 1902. 1903. 1904. 1905. 1906. 1907. 1908. 1909. Ten-yr. av.
January .65 .74 .77 .70 .87 1.18 .86 .73 .97 1.06 .853
February .66 .73 .75 .77 .98 1.19 .83 .80 .95 1.16 .882
March .66 .75 .78 .73 .96 1.15 .80 .80 .96 1.22 .881
April .66 .72 .73 .75 .94 1.03 .85 .81 .94 1.32 .875
May .66 .73 .74 .78 .97 1.00 .88 .93 1.05 1.40 .914
June .77 .71 .74 .80 .99 1.07 .85 .96 .95 1.45 .929
July .78 .67 .75 .80 1.03 1.03 .79 .98 .88 1.23 .894
August .74 .72 .72 .84 1.07 .96 .74 .93 .93 1.18 .883
September .76 .70 .83 .84 1.14 .87 .74 1.02 1.01 1.08 .899
October .74 .69 .72 .82 1.16 .88 .72 1.07 1.03 1.12 .895
November .72 .72 .74 .81 1.15 .88 .73 .93 1.05 1.12 .885
December .72 .76 .75 .82 1.17 .86 .74 1.02 1.03 1.17 .904
Yearly aver. .710 .720 .752 .789 1.035 1.008 .793 .915 .979 1.209 .891
1910. 1911. 1912. 1913. 1914. 1915. 1916. 1917. 1918. 1919. Ten-yr. av.
January 1.19 1.02 1.04 1.02 .93 1.41 1.29 1.85 2.18 2.35 1.428
February 1.19 .97 1.05 1.01 .94 1.57 1.24 1.76 2.19 2.30 1.422
March 1.19 .93 1.07 .98 .94 1.51 1.14 1.93 2.19 2.36 1.424
April 1.14 .94 1.11 1.00 .94 1.58 1.21 2.00 2.19 2.63 1.474
May 1.09 .97 1.17 1.00 .96 1.50 1.15 3.02 2.19 2.73 1.580
June 1.06 .95 1.13 1.00 .89 1.30 1.08 2.67 2.19 2.39 1.466
July 1.14 .92 1.07 .90 .89 1.31 1.18 2.55 2.28 2.26 1.450
August 1.12 1.01 1.01 .89 1.01 1.15 1.43 2.56 2.29 2.25 1.472
September 1.07 1.01 .99 .92 1.16 1.08 1.56 2.24 2.26 2.54 1.483
October 1.03 1.06 1.01 .89 1.10 1.10 1.80 2.19 2.26 2.55 1.499
November .99 1.01 .96 .91 1.15 1.09 1.83 2.19 2.26 2.73 1.512
December 1.00 1.01 .98 .92 1.22 1.17 1.66 2.19 2.32 2.92 1.539
Yearly aver. 1.100 .984 1.059 .954 1.010 1.314 1.381 2.262 2.240 2.500 1.480
125
PRICES DURING 1862–1878.
Prices during the 1862–1878 period are generally given in currency, and the currency of that period, unfortunately, had a fluctuating gold value, just as the British pound has today. In order that our readers may be able to convert the currency prices of 1862–1878 into terms of gold, we are publishing the following table:
AMOUNT OF GREENBACK CURRENCY NECESSARY TO BUY ONE DOLLAR IN GOLD IN UNITED STATES, FROM 1862–1878, INCLUSIVE.
1862. 1863. 1864. 1865. 1866. 1867. 1868. 1869. 1870.
January $1.02 $1.48 $1.56 $2.16 $1.37 $1.35 $1.38 $1.36 $1.21
February 1.03 1.63 1.59 2.02 1.39 1.38 1.42 1.34 1.18
March 1.02 1.56 1.64 1.75 1.31 1.37 1.40 1.32 1.13
April 1.02 1.52 1.76 1.49 1.27 1.38 1.39 1.33 1.14
May 1.02 1.50 1.79 1.37 1.34 1.37 1.40 1.40 1.15
June 1.07 1.45 2.22 1.42 1.53 1.38 1.40 1.38 1.13
July 1.14 1.34 2.54 1.43 1.52 1.40 1.43 1.36 1.17
August 1.15 1.26 2.47 1.42 1.50 1.41 1.47 1.34 1.18
September 1.20 1.35 2.23 1.45 1.45 1.43 1.43 1.43 1.15
October 1.28 1.49 2.09 1.47 1.50 1.43 1.38 1.30 1.13
November 1.31 1.49 2.35 1.48 1.45 1.41 1.35 1.28 1.12
December 1.32 1.51 2.28 1.47 1.37 1.36 1.36 1.22 1.11
1871. 1872. 1873. 1874. 1875. 1876. 1877. 1878.
January 1.11 1.10 1.13 1.11 1.13 1.13 1.06 1.02
February 1.12 1.11 1.14 1.12 1.14 1.14 1.06 1.02
March 1.11 1.11 1.17 1.13 1.16 1.15 1.05 1.02
April 1.11 1.12 1.18 1.13 1.15 1.13 1.07 1.01
May 1.12 1.13 1.18 1.13 1.16 1.13 1.07 1.01
June 1.13 1.14 1.17 1.12 1.17 1.13 1.07 1.01
July 1.13 1.14 1.16 1.10 1.14 1.12 1.06 1.01
August 1.12 1.14 1.15 1.10 1.14 1.11 1.05 1.00
September 1.14 1.14 1.14 1.10 1.15 1.10 1.04 1.00
October 1.14 1.14 1.10 1.10 1.16 1.11 1.03 1.00
November 1.11 1.13 1.09 1.11 1.15 1.09 1.03 1.00
December 1.10 1.13 1.11 1.12 1.14 1.08 1.03 1.00
CHICAGO TEN-YEAR AVERAGE DAILY PRICES, 1904–1913.
Compiling the tables on pages 126–133 involved considerable work, but it is believed that for studying seasonal trends and normal relationships at different times of the year, these figures are very valuable. As a matter of interest, a few future contract prices are averaged. It will be noted that the future prices differ considerably from the cash prices until the date of the delivery month draws near, when the future and the cash prices become almost identical. Before the war, the future contract system worked very well, but during the war it was rather unsatisfactory. There is an interesting field of study in the seasonal trend of northern wheat (spring) as compared with red wheat (winter).
126 JANUARY.
Day. Cash Corn (cts.) Dec. Corn (cts.) Hog Top Packing Sows Cash Lard Sept. Lard Cash Ribs July Ribs Cash Oats (cts.) Sept. Oats (cts.) Wheat, No. 2 Red (cts.) Wheat, No. 1 N’th’rn. (cts.)
3 51.2 $6.32 $5.81 $8.94 $8.26 38.7 99.0 99.0
4 51.2 6.34 5.85 8.97 8.31 38.9 99.4 99.2
5 51.3 6.37 5.84 8.97 8.32 38.9 100.0 99.1
6 51.4 6.37 5.85 9.01 8.35 39.0 100.2 99.9
7 51.6 6.42 5.90 8.99 8.35 39.1 100.2 99.3
8 51.6 6.41 5.90 8.96 8.33 39.0 100.1 99.2
9 51.5 6.40 5.90 8.94 8.34 39.1 100.2 99.4
10 51.9 6.34 5.87 8.93 8.33 39.0 100.4 99.2
11 52.0 6.28 5.81 8.94 8.35 39.4 100.2 99.3
12 52.2 6.31 5.81 8.95 8.38 39.3 100.2 99.4
13 52.3 6.34 5.84 8.97 8.38 39.4 100.0 99.2
14 52.3 6.37 5.85 9.00 8.40 39.5 100.3 99.5
15 52.2 6.40 5.87 8.97 8.43 39.5 99.9 99.3
16 52.2 6.39 5.88 8.97 8.42 39.7 100.0 99.3
17 52.4 6.39 5.88 9.00 8.44 39.8 100.1 99.3
18 52.1 6.40 5.89 8.96 8.45 39.7 100.3 99.3
19 52.3 6.41 5.89 8.96 8.45 39.7 100.1 99.1
20 51.9 6.38 5.87 8.97 8.46 39.8 100.1 99.3
21 52.0 6.39 5.88 8.97 8.46 40.0 100.3 99.5
22 52.0 6.38 5.88 8.92 8.43 40.0 100.1 99.1
23 51.9 6.36 5.87 8.91 8.43 39.8 100.1 99.6
24 51.9 6.38 5.90 8.94 8.46 39.9 100.1 99.6
25 51.9 6.41 5.92 8.93 8.48 39.9 100.0 99.3
26 51.9 6.40 5.91 8.95 8.48 39.9 99.9 99.2
27 51.8 6.42 5.92 8.96 8.50 39.9 100.0 99.2
28 51.9 6.41 5.91 8.95 8.47 39.7 100.2 99.5
29 51.9 6.41 5.90 8.95 8.48 40.0 190.4 99.7
30 51.9 6.44 5.91 8.97 8.50 40.1 100.4 99.7
31 51.8 6.48 5.94 8.90 8.50 40.0 100.1 99.5
Av. 51.9 6.38 5.88 8.96 8.40 39.5 100.1 99.3
FEBRUARY.
1 51.6 6.49 5.95 8.89 8.49 39.9 100.0 100.2
2 52.0 6.48 5.95 8.95 8.54 40.1 100.2 100.4
3 52.4 6.47 5.97 8.96 8.54 40.2 100.3 100.4
4 52.8 6.49 5.99 8.97 8.54 40.4 100.6 100.6
5 52.9 6.52 6.00 8.95 8.53 40.4 100.6 100.9
6 52.7 6.53 6.03 8.96 8.52 40.6 100.7 101.0
7 52.6 6.53 6.02 8.95 8.52 40.7 101.0 101.1
8 52.5 6.56 6.08 8.92 8.51 40.7 100.9 101.0
9 52.6 6.56 6.07 9.02 8.56 40.8 101.0 101.2
10 52.5 6.60 6.12 8.98 8.54 40.9 101.0 101.3
11 52.4 6.63 6.16 8.98 8.55 40.8 101.0 101.3
12 52.4 6.61 6.13 8.96 8.53 40.8 100.9 101.1
13 52.4 6.62 6.13 8.94 8.52 40.8 100.7 101.0
14 52.5 6.61 6.13 8.96 8.53 40.9 100.5 101.0
15 52.7 6.62 6.15 8.96 8.52 40.9 100.9 101.3
16 52.7 6.64 6.17 8.94 8.51 40.8 101.0 101.4
12717 52.7 $6.65 $6.18 $8.96 $8.53 40.7 100.7 101.1
18 52.8 6.67 6.18 8.95 8.53 40.7 100.3 100.8
19 52.7 6.67 6.19 8.96 8.55 41.1 100.5 101.0
20 52.7 6.68 6.21 8.95 8.54 41.1 101.3 101.6
21 52.8 6.69 6.21 8.96 8.56 41.1 101.3 101.8
22 52.7 6.71 6.23 8.98 8.56 41.1 101.4 101.8
23 52.9 6.74 6.25 8.99 8.56 41.1 101.4 101.3
24 53.0 6.73 6.26 8.98 8.56 41.2 101.6 101.7
25 53.1 6.75 6.27 9.00 8.58 41.3 101.3 102.0
26 53.1 6.76 6.29 9.00 8.58 41.5 101.4 102.1
27 53.4 6.72 6.28 9.03 8.62 41.7 101.5 102.0
28 53.3 6.80 6.33 9.04 8.64 41.6 101.4 102.0
Av. 52.7 6.63 6.14 8.96 8.52 40.9 100.9 101.2
MARCH.
1 53.2 6.79 6.32 9.04 9.36 8.50 41.2 101.3 101.2
2 53.4 6.79 6.33 9.07 9.37 8.60 41.6 101.1 101.3
3 53.2 6.80 6.34 9.07 9.39 8.60 41.3 101.0 101.0
4 53.4 6.80 6.34 9.08 9.39 8.61 41.0 100.7 100.8
5 53.6 6.80 6.35 9.13 9.41 8.64 41.1 100.1 100.4
6 53.6 6.87 6.39 9.17 9.45 8.66 41.2 99.9 100.3
7 53.5 6.90 6.43 9.13 9.45 8.68 41.0 99.6 99.7
8 53.8 6.89 6.40 9.15 9.42 8.69 41.2 99.3 99.2
9 53.8 6.96 6.45 9.20 9.47 8.72 41.1 99.0 99.0
10 54.1 6.98 6.45 9.15 9.44 8.69 41.1 99.3 99.6
11 54.1 6.97 6.48 9.14 9.43 8.71 40.9 99.2 99.7
12 54.3 7.01 6.52 9.16 9.44 8.72 40.9 99.5 99.9
13 54.5 7.03 6.52 9.17 9.45 8.75 40.9 99.4 99.8
14 54.5 7.00 6.52 9.18 9.47 8.77 41.1 99.9 100.1
15 54.5 7.01 6.52 9.16 9.44 8.76 40.8 99.9 99.8
16 54.2 7.02 6.53 9.19 9.41 8.76 40.7 99.7 99.6
17 54.4 7.05 6.54 9.18 9.42 8.77 40.5 99.6 99.7
18 54.1 7.05 6.55 9.18 9.42 8.77 40.5 99.6 99.6
19 54.5 7.06 6.57 9.17 9.42 8.78 40.9 99.8 99.7
20 54.4 7.06 6.54 9.17 9.40 8.78 41.0 99.7 99.7
21 54.2 7.10 6.61 9.18 9.39 8.81 40.9 99.5 99.5
22 54.6 7.10 6.62 9.20 9.40 8.84 40.9 99.4 99.6
23 54.8 7.11 6.63 9.22 9.41 8.84 40.8 99.4 99.7
24 55.0 7.11 6.64 9.23 9.40 8.81 40.8 99.8 99.8
25 55.2 7.14 6.66 9.21 9.41 8.82 40.7 99.9 100.0
26 55.2 7.19 6.70 9.26 9.44 8.85 40.8 100.1 101.4
27 55.3 7.26 6.76 9.32 9.49 8.94 40.9 100.2 101.4
28 55.3 7.29 6.79 9.32 9.51 8.95 40.9 100.3 101.4
29 55.5 7.31 6.81 9.28 9.49 8.92 40.9 100.0 101.0
30 55.7 7.28 6.77 9.28 9.44 8.88 41.1 99.9 101.0
31 55.9 7.29 6.77 9.28 9.47 8.91 41.1 100.5 100.7
Av. 54.5 6.99 6.55 9.18 9.43 8.76 41.0 99.9 100.2
128 APRIL.
1 55.6 $7.33 $6.80 $9.28 $9.47 $8.91 41.3 100.7 101.3
2 56.0 7.33 6.82 9.25 9.46 8.91 41.3 100.5 100.1
3 56.1 7.31 6.79 9.23 9.44 8.90 41.3 100.6 100.1
4 56.2 7.32 6.82 9.22 9.41 8.88 41.2 100.8 100.1
5 56.4 7.30 6.80 9.19 9.39 8.86 41.2 100.9 100.2
6 56.3 7.30 6.79 9.13 9.36 8.82 41.2 101.3 100.5
7 56.6 7.28 6.79 9.16 9.35 8.80 41.2 101.4 100.8
8 56.4 7.26 6.77 9.14 9.34 8.80 41.3 101.5 100.5
9 56.7 7.27 6.75 9.19 9.35 8.79 41.4 101.7 100.9
10 56.9 7.25 6.75 9.18 9.36 8.81 41.6 101.7 100.9
11 57.2 7.26 6.76 9.16 9.35 8.78 41.7 101.9 100.9
12 57.4 7.25 6.74 9.17 9.36 8.77 41.8 102.1 101.2
13 57.6 7.24 6.75 9.17 9.38 8.79 42.1 102.6 101.2
14 57.5 7.22 6.73 9.16 9.38 8.79 41.9 102.6 101.3
15 57.4 7.18 6.68 9.15 9.36 8.76 41.9 102.6 101.6
16 57.2 7.15 6.64 9.10 9.32 8.71 41.7 102.4 100.9
17 57.4 7.15 6.63 9.09 9.33 8.77 41.7 102.6 101.0
18 57.4 7.15 6.64 9.08 9.32 8.76 41.9 102.6 101.4
19 57.3 7.07 6.56 9.06 9.31 8.76 42.0 102.9 101.5
20 57.4 7.06 6.55 9.07 9.31 8.74 42.0 102.4 101.1
21 57.6 7.04 6.53 9.09 9.31 8.78 42.0 102.2 101.0
22 57.7 7.03 6.55 9.09 9.32 8.81 41.8 102.3 100.4
23 57.5 7.00 6.52 9.09 9.31 8.81 41.8 102.2 99.9
24 57.5 7.00 6.52 9.09 9.31 8.78 41.6 101.8 99.5
25 57.8 6.99 6.51 9.13 9.33 8.79 41.9 102.0 100.0
26 57.6 7.00 6.51 9.15 9.36 8.79 42.0 101.4 99.6
27 57.9 6.96 6.48 9.18 9.35 8.80 42.0 101.3 99.1
28 58.1 6.97 6.46 9.16 9.37 8.77 42.2 101.2 99.3
29 58.3 6.93 6.43 9.17 9.38 8.78 42.1 101.3 99.4
30 58.1 6.92 6.40 9.17 9.37 8.78 42.2 102.0 100.7
Av. 57.1 7.15 6.65 9.14 9.36 8.80 41.7 101.8 100.5
MAY.
1 58.5 52.3 6.88 6.36 9.18 9.36 8.82 8.96 42.5 35.5 102.6 100.5
2 58.9 52.3 6.86 6.33 9.18 9.36 8.83 8.97 42.6 35.6 103.1 101.2
3 58.9 52.2 6.85 6.33 9.19 9.36 8.84 8.98 42.2 35.4 103.8 100.8
4 58.9 52.0 6.86 6.34 9.25 9.39 8.88 8.99 42.5 35.3 104.2 101.6
5 59.2 52.2 6.89 6.38 9.27 9.41 8.90 9.03 42.8 35.5 104.6 102.0
6 59.3 52.2 6.91 6.40 9.23 9.39 8.91 9.01 42.9 35.4 104.8 102.0
7 59.6 52.2 6.87 6.36 9.25 9.39 8.89 9.00 43.0 35.5 104.7 102.2
8 59.6 52.1 6.88 6.38 9.26 9.40 8.93 9.04 43.0 35.5 104.8 102.5
9 59.6 52.3 6.89 6.40 9.27 9.41 8.98 9.07 43.1 35.6 105.0 102.8
10 59.8 52.3 6.91 6.40 9.26 9.40 8.97 9.06 43.3 35.6 105.4 102.7
11 60.2 52.5 6.95 6.44 9.29 9.41 8.97 9.08 43.6 35.9 105.4 102.9
12 60.2 52.6 6.94 6.44 9.31 9.41 8.99 9.08 43.7 36.1 106.0 103.1
13 60.3 52.7 6.94 6.45 9.32 9.42 9.02 9.09 43.5 36.0 106.6 103.7
14 60.4 52.5 6.96 6.44 9.33 9.45 9.04 9.11 43.5 35.9 106.7 103.6
15 60.5 52.5 6.93 6.41 9.33 9.45 9.03 9.10 43.4 35.8 106.6 103.7
16 60.4 52.5 6.92 6.39 9.31 9.45 9.04 9.09 43.3 35.8 106.5 103.6
12917 60.9 52.6 6.95 6.43 9.36 9.47 9.09 9.13 43.5 35.9 106.4 104.0
18 60.8 52.4 6.93 6.42 9.31 9.46 9.06 9.12 43.5 36.1 106.8 104.4
19 61.0 52.6 6.89 6.37 9.28 9.43 9.06 9.11 43.6 36.2 106.9 104.6
20 60.7 52.6 6.89 6.39 9.26 9.42 9.05 9.10 43.4 36.2 107.2 105.0
21 61.1 52.7 6.91 6.38 9.26 9.42 9.07 9.10 43.7 36.3 107.7 105.2
22 61.3 52.8 6.91 6.37 9.27 9.42 9.05 9.10 43.9 36.5 108.8 106.0
23 61.2 52.7 6.88 6.34 9.27 9.40 9.05 9.09 44.0 36.5 108.3 105.4
24 61.4 52.7 6.86 6.31 9.24 9.40 9.08 9.10 44.0 36.4 108.7 105.6
25 61.4 52.8 6.83 6.29 9.26 9.40 9.12 9.11 44.2 36.6 109.2 106.0
26 61.9 52.9 6.82 6.29 9.30 9.44 9.13 9.15 44.4 36.7 109.3 106.1
27 61.2 52.9 6.84 6.31 9.31 9.44 9.14 9.18 44.3 36.7 108.7 105.7
28 60.3 52.6 6.84 6.31 9.30 9.45 9.16 9.20 44.3 36.4 107.9 105.5
29 60.4 52.6 6.82 6.29 9.31 9.47 9.19 9.22 43.3 36.3 107.8 105.4
30 60.4 52.7 6.84 6.30 9.32 9.48 9.20 9.24 43.1 36.4 106.8 104.9
31 60.5 52.7 6.86 6.31 9.33 9.49 9.22 9.24 43.1 36.4 106.4 104.2
Av. 60.3 52.5 6.89 6.36 9.27 9.42 9.02 9.09 43.4 36.0 106.4 103.8
JUNE.
1 60.1 53.2 6.86 6.34 9.28 9.47 9.19 9.22 43.2 36.5 105.8 105.0
2 60.4 53.5 6.85 6.32 9.27 9.43 9.18 9.20 43.1 36.7 105.5 105.4
3 60.5 53.5 6.84 6.30 9.26 9.42 9.20 9.21 43.1 36.6 105.3 105.4
4 60.3 53.6 6.83 6.30 9.27 9.44 9.18 9.21 43.3 36.8 105.2 104.8
5 60.1 53.5 6.81 6.26 9.29 9.45 9.19 9.23 43.3 36.6 105.1 104.8
6 59.9 53.6 6.84 6.30 9.35 9.50 9.29 9.31 43.3 36.5 105.0 105.1
7 60.1 53.8 6.88 6.33 9.35 9.55 9.30 9.36 43.0 36.5 105.1 105.5
8 60.0 53.9 6.92 6.37 9.36 9.56 9.32 9.38 43.2 36.6 104.5 105.9
9 60.3 54.0 6.93 6.38 9.40 9.57 9.35 9.42 43.4 36.6 104.8 105.5
10 60.1 54.1 6.94 6.39 9.39 9.58 9.39 9.44 43.0 36.7 104.6 105.4
11 59.9 54.1 6.95 6.40 9.41 9.58 9.43 9.45 42.9 36.4 104.2 104.8
12 60.1 54.2 6.96 6.41 9.40 9.58 9.43 9.47 43.0 36.6 103.9 104.6
13 60.1 54.3 6.95 6.40 9.40 9.58 9.46 9.47 43.0 36.7 103.3 104.4
14 60.0 54.2 6.95 6.41 9.40 9.59 9.44 9.47 42.9 36.7 102.6 104.1
15 60.0 54.3 6.95 6.40 9.38 9.59 9.44 9.48 43.5 36.9 102.6 103.9
16 60.1 54.7 6.99 6.44 9.41 9.61 9.46 9.52 43.6 37.3 103.1 104.5
17 60.2 54.8 6.95 6.43 9.43 9.60 9.48 9.52 43.5 37.3 102.2 104.4
18 60.2 54.8 6.97 6.45 9.47 9.64 9.51 9.57 43.5 37.5 102.4 104.0
19 60.3 54.8 7.03 6.49 9.46 9.66 9.53 9.60 43.8 37.6 102.1 104.7
20 60.4 54.8 7.08 6.52 9.47 9.67 9.54 9.58 44.0 37.8 100.8 105.2
21 60.6 55.1 7.09 6.54 9.48 9.66 9.53 9.57 44.3 38.2 100.0 105.6
22 60.5 55.1 7.07 6.51 9.44 9.63 9.51 9.55 44.1 38.4 99.5 105.7
23 60.2 54.9 7.06 6.49 9.46 9.62 9.53 9.52 43.8 37.9 99.5 105.9
24 59.7 54.7 7.08 6.50 9.46 9.65 9.56 9.56 43.2 38.1 99.2 105.5
25 59.8 54.7 7.08 6.49 9.48 9.66 9.58 9.57 43.4 38.0 99.0 106.2
26 60.0 54.8 7.09 6.51 9.48 9.65 9.58 9.57 43.5 38.1 98.7 106.5
27 60.6 55.3 7.09 6.54 9.50 9.67 9.60 9.58 43.8 38.4 99.6 106.7
28 60.7 55.4 7.10 6.53 9.48 9.64 9.59 9.56 43.5 38.6 99.9 106.5
29 60.7 55.4 7.11 6.54 9.51 9.66 9.59 9.58 43.3 38.5 99.3 107.0
30 60.6 55.6 7.15 6.55 9.52 9.68 9.60 9.59 42.9 38.6 98.6 106.5
Av. 60.2 54.4 6.98 6.43 9.41 9.58 9.43 9.46 43.4 37.3 102.4 105.2
130 JULY.
1 60.9 55.6 $7.17 $6.58 $9.55 $9.70 $9.62 43.0 38.6 99.3 105.7
2 61.1 55.9 7.16 6.55 9.56 9.71 9.63 42.7 38.6 98.5 105.6
3 61.1 55.8 7.18 6.55 9.56 9.73 9.65 42.8 38.6 98.1 105.9
4 61.0 55.8 7.20 6.57 9.57 9.73 9.64 42.7 38.6 97.6 105.7
5 61.1 55.9 7.22 6.59 9.57 9.73 9.62 42.7 38.7 97.2 105.6
6 61.0 55.7 7.25 6.62 9.53 9.69 9.60 42.3 38.7 96.6 105.7
7 61.4 55.8 7.25 6.59 9.54 9.65 9.58 42.7 38.6 97.1 105.8
8 61.5 55.7 7.23 6.52 9.50 9.62 9.59 42.8 38.5 96.5 105.8
9 61.9 55.7 7.23 6.53 9.51 9.64 9.61 43.0 38.4 96.8 105.8
10 62.0 55.4 7.18 6.51 9.54 9.65 9.62 43.1 38.3 96.9 106.2
11 62.1 55.5 7.23 6.51 9.54 9.65 9.64 43.2 38.4 96.7 105.9
12 62.3 55.1 7.23 6.48 9.53 9.64 9.59 43.5 38.3 97.5 106.2
13 62.3 55.3 7.25 6.50 9.52 9.63 9.59 43.6 38.5 97.5 106.7
14 62.5 55.1 7.26 6.51 9.49 9.61 9.55 43.6 38.4 97.5 107.7
15 62.4 55.0 7.26 6.52 9.47 9.59 9.56 43.4 38.2 96.9 107.9
16 62.4 54.8 7.29 6.54 9.46 9.57 9.54 43.2 37.9 96.2 108.0
17 62.5 54.8 7.30 6.56 9.44 9.57 9.53 43.0 37.8 95.7 108.0
18 62.0 54.6 7.33 6.59 9.45 9.56 9.55 43.1 37.5 95.5 108.7
19 61.8 54.5 7.37 6.61 9.45 9.56 9.53 42.9 37.5 95.2 108.4
20 62.0 54.5 7.36 6.55 9.46 9.56 9.49 43.0 37.3 94.9 108.3
21 62.1 54.8 7.31 6.51 9.49 9.57 9.52 42.9 37.4 95.0 108.0
22 61.9 54.7 7.29 6.50 9.49 9.58 9.53 42.7 37.4 94.5 107.8
23 62.2 54.7 7.33 6.51 9.51 9.59 9.52 43.0 37.4 94.4 107.3
24 62.4 55.0 7.36 6.52 9.50 9.59 9.53 43.4 37.6 94.0 107.2
25 62.6 55.2 7.39 6.52 9.52 9.59 9.52 43.7 37.3 93.8 107.4
26 62.5 54.9 7.43 6.55 9.53 9.60 9.50 42.9 37.1 93.3 107.5
27 62.4 54.8 7.43 6.54 9.55 9.62 9.52 42.6 36.9 93.2 107.7
28 62.1 54.5 7.41 6.51 9.47 9.59 9.50 41.6 36.8 93.3 107.2
29 62.5 54.7 7.39 6.48 9.49 9.57 9.52 41.7 36.9 93.4 107.3
30 62.6 54.8 7.41 6.48 9.48 9.56 9.48 41.7 36.9 92.6 107.4
31 62.5 55.0 7.42 6.46 9.46 9.55 9.48 40.5 36.7 92.4 106.8
Av. 62.0 55.2 7.29 6.53 9.51 9.62 9.56 42.8 37.9 95.7 107.0
AUGUST.
1 62.9 55.3 7.41 6.45 9.47 9.54 9.44 38.6 36.7 92.1 107.1
2 63.4 55.8 7.41 6.47 9.52 9.56 9.52 38.3 37.0 91.9 107.1
3 63.5 55.9 7.41 6.45 9.51 9.58 9.50 38.6 37.3 92.4 107.2
4 63.1 55.8 7.43 6.45 9.53 9.57 9.53 38.2 37.3 92.3 107.2
5 63.1 55.6 7.44 6.44 9.52 9.58 9.56 38.1 37.2 92.4 106.8
6 63.1 55.3 7.45 6.40 9.51 9.58 9.56 38.2 37.1 92.2 107.1
7 63.1 55.2 7.44 6.39 9.51 9.56 9.57 37.8 37.1 92.1 107.3
8 63.7 55.5 7.41 6.37 9.46 9.55 9.56 38.0 37.4 92.1 108.0
9 63.7 55.7 7.43 6.39 9.47 9.54 9.53 37.9 37.4 92.1 107.9
10 63.8 55.6 7.43 6.39 9.47 9.54 9.51 37.9 37.3 91.7 106.9
11 64.1 55.8 7.41 6.39 9.51 9.54 9.52 38.1 37.3 91.8 106.5
12 64.3 55.9 7.41 6.43 9.54 9.55 9.50 38.0 37.4 91.7 105.8
13 64.3 55.8 7.42 6.45 9.55 9.57 9.54 37.8 37.2 91.4 105.7
14 64.2 55.8 7.40 6.41 9.54 9.57 9.54 37.8 37.3 91.8 103.9
15 64.4 55.7 7.40 6.40 9.56 9.59 9.57 37.8 37.4 91.5 102.9
13116 64.2 56.0 $7.44 $6.41 $9.58 $9.61 $9.57 37.9 37.6 91.7 103.1
17 64.4 56.1 7.42 6.42 9.61 9.62 9.62 37.7 37.3 92.1 102.6
18 64.4 56.0 7.43 6.42 9.63 9.64 9.64 37.6 37.6 92.3 103.0
19 64.4 56.0 7.46 6.44 9.65 9.66 9.68 37.6 37.6 92.4 102.9
20 64.5 55.9 7.47 6.43 9.65 9.68 9.62 37.7 37.6 92.6 103.0
21 64.9 56.3 7.46 6.44 9.65 9.67 9.63 38.0 37.9 92.9 103.5
22 64.9 56.1 7.47 6.45 9.65 9.67 9.71 37.8 37.8 92.9 103.3
23 64.8 56.2 7.50 6.47 9.67 9.67 9.70 37.9 37.7 92.9 103.6
24 64.7 56.2 7.52 6.48 9.73 9.72 9.70 37.6 37.6 92.5 103.8
25 64.7 56.3 7.56 6.50 9.76 9.77 9.69 37.6 37.6 92.6 103.6
26 64.7 56.3 7.57 6.50 9.76 9.75 9.70 37.4 37.6 92.9 103.5
27 64.7 56.5 7.58 6.51 9.74 9.75 9.68 37.5 37.6 93.2 102.7
28 64.8 56.4 7.60 6.53 9.74 9.76 9.66 37.2 37.4 93.4 102.3
29 64.6 56.4 7.57 6.53 9.77 9.77 9.67 37.1 37.4 93.1 101.9
30 64.6 56.5 7.57 6.50 9.81 9.79 9.70 37.3 37.3 92.6 101.6
31 64.2 56.5 7.57 6.51 9.81 9.80 9.68 37.6 37.4 92.7 101.5
Av. 64.1 55.9 7.47 6.45 9.61 9.64 9.61 37.9 37.4 92.5 104.6
SEPTEMBER
1 64.7 56.8 7.55 6.49 9.82 9.69 38.1 93.6 101.5
2 64.7 57.0 7.54 6.48 9.84 9.70 38.3 93.8 101.6
3 64.7 57.0 7.55 6.49 9.87 9.73 38.3 93.9 101.8
4 64.9 57.3 7.59 6.51 9.87 9.74 38.3 94.3 102.1
5 64.7 57.3 7.60 6.51 9.88 9.72 38.2 94.0 101.8
6 64.7 57.1 7.62 6.52 9.87 9.69 38.5 94.0 101.6
7 64.7 57.2 7.65 6.54 9.86 9.68 38.3 94.1 101.7
8 64.8 57.2 7.65 6.54 9.87 9.67 38.4 94.2 101.6
9 64.6 57.5 7.70 6.58 9.86 9.64 38.2 94.3 101.6
10 64.5 57.0 7.73 6.61 9.84 9.64 38.3 94.4 101.1
11 64.3 57.3 7.69 6.59 9.86 9.65 38.3 94.5 101.2
12 64.1 56.9 7.67 6.60 9.88 9.67 38.4 95.0 101.1
13 63.9 57.1 7.64 6.58 9.85 9.67 38.6 95.7 101.2
14 63.7 56.9 7.60 6.55 9.85 9.67 38.5 95.8 101.3
15 63.4 56.6 7.62 6.57 9.85 9.64 38.5 96.0 101.5
16 63.2 56.3 7.62 6.53 9.81 9.61 38.6 96.1 102.1
17 62.9 56.3 7.60 6.57 9.79 9.62 38.7 96.0 101.9
18 63.0 56.2 7.60 6.58 9.80 9.63 38.6 95.8 101.4
19 63.3 56.3 7.60 6.58 9.85 9.71 39.0 96.5 101.3