TABLE OF CONTENTS
Reading edition
PART I.
Our Present Price-Registering System 7
The Three Price-Making Forces 11
Criticism of Our Price-Making System 15
Supply and Demand 20
Can “Price” Make “Supply and Demand”? 22
Cost of Production 26
Ratio Method of Determining Cost of Producing Hogs 30
Supply and Demand Versus Cost of Production 36
Cattle Prices and the Ratio Method 39
Packer Prices and the Ratio Method 41
Milk Price Determination 44
Cost of Producing Crops 49
Consumers’ Ratios 52
Technique of the Ratio Method 57
Limitations of the Ratio Method 60
Retail and Wholesale Prices 62
Pork Exports the Barometer of Corn Belt Prosperity 64
Corn Belt Land Values and the Cost of Producing Corn 72
Price Stability and Soil Fertility 74
Measuring Total Crop Production 75
PART II.
Mathematical Study of Supply and Demand in the Hog Market 81
Predicting the Future of Hog Prices 98
Limitations of the Mathematical Method 103
Conclusions Based on Ratios and Mathematics of Supply and Demand 106
Appendix 113
7
OUR PRESENT PRICE-REGISTERING SYSTEM[1]
Prices of corn belt food staples are registered more promptly and more delicately on the Chicago Board of Trade than anywhere else in the world. The farmer visitor in Chicago, who has a few minutes to spare, finds it very interesting to look down from the Chicago Board of Trade galleries on the corn pit. For several minutes, the pit may be the dullest thing imaginable, and suddenly news will “break.” Perhaps it is the month of August, and it has begun to rain in Nebraska. As a result, certain operators are anxious to dispose of the corn for which they had contracted. Perhaps it is 9:30 on another August morning, and the temperature, even this early in the day, is 85 degrees, and the prospects are for hot winds sweeping Kansas and southwestern Iowa. Men who have sold corn “short” a few days before, on the strength of local rains, are now thoroly scared, and rush into the pit to buy back before the price runs up more than three or four cents.
The farmers sitting in the gallery, watching the speculators buy and sell “paper” corn, by shaking their fists and nodding their heads, feel that the Board of Trade is a gambling institution. So firm is this conviction that several of our largest farmers’ organizations have gone on record as being opposed to the speculative system as a method for registering prices of farm products.
So far as the business world is concerned, the system of buying and selling future contracts employed by the Board of Trade is in the nature of risk insurance. A feed concern may have sold to farmers twenty carloads of their feed at a price based on $1.20 corn. They have not bought this corn as yet, and do not have room to store it. They therefore buy a contract for future delivery at $1.20, in order to protect themselves against corn going up in the meantime. This feed concern is in the manufacturing game; it can not afford to take a risk, and for that reason buys a future on the Board of Trade. When this feed concern accepts the actual corn, it sells the contract. It may make or lose money on the purchase and sale of the contract, but in either event the 8net result is that the actual corn cost $1.20 per bushel plus the commission charge of a fraction of a cent per bushel.
The speculator takes the risk, and the spirit in which he approaches the game is often the gambling spirit, pure and simple. But, like all shrewd gamblers, he takes his risks as shrewdly as possible, and after a time becomes expert in judging the probable effects of weather, political news, transportation difficulties, etc., on corn prices. And these factors are more real than some of our agitators would have us believe.
But while speculators perform a real service to society, there is nothing angelic about them. They are concerned with a profit, not with service. The professional speculator is generally either “long” or “short” of the market; that is, he has corn bought or sold for future delivery. The man who has December corn bought for future delivery at $1.20 per bushel is hoping with all his energy that the corn crop is short and price will therefore advance, that transportation difficulties will materialize, that an unusual demand will spring up from Europe for foodstuffs, that something will happen to send up the price. He is favorable to the promulgation of any kind of news which will help him to sell his corn at a profit. While the Board of Trade has regulations against the dissemination of false news, nevertheless these men at times seem to be able to color the crop news very effectively. Situations develop where most of the professional speculators are on one side of the market, and where they are apparently able to use propaganda to force prices very rapidly either up or down, at the expense of the amateur speculators.
The products most traded in on the Board of Trade are wheat, corn and oats, and to a lesser extent the cured hog products, rib sides, lard, and mess pork. The smallest units traded in are 5,000 bushels of grain and 50,000 pounds of provisions. In the case of the grains, the contracts most commonly traded in are contracts for delivery in December, May, July and September. In the case of the pork products, the contracts most traded in are contracts for delivery in January, May, July and September. Before the war, trading in December corn customarily opened in the month of May. The price of December corn as quoted in May was necessarily based on the supposition that the ensuing crop would be a normal crop, neither greater nor less than the average. If there was cold, wet weather in May or June, the price advanced. If the weather was warm and rather dry, the price declined slightly. However, as a general proposition, before the war, the price held practically steady during the months of May and June. During 9July and August, however, corn values on the Chicago market oscillated back and forth with rainfall and drouth, registering the changes in marvelously delicate fashion. Customarily, before the war, it took an average rainfall, in the seven great corn states, of about one and a quarter inches during ten days, to hold the price of December corn futures practically stationary. A rainfall of as much as one and three-quarters inches in a ten-day period during July and August would ordinarily depress the price by several cents a bushel, whereas a ten-day period with no rainfall at all would customarily advance the price by eight or nine cents a bushel or even more if the temperature was high.
Anyone who studies these things is surprised at the accuracy with which the market price before the war actually reflected crop conditions as they changed from day to day. Since the war, it has been more difficult to measure the price-making forces. Political conditions in Europe even during the months of July and August often have had as much influence as the weather in determining the price of corn.
The Board of Trade has to do with both cash grain and future trading. So far as prices are concerned, the cash market is supposed to be less sensitive than the market for futures. The business of the future market is to register changing conditions as promptly and accurately as possible. Occasionally, however, artificial situations develop. For instance, in a year of a very good corn crop, a large number of speculators may have sold December corn “short” at around $1.20 a bushel. At the time of the sale, they may have had every reason to believe that they could eventually buy the actual grain for less than this price when the month of December finally arrived. Then gradually transportation difficulties began to grow and bad weather came on, and altho there might be an enormous crop in the country, there would be very little corn in Chicago. Then certain other speculators might go to work buying large quantities of December corn futures, knowing that other men were “short” a long line of December corn at $1.20. These speculators might not actually want the corn, but nevertheless, by playing the technique of the market, might be able to create a “squeeze” and force the price of corn up to $1.50 a bushel before permitting the “shorts” to settle. And this might happen in spite of the fact that by January 2d there might be enough actual corn coming into Chicago to enable cash corn to be sold as low as $1.20.
The object of this book is neither to praise nor condemn the speculative system as a method for registering prices of farm products. We are pointing out the strong points in the present 10system. Idealistic social workers, representatives of organized labor, and many farmers, would like to do away with the speculative system of registering prices. They would like to substitute therefor price-fixing legislation. These people, as a rule, are densely ignorant of the legitimate price-making forces, and it is impossible that they should be able to shape a price-registering machinery superior to that which we now have.[2]
One reason for the writing of this book is the belief that organized farmers and organized labor, working in conjunction with certain idealists, will make an effort to modify our present price-registering system. We are heartily in sympathy with such an effort, for the speculative system is far from perfect. But it is such a delicate system of registering prices that we believe that even the most virulent opponents should allow the system to run unchecked for a good many years yet, in order that they may study its functions more carefully. Here is a great field of research for the economists, who for some unknown reason have failed to study Board of Trade prices during the past fifty years as closely as they should.
Improvement on our present system can be made only after a thoroly scientific and dispassionate study of its strength and weakness.
11
THREE PRICE-MAKING FORCES
Three forces are prominent in making agricultural prices—cost of production, supply and demand, and strategic considerations. Farmers and laborers believe that cost of production should be the chief consideration. Business men preach “supply and demand” as the great price-making force, and in addition use strategic propaganda when it is to their advantage to do so.
Cost of production in the long run is on the average practically identical with both the supply-and-demand price and the actual price. It is in the very nature of things that those producers who can not on the average get cost of production will go out of business. In the case of the hog business, it takes about three years for the average man to get in and out. Ten years, which is fully three times the “in and out” cycle, is “long run” in the hog business. A ten-year average of actual hog prices should therefore be approximately equal to a ten-year average of the cost-of-production price of hogs. As a matter of fact, we find that the cost of production, as shown by the corn-hog ratio, is practically the same from one decade to the next. Decade after decade, the corn-hog ratio has remained constant at eleven to twelve bushels of Chicago corn per hundred pounds of Chicago hog ever since the Civil war. Farm management investigations indicate that for the average farmer this ratio represents approximately cost of production. As a matter of fact, this ratio is “cost of production” in the very truest sense of the term. This ratio represents the reward necessary to keep enough farmers producing hogs to satisfy the consuming demand, year in and year out. Stated thus baldly and simply, we see how the cost of producing a hundred pounds of hog weight must in the long run average the same as the “actual” price and also the “supply and demand” price. And yet hogs may sell for a year or so for the value of fifteen bushels of corn, as they did in 1866 and 1910, or they may sell for a year or so for the value of nine bushels of corn, as they did in 1908 and 1917. At any given time, the cost-of-production price is likely to be decidedly lower or higher than the actual price or the supply-and-demand price. It is only on the average that cost of production becomes identical with the actual price.
Supply-and-demand price departs from the cost-of-production price at any given time because of such things as unusual weather, accidents, etc. Dry weather in July and August may cut the corn 12crop short, and as a result temporarily increase the number of hogs marketed. Under such conditions, the packer buyers make no attempt to pay for the hogs the increased price which the higher price of corn would warrant, but instead buy as cheaply as they can, quoting in defense, “supply and demand.”
A business panic may come on, as in October of 1907, and as a result the demand for meats of all kinds may shrink. Corn prices, the cost of producing hogs, may stay up, as was the case in 1907–1908, but hog prices nevertheless are reduced. A study of the hog market for many years past reveals the fact that the immediate price-making force is “supply and demand,” and that “cost of production” has no influence whatever on prices except in the long swings.
The supply-and-demand theory of prices is well understood by nearly every one. Supposedly, actual prices at any given moment represent an equilibrium of supply and demand. The next day larger supplies come in, and the demand remains unchanged; naturally the price declines to a point where supply and demand are again equal. There is a presumption in the minds of many people that supply and demand interact with almost mathematical accuracy to determine prices. In the long run, possibly this is true. The day-by-day price, however, is as much a matter of psychology as mathematics.
This brings us to a consideration of those more intangible price forces which may be grouped together under the head of strategy. In January and in August of 1919, we had excellent examples of the use of strategy as a price-making force. In both months, certain powerful interests worked in conjunction with the newspapers to modify public psychology in the interests of lower prices. Day after day, the lower price bombardment was directed against the farmers by the daily press and the politicians. Prices declined in spite of the fact that the supply was greatly curtailed and the potential demand was as great as ever. In the corn market, receipts were exceedingly light at Chicago during both price raids. Hog receipts in August of 1919, when prices dropped $5 per hundredweight, were the smallest of the year. But government officials constantly talked about the vast army supply of bacon. As a matter of fact, the quantity of pork products put on the market by the government was not enough to account for much of a drop in hog prices. But the publicity which went with the government announcements, combined with determined pressure on the speculative markets in this country and abroad, sufficed to lower prices 13tremendously in defiance of any mathematical expression of supply and demand.
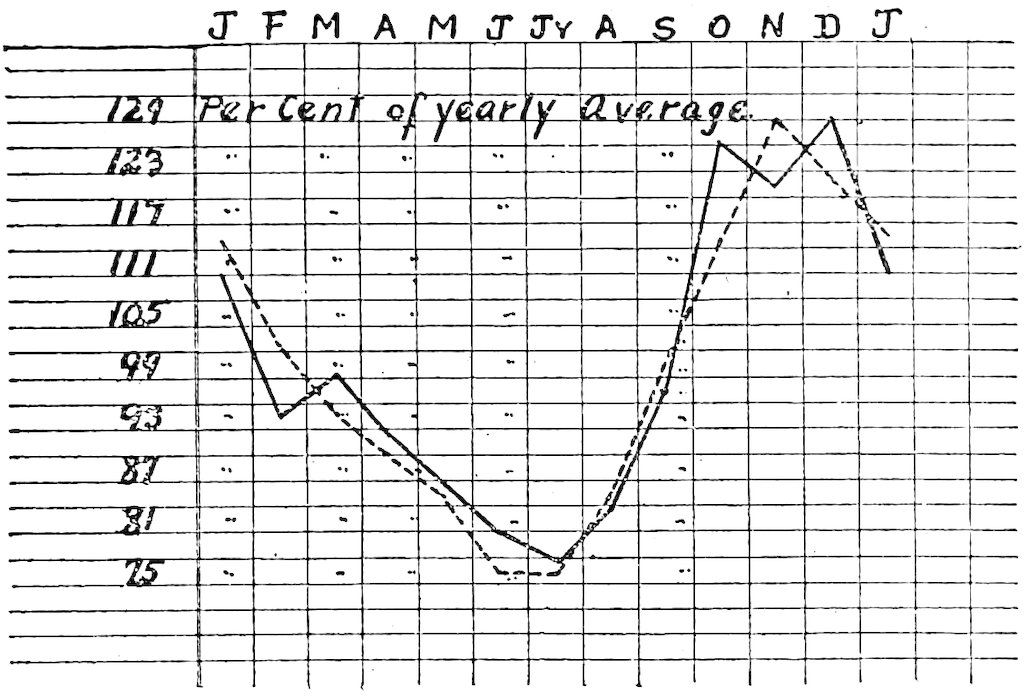
Solid line shows exports from U. S. Dotted line, ocean freights from New York to Liverpool. Ocean freights are low in summer when exports are low, and high in the fall when exports are heavy.
There is a strategy to the timing of a determined price drive. All farmers know that such a drive may be expected in the fall of the year. A drive in the fall is partly normal as a result of the increased supply at that time, but oftentimes strategic. In the fall of 1865, following the Civil war, there was a determined price drive, roughly corresponding to the price drive initiated in August of 1919. In both cases, strategic factors were apparently paramount. Certainly, no mathematical formulation of the law of supply and demand could account for the price changes which took place in 1865 and 1919.
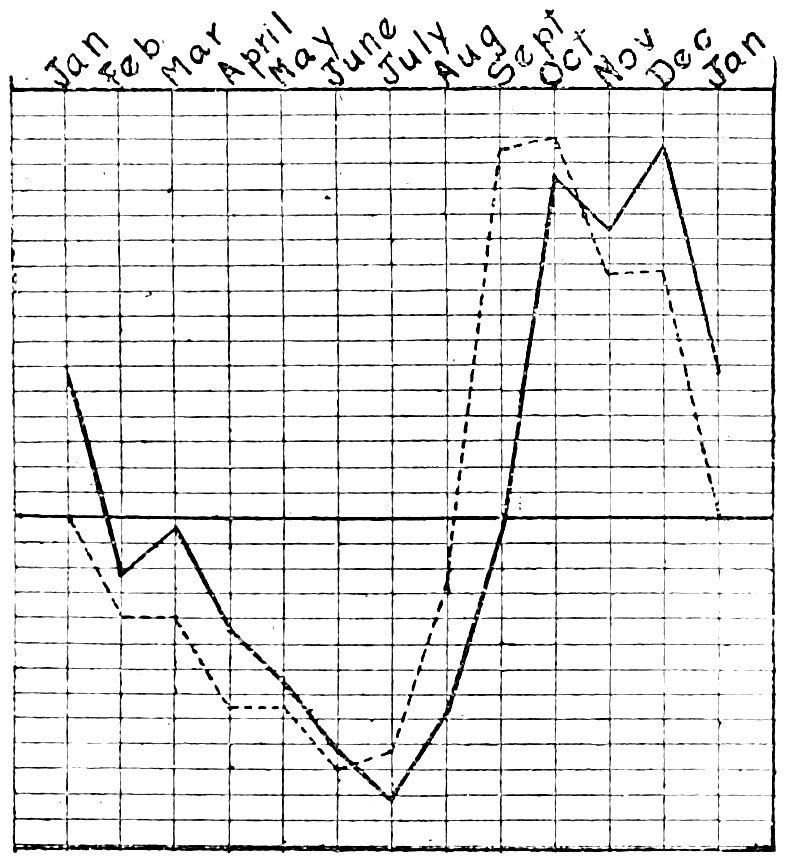
Solid line, U. S. exports; dotted line, British exchange in U. S. Dotted line is inverted to show how heavy exports and weak exchange go together. Chart is based on 1903–1913 conditions.
Farmers have discovered since 1914 that such disturbances as foot-and-mouth disease, interrupted railroad service, and falling foreign exchange may influence prices without changing either potential supply or potential demand. They have suspected the “interests” of manipulating foreign exchange in the fall of the year to make lower price for farm products. They have known that ocean freights have generally advanced in the fall of the year, to the detriment of farm product prices in the United States, and they have suspected that part of this advance in ocean freight rates was due to England trying to get a large return on her shipping and at the same time buy her food more cheaply.
The two charts presented herewith indicate the normal seasonal trends, during the decade 14preceding the war, of exports from the United States as related to British exchange, and to ocean freights from New York to Liverpool. It will be noted that United States prices must necessarily be weakened in the fall of the year by weak British exchange and high ocean freights.
The speculative price as set from day to day is sometimes a result of technical situations altogether apart from supply and demand. Ordinarily, the speculative price as represented by “futures” and the cash price move in sympathy, but occasionally a scared “short” finds the market oversold and bids up prices unduly in an effort to cover, or a tired “long” finds the market overbought and sends prices down unduly in an effort to sell. And occasionally there is manipulation—interests working together to make the price temporarily higher or lower than a normal working of supply and demand would justify. Sometimes the cash markets, following the lead of the speculative markets, may get out of line with ultimate supply-and-demand conditions for several months at a time.
15
CRITICISM OF OUR PRICE-MAKING SYSTEM
Prices of corn, hogs, etc., are determined chiefly by supply and demand, together with the occasional influence of strategic manipulation. The system as operated by the packers and Board of Trade speculators really reflected conditions before the war with remarkable accuracy. During the war, so many extraordinary conditions were at work that it was impossible to measure supply-and-demand conditions at all accurately, and it is impossible to say how efficiently the speculators did their work.
But speculators and packers, in so far as they set prices, are concerned solely in making a profit for themselves. If, by manipulating the market, they can make a bigger profit than by trying to express supply-and-demand conditions with mathematical exactitude, then they may be expected to manipulate. The violence with which hog prices swing above and below cost of production would suggest that the packers are consciously endeavoring to send prices too low for a year or two, in order later to send them too high. They go into the low-price period with a small amount of high-priced products on hand, and come out into the higher level with a large quantity of low-price products. It would seem that by laying in a stock of hog products at the low point, they hope to profit later by an advance in price.
It is typical of supply and demand, as it makes prices of standard farm products, that a small crop sells for more than a large crop. A twenty per cent decrease in the supply raises the price more than twenty per cent, possibly thirty per cent, or even fifty per cent. Old Gregory King, in the latter part of the Seventeenth century, recognized this principle when he stated:
“We take it a defect in the harvest may raise the price of corn [wheat] in the following proportions:
Defect. Above the common rate.
1 tenth raises the price 3 tenths
2 tenths raises the price 8 tenths
3 tenths raises the price 16 tenths
4 tenths raises the price 28 tenths
Modern statistical study indicates that this statement of King’s is somewhat exaggerated, but undeniably the tendency exists among standard agricultural products for small crops to bring in 16a greater return than large crops. In other words, the demand for farm products is inelastic. The ultimate consumer wants just so much of staple foods, no more, no less. If farmers raise more than so much, they must accept a considerable reduction in price; if they raise less, they can command an advance out of all proportion to the shortage. The law of demand for staple farm products being inelastic, small crops bring in a greater return than large crops.[3]
The classical economists, the people of laissez faire persuasion, accept this condition as natural, as inevitable, and therefore desirable. But is it desirable? The sharp price rise which comes as a shortage becomes apparent benefits those lucky producers who have supplies on hand, and especially those keen speculators who first saw the oncoming shortage and bought in anticipation. This sharp price rise may overstimulate production. The high hog prices in 1909–1910 stimulated the production of too many hogs, and when this increased production reached market, the price was $6.50 instead of the expected $8 to $10. And the low prices of 1911–1912 in turn begat the high prices of 1913–1914.
The question comes, Would it not be to the public interest if, in price making, more emphasis could be placed on cost of production and less on the short-time working of the law of supply and demand? Prices should rise with a short crop, but not to such an extent as to make a short crop more profitable than a normal crop. If a moderate rise in prices will not sufficiently curtail demand, then the public should be educated to the fact that there has been a drouth, and that unless they curtail their demand, there will not be enough to go around. Of course, under our present laissez faire attitude, every speculative business man would take such a pronouncement as a “bull” statement, and the demand would immediately increase instead of decrease. There is danger that any attempt to make cost of production the guiding factor in price determination will amount to close government supervision of storage, speculation and similar market phenomena. The disadvantages of government supervision are apparent to all who watched the Food Administration at work during the war. The Food Administration performed a hard job remarkably well, but farmers found that the officials were ignorant of agriculture, and that, moreover, agricultural interests could not expect a square deal except in so far as they were organized to compel a square 17deal, or except as the emergency itself compelled a square deal to insure continued production.
If farmers are to continue under the present laissez faire system with supply and demand, together with strategic manipulations, as the price-making force, they must necessarily learn to play the game themselves. They will find it necessary to practice sabotage in the same scientific, businesslike way as labor and capital. They will reduce the size of their crops at strategic moments, because they know that small crops ordinarily bring in a greater return than large crops. Of course, if farmers should practice sabotage in the same heartless, efficient way as labor and capital, our society will be imperiled. The burden of the sabotage practiced by labor and capital has been borne chiefly by the farmer. When farmers also practice sabotage, labor and capital will be forced to come to an agreement with farmers on production and price matters.
Is there not a possibility that capital, laborers and farmers, by placing themselves in equally powerful bargaining positions, may come to see the futility of sabotage as a price-sustaining force? Once farmers are able to meet the other classes of society on equal terms, all three classes ought to unite on production as the source of profit, rather than on clever bargaining. This involves close-knit organizations of both farmers and laborers under the leadership of men well educated in general economics, in strategic bargaining, and in production. There must be men studying the system as a whole, men who perceive the legitimate physical difficulties which our society faces. The labor leaders must come to see that there is a point beyond which labor can not go in raising wages and reducing hours. Farm leaders must come to see that there is a point beyond which farmers can not go in reducing acreage and raising prices. Business leaders must come to see that the common people will not stand for curtailment of production to two-thirds factory capacity in order to secure abnormal profits, when by running the factories to full capacity the business will give normal profits. The best brains of all classes must unite in overcoming legitimate physical handicaps, not in figuring out ways in which a specific class may benefit at the expense of other classes. In the meantime, farmers must learn to use sagacious sabotage as effectively as labor and capital. Otherwise they will continue to be at the mercy of capital and labor.
What is the best means of overcoming the food shortage resulting from drouth? Laissez faire economists and business men say: Let high prices curtail demand and stimulate production. 18But this remedy is “locking the stable after the horse is stolen.” Is it practical to build government warehouses to store wheat in years when the acre yield is more than fifteen bushels, and from which wheat may be drawn in years when the yield is less than thirteen bushels?
No scheme of this sort can be definitely laid out in advance. But statistical science will soon reach a point where it should be possible to meet our physical handicaps in the way of drouth, floods and accident, in the spirit of doing what is best for society, instead of utilizing the crisis for individual or class profit.
If we are to continue our present complex society, we must educate our children very thoroly in social mathematics. Our problems are not only problems of the spirit, but also of exact measurement. What is the fair price for bacon? This involves the cost-of-production idea. Is bacon relatively lower or higher than hogs? Are hogs relatively lower or higher than corn? Is there a normal supply in the country? If bacon were lower in price, would the future supply be imperiled? Would an injustice be done to farmers? If bacon were higher in price, would an undue profit accrue to the packers, or would the farmers be stimulated to produce too many hogs a year from now?
Possibly it will be wise for the government to provide funds to finance a Price Publicity Committee, to be made up of economists appointed by our state universities and agricultural colleges. The duty of this commission would be to make public week by week the relevant price facts. They would point out which products are relatively high and which are relatively low, and issue index numbers of various kinds, in an endeavor to educate the public to fundamental price facts. The object of such a Price Publicity Committee will be to furnish such constant publicity that it will be difficult for any product to sell for any length of time either above or below cost of production. And in saying this we define cost-of-production price as that price which is necessary in the long run to keep enough producers in the business to satisfy the demand. It is believed that adequate publicity will favor the prevailing of the long run cost-of-production price as opposed to the short run supply-and-demand price.
Men in whom the laborers of the country have faith should have an intimate, statistical knowledge of the supply and demand forces as they make prices and as they make for the prosperity of laborers and society as a whole. Men in whom farmers have faith should have an intimate, statistical knowledge of labor and business problems in order that they may know approximately 19when labor and business are charging fair prices for their services. Business men already have a fair statistical knowledge of farming and labor conditions, but they need an even more intimate knowledge, as well as a change of heart. They must learn to operate their businesses from the standpoint of greatest service and a fair profit, not from the standpoint of greatest profit. Those businesses which do not learn this may expect to be taken over either by the government, organized labor, or organized farmers, if not in one way, then in another.
20
SUPPLY AND DEMAND
Both farmers and city consumers have expressed much dissatisfaction in recent years with the methods of price determination as used by the boards of trade and packing houses. The representatives of the boards of trade and packing houses have answered these complaints with the simple formula, “supply and demand.”
During the war, many people announced that prices in the United States were no longer the result of supply and demand. For a period of two and a half years, wheat prices were held at approximately $2.20 a bushel, in spite of the fact that both supply and demand conditions were varying constantly during this period, and in spite of the fact that under supply-and-demand conditions as they ordinarily work, prices might have been expected to have gone as high as $4 and as low as $1.50, at different times during this period of two and one-half years. Social workers and others of idealistic temperament who have always been pained with the rather heartless way in which the law of supply and demand has worked, were much pleased with the stabilized wheat price, and referred to it as an instance of the repeal of the law of supply and demand.
Of course, the law of supply and demand never has been repealed, and never will be repealed. Instead of trying to repeal it, we should try to secure the best type of price-fixing machinery thru which this law may work. Man has not repealed the law of gravitation, but has devised such machines as automobiles, airplanes, etc., thru which he accomplishes his purposes notwithstanding.
Our city friends who favor government attempts to repeal the law of supply and demand and to fix uniform and relatively cheap prices should direct their efforts toward the search for a new price-fixing machinery. For arbitrary interference with this law invariably brings penalties in the form of conditions which often are more severe than the condition which it was hoped to improve.
What we should strive for rather is a better understanding of the law of supply and demand, in the hope that we may be able to modify the severity of its operation and thus avoid periods of feast and famine, with their unreasonably low prices and unreasonably high prices.
Thousands of men in the corn belt, especially the leaders of 21the organized farmers, should be familiar with the normal, mathematical working of the law of supply and demand. They should know not only when prices are lower than warranted by the supply, but just how much too low. Exact measurement is necessary in order to perceive when unusual factors are at work. The price indicated by a mathematical interpretation of supply and demand may be $1.25 for corn, whereas the actual price, because of a purely speculative drive, may be only $1. It is wise to measure prices to some extent by purely mathematical considerations, in order that we may perceive more clearly when extraordinary forces are at work.
After having arrived at a price based on a mathematical interpretation of supply and demand, the problem is to determine to what extent extraordinary forces are at work and to what extent it may be worth while to combat them by extraordinary measures. If corn is 15 cents a bushel below the mathematically justified price, will it be advisable for farmers generally to hold their corn and cause a shortage at the terminal markets? Will it be advisable to put out newspaper propaganda showing the public how the market price of corn is below cost of production, or put on an advertising campaign to increase the demand? These matters of larger policy are mostly outside the field of mathematics. They are largely matters of strategy. How much bargaining force do the farmers represent? To what extent will they follow directions? At what season of the year is it best to strike?
Generally speaking, a farmers’ drive for higher prices would best begin about January 1st, and should reach its greatest intensity about March 1st. After March 1st, seasonal scarcity begins, and no further propaganda is needed. A consumers’ drive for lower prices best begins about August 15th, and reaches its greatest intensity about October 15th. After October 15th the seasonal surplus, especially of corn and hogs, begins, and there is no further need for consumers to bring artificial propaganda to bear. It is interesting to note in this connection that the “bear” campaign engineered by the governments of the world in 1919 began in late July and continued until about October 15th, at which time the weight of the season’s marketings was sufficient to hold prices down without additional use of newspaper space.
After a mathematical study of prices, the leaders of farm organizations, in so far as they attempt to influence prices, must consider the state of the export trade, rate of foreign exchange, ocean freights, world crop conditions, business conditions at home and abroad, and, in fact, all the factors which the trained speculators 22take into account on the Board of Trade. They must take all of these things into account, and yet be able on occasion to act decisively. They must learn to play the game in the same fashion as a skillful whist player. They must not “overbid” their hand, but bid its full worth, and they must take all the tricks they can.
To have even a fair chance of success in an effort of this sort, farmers must set up a very strong statistical organization, in charge of a highly competent staff of thoroly trustworthy experts. For farmers themselves have neither the time nor the opportunity to secure the training necessary to enable them to acquire and assimilate the information needed.
23
CAN “PRICE” MAKE “SUPPLY AND DEMAND”?
Dissatisfied farmers and city consumers have been told often that “supply and demand” makes the price. Economists have backed up the Board of Trade people and the packers in making this assertion.
But is it not almost equally true to say that “price” makes the “supply and demand”? Is it not possible to set a price which, as can be demonstrated mathematically, is out of line with the present supply and demand, and thru this price to create new and unexpected supply-and-demand conditions?
It is conceivable, for example, that oleomargarine might be sold for several years at a price below that warranted by supply and demand and equally below a price warranted by cost of production. It is conceivable that the abnormally low price, without reducing the supply, would increase the demand and result in the formation of the oleomargarine habit among millions of people. And it is equally conceivable that later on the price of oleomargarine might be increased more nearly to a parity with butter, and that the oleomargarine eating public might continue the oleomargarine, even tho it was underselling butter by only 10 cents a pound, instead of the 15 cents a pound differential which was existing when the habit was formed.
A low price may be used to create a demand, which will continue even after the low price no longer exists. In like manner, a low price may be used to curtail the supply of the competing article. In the illustration, an artificially low price for oleomargarine might reduce the demand for butter, thereby reducing the supply, and increase the demand for oleomargarine, and this situation of a reduced supply of butter and an increased supply of oleomargarine might continue, even tho the price of oleomargarine were later raised to its customary relationship with butter. Price may act as a cause and “supply and demand” may be a result.
In open, competitive markets, “supply and demand” generally comes first and price follows after. Before the war, for instance, the dominating factor in the corn market was the supply of corn, and during the months of July and August, when the new corn crop was being made, the price of corn varied with almost mathematical accuracy with the rainfall and temperature which were making the new corn crop. The demand for corn was a fairly 24constant factor. The supply of corn was the price-making force.
Since the war, corn prices have not been the result of “supply and demand” in the sense that they were before the war. During 1919, price often came first in the corn market, and supply and demand followed afterward. For example, in January and February, 1919, corn prices broke 20 cents a bushel, in spite of the fact that receipts at central markets were decidedly below their customary level. Influential people had postulated the theory that the war was over, and that supply and demand, if given an opportunity, would operate to bring about a lower price level. They set a lower price level, but supply and demand refused to operate on the new level. The lower corn prices which prevailed during the spring of 1919, however, probably had a very material effect on the acreage planted. At any rate, there was about four per cent less corn planted in 1919 than in 1918.
According to the customary view, when the supply is smaller than usual, the price should be greater than usual, and vice versa. In the hog market this does not necessarily hold true. In November of 1907, hog prices were dropped with a terrific jerk, as a result of certain unusual conditions. The drop was so great that farmers refused to market their hogs, and receipts of hogs in November of 1907 were about one-third smaller than in the ordinary November. The price of hogs was lower than customary by about one-fourth, and the supply of hogs marketed was less by about one-third. A similar situation prevailed in August of 1919. Prices dropped about $5 per hundredweight, or faster than ever before in history. Receipts also dropped, and much fewer hogs were received than in the ordinary August.
In both 1907 and 1919, the packers figured that the business world was so upset that to be on the safe side they would best buy their hogs cheaper than they had been buying them. Farmers were slow to realize just how great the disturbances had been in the business world, and failed to understand that in a situation of this sort the packers could put thru their program for lower prices, in spite of reduced hog receipts for a month or two. It is in the very nature of things that the packers can outlast the farmers at such a game. The packers know more accurately than the farmers the supply-and-demand conditions, and they know that after a hog reaches two hundred pounds, it is only a question of weeks till the farmer will let him go, no matter what the price. It will take an extraordinarily able farmers’ organization to beat the packers at this game, an organization which holds as its trump card “ultimate supply and demand.”
25Prices may make supply and demand, and supply and demand may make prices. First one has the lead, and then the other; they are constantly acting and reacting. Before the war, the relationship in some commodities might be expressed with almost mathematical exactness, but there were constant little departures. Since the war prices have much more often taken the initiative than they did before the war. The result, of course, is a more violently fluctuating condition of both supply and demand.
The problem which farmers and city consumers should put to the Board of Trade people and the packers is: What are you doing to place prices at a point which will result in a more uniform supply and a more uniform demand?
26
COST OF PRODUCTION
The common man prefers to approach the question of price not from the standpoint of supply and demand, but from the standpoint of cost of production. The laboring man says that he has no quarrel with the farmer, that in fact he is glad to pay the farmer what it costs him to produce food. Most people take it for granted that the just price is cost of production. In July of 1917, President Wilson gave his scholarly definition of a just price: “By a just price I mean a price which will sustain the industries concerned in a high state of efficiency, provide a living for those who conduct them, enable them to pay good wages and make possible the expansion of their enterprises which will, from time to time, become necessary, as the stupendous undertaking of this great war develops.”
The idea of a just price, covering cost of production and reasonable profit, is considerably different from market price or supply-and-demand price. The market price typically alternates considerably above and considerably below the production cost of the bulk of the people engaged in the enterprise. For instance, when prices go up and profits become larger, new people are attracted into the business and production is increased until finally there is more supply than there is demand, and then prices have to go down and profits become losses, and the people who can not produce except at the high prices must go out of business. Both the farming world and the business world are composed of a great many different men, each of whom is chasing a profit in his own way. Many of these men are very short-sighted and are lured into an apparently profitable business just at the wrong time, and in like manner become discouraged with an apparently unprofitable business at just the wrong time. Under the competitive regime, it is apparent to any thoughtful business man that both in business and in farming the market price or supply-and-demand price is almost never the same as cost of production, but fluctuates in rather rhythmical manner, now above and then below cost of production, tending to equal almost exactly, over any long period of years, true production cost.
Under the market price or supply-and-demand price system as it has prevailed, the constant tendency is for the wealthier people, both among farmers and among business men, to increase their wealth at the expense of the poorer people. Poor people who 27embark in general business or in farming, no matter how intelligent, are likely to go into and come out of any particular enterprise at just the wrong time. The average man who is moderately well fixed and stays by a particular enterprise year in and year out, manages to secure for himself just a little better than ordinary wages. The man who is wealthy and expands his operations just as prices are starting up, and reduces operations just as prices are starting down, secures large profits.
The fluctuating price system, which means great profits to a wealthy few, serious losses and wrecked lives for a few, and a bare livelihood for many, is the natural result of the laissez faire policy of the old classical economists. Their idea was to let things alone, on the theory that, let alone, prices would sooner or later adjust themselves to the proper point. In practice, prices almost never reach a proper point, but are constantly moving either above or below cost of production. One hundred years of laissez faire policy have demonstrated beyond a doubt that under such a system the wealthy few inevitably become richer, whereas the bulk of the people get just enough to keep them going.
The laissez faire, supply and demand, speculative, or market price system, is condemned by nearly every one except the business men who run it and believe they understand its beneficent workings, and the economists of the classical type who, in their careful reasoning, are unable to think of any other way of determining satisfactory prices over any period of time. The common people and the lofty idealists were greatly elated during 1917 and 1918 at the apparently successful working of fixed prices established more or less in defiance of the speculative or laissez faire price system.
Those who have given the most thought to price fixing advocate as a guide “cost of production plus a reasonable profit.” But what is cost of production? Even in industries so well controlled by man as coal mining, where the weather does not enter in, there are some mines that can produce a ton of coal for two or three dollars, while other mines can not produce a ton of coal for less than six or seven dollars. The North Dakota wheat farmer, in a year of rust, may produce wheat at a cost of four or five dollars a bushel, whereas the Kansas farmer the same year may produce wheat at a cost of only a dollar or a dollar and a half per bushel. Shall both the Dakota farmer and the Kansas farmer be paid cost of production plus a reasonable profit for their wheat? From this standpoint we see that there is no such thing as a standard cost of production. A single producer may be able to determine 28his personal cost of production of a given quantity under a given set of conditions. But in the general sense, as it is commonly thought of, cost of production is a will-o’-the-wisp, a creature that seems to exist but really does not.
Nevertheless, there is a rough-and-ready method of determining cost of production or just price as distinguished from laissez faire or supply-and-demand price. We refer to the ratio method of price determination. Over a long series of years, cost of production plus a reasonable profit is roughly expressed by the relationship which exists between a raw product and the finished product. In rough form it may be most easily grasped in the case of corn and hogs. Over any long period of years, hogs sell on the Chicago market at a price per hundredweight equal to the Chicago price of 11.5 bushels of corn. When hogs have sold for fourteen bushels of corn, they have sold for more than cost of production plus a reasonable profit, while, on the other hand, when they have sold for nine bushels of corn, they have sold for less than cost of production plus a reasonable profit. All this is not saying that certain producers have not been able to make a profit when hogs have sold for nine bushels of corn. Neither is it saying that certain producers may not have been selling at a loss when hogs sold for as much as fourteen bushels of corn. It is simply saying that it has required the pulling power of a price for hogs which is equal to the price of 11.5 bushels of corn to keep enough men in the hog business year in and year out to supply the demand of this country for hog products during the past sixty years. This is what we mean by the ratio method of price determination. It is the only practical method of determining cost of production in such a business as farming, where there are millions of producers working under a variety of conditions.
We have the greatest respect for the old laissez faire or speculative method of price determination. It worked very nicely under competitive conditions, such as existed before the war. No one knows as to whether or not times now are right for adopting a different machinery thru which the law of supply and demand may work. We offer the ratio method as a method which is probably better adapted to a thoroly democratized co-operative society than the old-fashioned laissez faire method, which was adapted primarily to a competitive society.
The spirit of the ratio method is highly technical. The examples given in this book must necessarily be simple. But in actual practice, the ratio method would necessarily become quite technical, requiring for its administration highly specialized statisticians. 29At the present time very few men are available for work of this sort. The ordinary man who tries to fix prices by the ratio method is biased by either personal or class interests. A notable example of this was the Chicago Milk Commission, composed of leading citizens of the state of Illinois, which sat from December, 1917, to February, 1918, and finally offered as a method of milk price determination the ratio method. The majority of the members of this Milk Commission were city people, and on that account, consciously or unconsciously, they twisted the ratio method so as to bring about a low price for milk. If the majority of the commission had been farmers, they could have twisted the ratio method to bring about a much higher price for milk. But there are now, and in the future will be more, men properly trained in the weighting of agricultural index numbers, who can look into matters of this sort with a scientific nicety and determine prices by the ratio method with the greatest accuracy, by which we mean the minimum of bias toward either producer or consumer.
It is our intention in this book to indicate ways of securing ratio prices for various agricultural products. The methods outlined in succeeding chapters are definite and exact; we grant, however, that they may be made more comprehensive and be further refined so as to cover their respective fields in more effective fashion.
30
RATIO METHOD OF DETERMINING COST OF PRODUCING HOGS
The ratio method of price determination was first publicly recognized in the United States by the Food Administration, in November of 1917. A commission of seven swine men had been appointed by the Food Administration to determine the cost of producing hogs, and in submitting their report the commission adopted practically without change the ratio method of price determination as advocated in Wallaces’ Farmer during the summer and fall of 1917. The commission, composed of expert swine men from all over the United States, after a careful technical survey of the situation and consideration of the figures submitted by the author, came to the conclusion that the ratio method actually expressed cost of production more simply and accurately than any other method.
In its simplest form, the hog producer of fifty years ago grasped the ratio idea. Without any statistical investigation, the swine growers of those days came to the conclusion that they could make money when they sold their hogs for a value per hundredweight of more than the value of ten bushels of corn. For a generation or two, hog men looked on a ratio of ten bushels of corn to one hundred pounds of hog flesh as about right, altho they felt that such a ratio might not cover risk.
From an exact statistical standpoint, take the ten-year period extending from 1907 to 1916, inclusive. During that time No. 2 Chicago corn averaged 66.3 cents a bushel, whereas hogs averaged $7.53 per hundredweight. The ratio for that particular ten-year period was 11.4 bushels of Chicago No. 2 corn to equal in value one hundred pounds of Chicago hog flesh. How uniform is this ratio between corn and hogs from decade to decade may be judged from the following table, which gives the ratios as they have prevailed year by year for the past sixty years, and the average by decades. The second column shows the number of bushels of corn required each year to equal in value one hundred pounds of live hog:
1858–1867.
1858 8.7
1859 7.1
1860 12.4
1861 14.0
1862 10.0
1863 7.0
1868–1877.
1868 9.5
1869 14.0
1870 11.9
1871 10.2
1872 11.1
1873 12.3
311864 7.3
1865 16.3
1866 16.2
1867 7.2
Ten-year average 10.6
1874 8.9
1875 11.8
1876 15.3
1877 11.5
Ten-year average 11.7
1878–1887.
1878 9.7
1879 10.3
1880 12.3
1881 12.1
1882 10.9
1883 11.3
1884 10.5
1885 9.7
1886 11.1
1887 12.4
Ten-year average 11.0
1888–1897.
1888 12.3
1889 12.5
1890 9.9
1891 7.4
1892 11.8
1893 16.5
1894 11.6
1895 10.8
1896 10.7
1897 14.2
Ten-year average 11.8
1898–1907.
1898 14.6
1899 12.0
1900 13.2
1901 11.8
1902 11.6
1903 13.0
1904 10.2
1905 10.4
1906 13.4
1907 11.4
Ten-year average 12.2
1908–1917.
1908 8.4
1909 11.3
1910 15.2
1911 11.2
1912 10.9
1913 13.2
1914 11.7
1915 9.6
1916 11.5
1917 9.7
Ten-year average 11.3
To refine the method to meet market conditions, we need to know the ratio between corn and hogs at different seasons of the year. There are seasonal periods of over-supply and scarcity of both corn and hogs. In November, for instance, the 1907–1916 price of corn was 67.2 cents and the price of hogs $7.23, or a ratio of 10.6 bushels to one hundred pounds of hog flesh, while in March of the ten-year period the average price of corn was 61.7 cents and the price of hogs $7.66, or a ratio of 12.4 bushels of corn for one hundred pounds of hog flesh. In like manner, there is a fairly normal ratio for each month of the year and for each week of the year. All this is on the assumption that hogs are simply condensed corn. It does not take into account the fact that hogs have been made out of corn at varying values during a period of about a year preceding time of marketing. Obviously, then, we must have a composite corn value. In matters of this sort, statisticians know that it is absolutely impossible to weight matters so as to represent actual conditions, but at the same time they know that absolute accuracy is not at all essential, that in fact a difference in weighting will ordinarily make very little difference in results.
32While the author personally recommended to the commission appointed by the Food Administration to investigate cost of producing hogs, a slightly different weighting, yet nevertheless we will use here the weighting recommended by that committee. The committee assumed that the corn going into the making of a hog was distributed over twelve months; that during the first month 2 per cent of this corn went into the hog or its dam; the second month, 2 per cent; third month, 2 per cent; fourth month, 3 per cent; fifth month, 4 per cent; sixth month, 6 per cent; seventh month, 5 per cent; eighth month, 9 per cent; ninth month, 15 per cent; tenth month, 20 per cent; eleventh month, 17 per cent, and twelfth month, 15 per cent. Securing composite corn values by this kind of weighting, we find that as an average of the ten-year period, 1907–1916, the January ratio was 11 bushels; February, 11.6 bushels; March, 12.4 bushels; April, 12.7 bushels; May, 12.3 bushels; June, 12.1 bushels; July, 12 bushels; August, 11.8 bushels; September, 11.8 bushels; October, 11.3 bushels; November, 10.6 bushels, and December, 10.4 bushels.
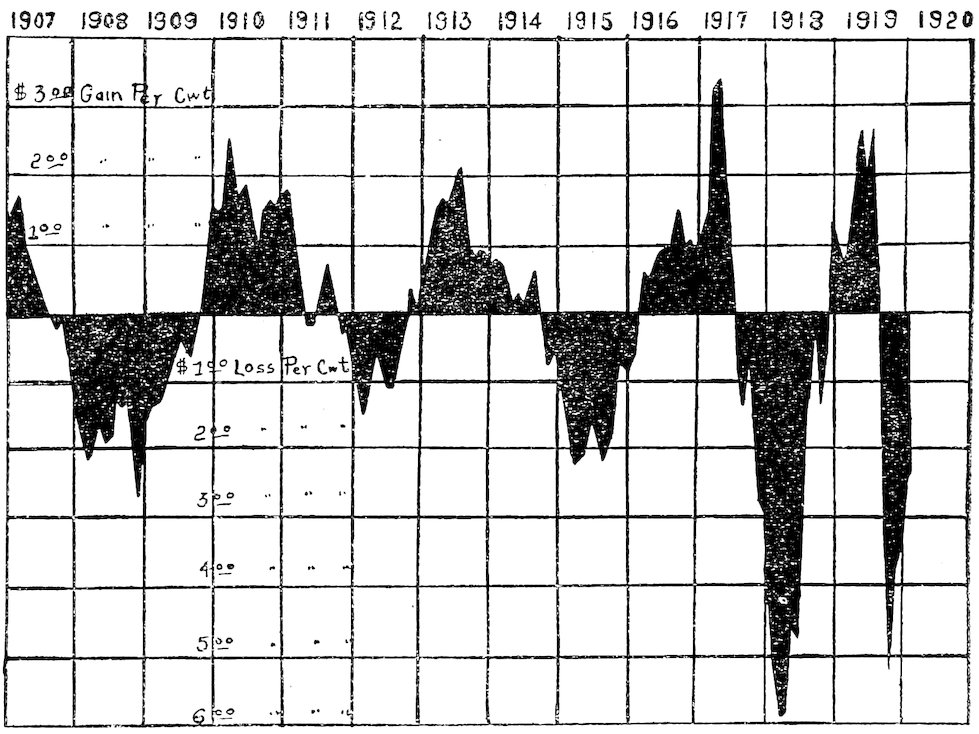
Illustrating the departure of actual Chicago hog prices from the ten-year standard ratio, corrected seasonally.
For sake of example, determine cost of producing hogs for the Chicago market for the month of April, 1918. Corn values month by month, beginning April, 1917, were as follows: 144.9 cents, 33163.9 cents, 170.7 cents, 200 cents, 197.2 cents, 208.6 cents, 199.2 cents, 201 cents, 173.2 cents, 180.6 cents, 174.5 cents, and 172.3 cents. Weighting these on the basis indicated, we get a composite value of corn of 182.5 cents.
The historical ratio for the month of April is 12.7 bushels of such composite corn. Multiply 182.5 cents by 12.7, and we secure $23.18 as the cost of producing hogs for the Chicago market in April of 1918, under the ten-year ratio method. The actual price was $17.45, or a loss of $5.73 per hundredweight. The chart which is published herewith illustrates graphically results secured in the same manner for every month during the ten-year period beginning 1907.
Ordinarily, Chicago No. 2 corn measures very accurately the changes in corn value on the farm, the corn out of which hogs are actually made. During part of the winter of 1917–1918, Chicago No. 2 corn ceased to be quite such an accurate measure as usual, for the reason that the quality of the crop was so poor that only a small amount of corn graded No. 2, and for the further reason that there were severe transportation difficulties.
Some people have urged not using Chicago No. 2 corn values, but corn values on farms as reported to the United States Department of Agriculture, monthly, by crop reporters. This price is no doubt compiled with considerable accuracy, but is open to objection for the reason that it does not represent a uniform grade. In soft corn years, a bushel of corn as valued by crop reporters on farms is poor stuff. In such years, there is always a wider spread between the farm value of corn and the Chicago No. 2 value than in years when the quality is good. It might do fairly well to take farm values of corn and farm values of hogs if definite grades could be established. If they can not be, it is probably best to take Chicago values of No. 2 corn and heavy hogs as a basis, making allowance occasionally when exceptional conditions arise in the way of artificial prices temporarily created by transportation difficulties, and remembering always that the true point at issue is to apply a ratio between certain grades of actual feed on the one hand and a certain grade of hogs on the other. This is a technical matter which really can not be decided by lawyers or business men, however competent such men may be to run a food administration or a department of agriculture, or by farmers, however competent such men may be to feed hogs. It is a matter which must be handled by men who understand markets and who have had sufficient economic training so that they understand a little something of the making of index numbers, and who have 34had sufficient touch with agricultural conditions so that they understand a little something of the technique of feeding hogs.
Soon after the report of the commission on cost of producing hogs, the Food Administration announced among other things that it would do its best to pay hog producers, for a hundred pounds of hog flesh, the equivalent of thirteen bushels of the corn which went into these hogs, the ratio system to apply to hogs farrowed in the spring of 1918. It was expected that there would be an urgent need for hog products during 1919, and it has generally been regarded that this announcement of the Food Administration was wise. The thirteen-bushel ratio was 13 per cent over the historic ratio, and encouraged the transforming of a larger amount of corn into hogs than usual.
When it came to putting the thirteen-bushel ratio into effect, in the fall and winter of 1918–1919, the Food Administration did all in its power to squirm out of living up to its guarantee. First, the effort was made, in the month of September, 1918, to make it appear that the thirteen-bushel ratio was based on a ratio between farm corn prices and Chicago hog prices, in spite of the fact that the pamphlets originally issued by the Food Administration to farmers of the corn belt in November of 1917 explained the ratio on a basis of Chicago corn prices and Chicago hog prices. By using farm corn prices, the Food Administration secured a figure of about $2.50 per hundredweight lower than if the thirteen-bushel ratio had been applied literally as described in the original pamphlets. The Food Administration, however, claimed that it could not live up to its original guarantee, because the export prices of pork would not justify it. In this respect, it is interesting to note that in August of 1918, just before the Food Administration took up this matter of carrying out its thirteen-bushel guarantee, Great Britain reduced its maximum price on American bacon by about $12 per hundredweight. It is also interesting to note that the British Food Administration was making money on its handling of pork products, altho it was losing money on its wheat. Those American producers who were most familiar with the situation believed that there was a concerted effort by the American and British food administrations to buy the large American hog crop, which had been secured by the thirteen-bushel guarantee, as cheaply as possible, avoiding its guarantee with such chicanery and deceit as an experienced business man knows how to use in case of emergency.
The committee of some fifteen men, supposedly representing the American hog producers, which met with the United States 35Food Administration in this matter, were not well educated along statistical or economic lines, and they went down to defeat in September, 1918, scarcely realizing just what the Food Administration had done to them. Only two members of this committee had served on the original commission, and it was impossible for them to give the other members a full comprehension of what the ratio meant. When the facts became known, widespread indignation among the farmers of the corn belt compelled the Food Administration to abandon the hypocritical pretense of living up to the thirteen-bushel ratio and come out flatly for a $17.50 minimum, which was really a ratio of 10.8 bushels. The Food Administration was able to thus repudiate in part its definite obligation to hog producers, because there were no thoroly organized farmers with leaders trained to think in terms of statistics and economics.
The author does not care to create a prejudice against the Food Administration. It probably did its work as efficiently as any branch of the government during the war. The sole purpose is to point out to agricultural students the extreme disadvantage under which farmers labor in bargaining with other classes of society. It is hoped that as farmers learn to follow the example of keen business men and employ trained experts to look after their interests, and as farm leaders become better trained in statistics, economics and business principles, this disadvantage will disappear.
36
SUPPLY AND DEMAND VERSUS COST OF PRODUCTION
What makes hour-by-hour and day-by-day prices under laissez faire conditions is not cost of production, but that brute force which we call “supply and demand.” In its blind groping, this force necessarily approximates cost of production as an average of any long period of time. But it never specifically recognizes cost of production as a factor which should be considered. It approximates cost of production because it has to, not because it wants to.
An illustration of the strategy of the hog market is a case in point. Imagine a Monday hog market in early March, at which season of the year prices are generally rising. Suppose that instead of the accustomed 40,000 Monday hog run, 60,000 have been received. Suppose that, owing to car shortage or some other reason, eastern shippers are out of the market. There is a larger supply than usual and a smaller demand, and prices decline 15 or 20 cents a hundredweight, perhaps very much more. “Supply and demand,” say the packers and practical economists, with unction. But at that very time every one may know that the potential supply in the country is very small, and the potential demand is very great. At that very time this wider situation may be taken fully into account by the packers in the prices which they are charging for their products to the retailers. The hog market may have broken 15 to 20 cents, but the lard, ham and bacon markets may have held steady or even advanced.
The packers, in the prices which they pay for live hogs and the prices which they charge for hog products, are governed chiefly by strategic considerations. Day by day they change their prices to meet the surface indications of changing supply and demand conditions. They may sometimes exercise such poor strategy that they will be compelled to manufacture hog products at a loss for a time. The prime consideration is to buy as cheaply as possible and to sell as high as possible and yet meet the competition, which is rather more active than many farmers have supposed.
Now it is obvious that a ratio system of hog prices is not compatible with the system employed by the packers, or by any typical business man, for that matter. Big business enjoys a speculative profit which comes with fluctuating prices. But a daily fluctuating price is not consistent with the idea of a just price or a cost-ofproduction 37price. If the packing business were a monopoly under government control, stabilized prices under the ratio system might be paid with some degree of satisfaction, provided we assume that the governmental authorities have a real insight into market conditions and a thoro understanding of the ratio system of price judgment as related to supply and demand. Under the present regime, however, it is difficult to see much prospect of hog prices ever being stabilized, for the reason that under a laissez faire system business profits result from fluctuating prices, those businesses profiting most which are best organized and most long-lived, and are able to take strategic positions over long periods of time.
What would happen if cost of production were to be paid in the hog market day by day, year in and year out? By cost of production is meant the 11.5-bushel ratio, modified seasonally. Packers can think of many objections. For instance, they can conceive of periods of a year or two at a time when the 11.5-bushel ratio would necessitate paying the farmers more for their hogs than they could get for the meat. Equally, they can see how it might be that for periods of a year or two at a time, they would be able to get out of the consumers a price equivalent to considerably more than the 11.5-bushel ratio. Admittedly, these objections are sound under present conditions; supply-and-demand price is the only price adapted to the laissez faire situation.
If farmers as a class are to secure cost of production for their hogs month after month and year after year, they must organize into powerful associations to do business co-operatively. They must control the supply of hogs with an iron hand and an intelligent head. They must be willing to play fair with the consumers and not charge more for their hogs than the ratio of the past sixty years. In fact, it is conceivable that they might be able to sell their hogs at slightly less than the 11.5-bushel ratio of the past sixty years. If the organization was really powerful enough to enforce the cost-of-production ratio over any period of time, the market risk, which has been a very serious factor in the past, would disappear. This risk has been such a factor that it is quite possible that farmers would be willing to produce enough hogs to satisfy the market at an eleven-bushel ratio if the risk no longer existed. The author estimates that as an average of the past sixty years the consuming public has been paying at least 50 cents per hundredweight more than necessary for its hog products. This extra 50 cents has been in the nature of risk insurance.
It is conceivable that both farmer producers and city consumers might organize to carry this risk between them, the city consumer 38co-operative organizations agreeing in advance to take a certain number of pounds of hog products, and the farmer producing organizations agreeing to furnish such a quantity of hog products on the basis of a corn-hog ratio representing cost of production.
39
CATTLE PRICES AND THE RATIO METHOD
A ratio between corn and cattle does not represent cost of production nearly as accurately as a ratio between corn and hogs. However, such a ratio, when worked out and applied over a long period of years, reveals the interesting historical fact that the swings in cattle prices above and below the ratio line are periods of about seven years each way.
A more accurate method is to take into account the fact that fat cattle as produced in the corn belt and marketed at Chicago are commonly made out of feeders which were bought a few months previously, taken to the farm, and finished chiefly on corn, together with a little in the way of pasture, hay, silage and concentrated feeds, such as cottonseed meal and oil meal.
As an average of the ten-year period, 1906–1915, ordinary 1,000-pound feeders on Chicago, in October, cost $51.20. As an average of the ten-year period, these same 1,000-pound feeders, as ordinary, well-finished fat steers weighing 1,300 pounds each, sold the following April for $98.35. During this ten-year period it seemed to take $47.15 to cover the cost of feed, risk, labor, etc., of bringing a 1,000-pound feeder to 1,300-pound fat condition. Ordinarily, it is substantially accurate to measure these things in terms of corn only. During the ten-year period under consideration, the weighted price of corn was 61.5 cents. Dividing $47.15 by 61.5 cents equals 76.7 bushels. As an average of the ten-year period it has required the value of 76.7 bushels of weighted corn to make a 1,000-pound feeder, bought in October, moderately fat for the Chicago market the following April. The corn is weighted on the theory that the steers consume 8 per cent of it the month after they are bought, 15 per cent the second month, 20 per cent the third month, 20 per cent the fourth, 20 per cent the fifth, and 17 per cent the last month. Applying the ten-year ratio to the specific month of April, 1918, we find that a 1,000-pound feeder in October, 1917, cost $84, and the value of 76.7 bushels of composite corn was $139.40, making a total cost of the finished 1,300-pound steer, $223.40. The actual selling price in the month of April, 1918, was $199.55, or a loss of about $23.85 per steer. Applying the same method month by month, we get the chart as herewith published. It expresses profits and losses with a fair degree of accuracy to the ordinary cattleman who buys feeders 40at the central market and feeds them for five to seven months, largely on corn. During the winter of 1917–1918, the chart was not quite so accurate as usual, for the reason that the other expenses did not mount at this time as rapidly as corn. While heavy losses were incurred by cattle feeders, they were not so great as indicated in the chart.
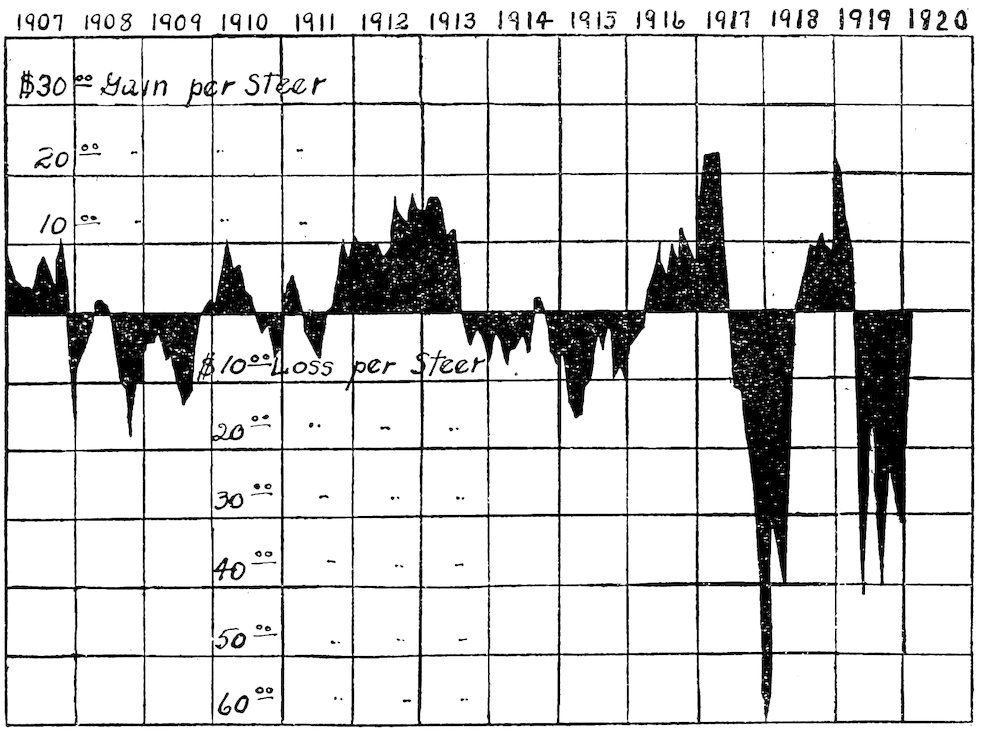
Illustrating the departure of prices of 1,300-pound native steers at Chicago from the ten-year ratio.
The profits and losses of the big cattlemen of the far-western and southwestern states are not to be measured by such a chart. Their chief expenses are labor and the cost of pasture. Weather conditions affect them directly, whereas weather conditions in the corn belt affect cattle profits indirectly, thru the price of corn. During 1917 and 1918, the western cattle men, with the exception possibly of those in certain sections of the southwest, which suffered from unprecedented drouth in 1917, made unusually good profits. As a class, their profits were probably not as large as the profits of the grain-growing farmers of the middle-west, but were far larger than the profits of the cattle feeders of the middle-west.
41
PACKER PRICES AND THE RATIO METHOD
The Chicago packers buy hogs as cheaply as they can and sell the pork as high as they can. Nevertheless, for months at a time they may sell pork products at a loss. Over any long period of time there is a fairly constant ratio between the value of one hundred pounds of live hog flesh and one hundred pounds of lard, ribs or other standard hog products. To simplify matters, and for purposes of illustration, we will consider that standard hog product, dry salt ribs, which makes up about 35 per cent of the live hog.
As an average of the ten years from 1886 to 1895, dry salt ribs (low-grade bacon) sold for the value of 136 pounds of live hog. During the ten-year period from 1896 to 1905, ribs sold for the value of 137 pounds of live hog. During the ten-year period from 1906 to 1915, they sold for the value of 135 pounds of live hog. But while this ratio is quite constant over any long period of time, it varies considerably according to the season of the year. As an average of the ten-year period of 1907–1916, the ratio was 136 pounds in January, 132 pounds in February, 127 pounds in March, 126 pounds in April, 133 pounds in May, 137 pounds in June, 137 pounds in July, 137 pounds in August, 135 pounds in September, 136 pounds in October, 140 pounds in November, and 139 pounds in December. In April of 1918, hogs averaged about $17.45 per hundredweight. Using the standard ratio for the month of April, of 126 pounds of live hog for one hundred pounds of ribs, we would get as the hog price of ribs $21.97. The actual price was about $23.21, or the packers got for the dry salt ribs in the month of April, 1918, about $1.24 more than the customary ratio. The chart tells the story, extending from 1905 to 1919. The black area above the line might be called packers’ profits and the black area below the line packers’ losses on the manufacture of ribs. As a matter of fact, the packers’ profits in the latter part of 1917 and early in 1918 were probably larger than indicated. This method assumes that the packers’ manufacturing charges rise and fall in the same ratio as hog prices rise and fall. In the rough way, over any long period of time, this is approximately true, but it was probably not true in late 1917. Hog prices at that time were over 200 per cent of the ten-year 42period, whereas packers’ manufacturing costs were probably not in excess of 170 per cent of the ten-year period.
It is conceivable that as the packing business becomes even more centralized and further improvements in the use of by-products are discovered, it may be possible for packers to sell short-ribs, as an average of a ten-year period, for a price no more than the cost to them of 133 pounds of hog flesh. Under conditions as they prevail at present, however, the 135-pound ratio is approximately correct.
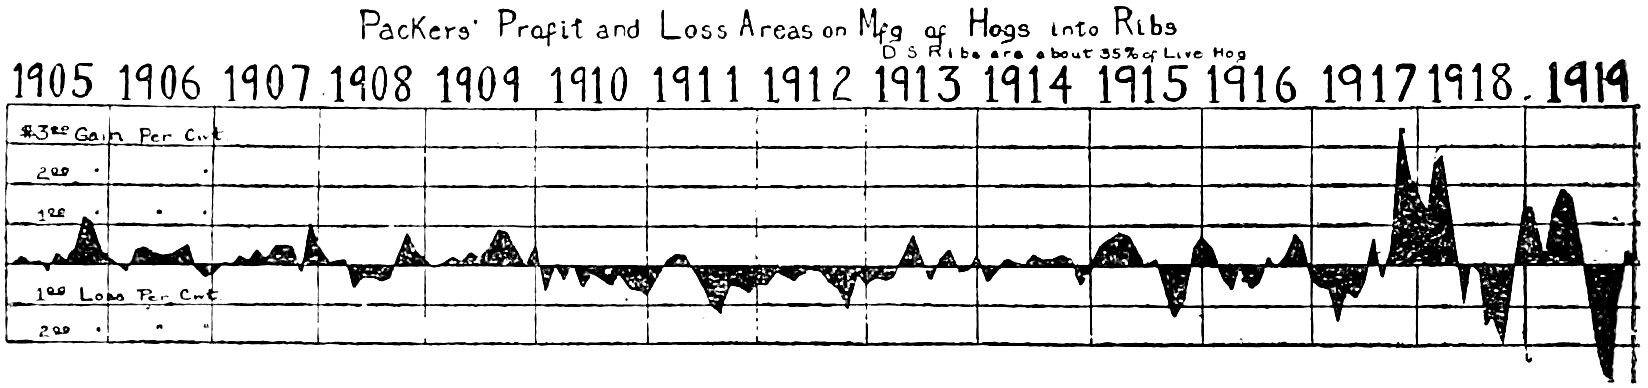
Illustrating when short-rib sides have been above and below their ten-year average ratio to live hog prices.
The ratio method of determining profits and losses in the manufacture of various packers’ products is not put forward as an aid in any method of packing house accounting. It is, however, put forward as a method by which the consumer and the farmer can discover in a rough way when the packers are absorbing more than their customary share.
A similar chart worked out for lard gives much the same results, altho at times the profit and loss of the two products do not always coincide exactly. For instance, in 1914, lard sold for far less than its normal ratio during the entire year, whereas ribs sold for slightly more than their normal ratio. In 1919, lard sold far above its normal ratio and ribs were below. Similar ratios might be worked out for all the various hog meats, and also for cattle and the various cuts of beef. What examination we have made of some of these ratios indicates that the packers, in their buying of live stock and selling of products, regard each product as a law unto itself. If there is a large amount of stored lard on the market, on account of the shutting off of the German demand, lard prices may be reduced, even tho hog prices are such as to warrant lard selling at a dollar or two more per hundredweight. On the other hand, if the Allies at the same time are in the market for ribs, the prices will be advanced, even tho ribs may be made from hogs at a dollar or two less per hundredweight. The problem of the packers is to buy as cheaply as possible and sell as high as possible, in the knowledge that too wide a spread will invite competition. In 43the case of hog products, a loss may be withstood on a rapidly rising market, because the manufacturing loss will be compensated for by the speculative profit. This was illustrated during a considerable part of the year 1917, when most hog products sold at considerably less than their normal ratio, but when the packers actually made splendid profits, owing to the continual advance of prices and speculative gain on products on hand.
In normal times we regard charts based on principles as stated in this chapter as approximately accurate in measuring packers’ profits and losses in the manufacture of given products.
It is conceivable that the normal lard ratios may go lower in the near future. Corn oil, cocoanut oil, cottonseed oil and other tropical vegetable fats are being used as lard substitutes, and as a result lard may sell decidedly below its normal pre-war ratio to hogs. However, in this case the bacon hog will gain in popularity and the supply of lard will be curtailed to a point which will justify a ratio almost as great as existed before the war.
44
MILK PRICE DETERMINATION
Just what price farmers should get for their milk has been a peculiarly vexing question. Before the war, farmers selling milk to city dealers were in an unusually weak bargaining position. When their position became intolerable, they organized into powerful bargaining associations, many of which were said to be illegal under strict interpretation of the law.
One of the earliest formed and most powerful of these producers’ associations has been the Chicago Milk Producers’ Association, numbering 16,000 members and controlling most of the milk that is shipped into Chicago or manufactured in the district immediately around Chicago. During the years immediately preceding the entry of the United States into the great war, this association bargained directly with the Chicago milk dealers as to what prices the farmer members of the association could get for their milk. They held a successful strike in April of 1916, and thereafter the Chicago milk dealers seemed to regard the association with considerable respect. The city press and the city politicians, however, felt that the farmers were too high-handed in their disregard of certain laws, and forthwith began agitation which finally resulted in indictments against the leaders in the Producers’ Association.
In the fall of 1917, the milk producers adopted as their guide in arriving at milk prices what has been called Pearson’s formula. According to this formula, the cost of producing a hundred pounds of milk in the Chicago milk district is equal to the cost of 44 pounds of grain, plus 188 pounds of silage, plus 50 pounds of hay, plus 39 pounds of bedding, plus 2.42 man hours of labor. To the valuation thus secured, certain differentials were to be applied to each month of the year, the widest differential being 120.3 per cent, in December, and the narrowest 70.6 per cent, in June. This formula was devised by Professor F. A. Pearson, of the Dairy Economics Division of the University of Illinois, after several years of actual cost-accounting work in the Chicago milk district. It really represents actual cost of production on a large number of farms in certain specific years. Using Pearson’s formula as a guide, the Chicago milk producers asked the dealers $3.71 per hundredweight for their milk in November, 1917. The dealers refused, and a strike was declared. The Food Administration intervened in an unofficial way and induced the producers to agree to a price of 45$3.22 per hundredweight, pending an investigation by the federal government as to a price which should cover cost of production and a reasonable profit.
The Food Administration appointed as a committee to determine cost of producing milk plus a reasonable profit, six people of essentially city interests and three people of essentially agricultural interests. This committee took testimony during the months of December and January, and in their report took as a guiding principle in determining the cost of producing milk the ratio method. Early in December, the author was asked to present to the commission a profit and loss chart on milk produced in the Chicago district since January, 1907, the profits and losses being based on ratios between milk prices per hundredweight on the one hand, and a composite of corn, oats, bran, cottonseed meal, gluten feed, hay, and labor prices on the other hand. These latter ingredients were weighted roughly as in the Pearson formula, but corn was given greater emphasis. Incidentally, it is interesting to note as corroborative both of the ratio method and the cost-of-production method as employed by Professor Pearson, that the two methods give very similar results. Of course, it is conceivable that if Professor Pearson had made his cost-accounting investigation in a year either of extremely good pasture or extremely poor pasture, the two methods would not agree. But taking as he did fairly average years, the results check very closely.
While the Chicago Milk Commission adopted the principle of the ratio method, it did so with certain modifications. To illustrate the method as adopted by the Chicago Milk Commission, we quote from the report as follows:
“The commission has therefore selected as a base, representing cost of production and a fair profit, the average sale price per one hundred (100) pounds over the years 1908 to 1915, inclusive. The result of course does not represent present value, due to the large advance in cost of feed and labor since that time. The quantity of feed and labor per one hundred (100) pounds of milk, however, is the same in both periods. Considering the eight-year period as a base and distributing feed and labor on a basis of 100 per cent total, the commission developed the following ratio: Nineteen per cent home-grown grains, 19 per cent mill-feeds (wheat, bran, wheat middlings, hominy, cottonseed meal, oil meal, gluten feed, dry salt), 35 per cent hay (including silage valued at the ratio of three tons of silage to one ton of hay), 27 per cent labor.
“It was agreed by the commission that variations in the prices of those four units represent with sufficient accuracy, when applied 46according to the above ratio, the increase or decrease in the cost of production of milk. The only criticism made to this base or this plan was by a minority of the members of the commission, that the price to the producer during the eight-year period referred to was not satisfactory to them.
“From the monthly price reports issued by the Department of Agriculture, the farm prices of home-grown grains and hay are obtainable, and from a reliable trade journal published in Milwaukee the wholesale prices of mill-feeds are obtainable. The average over the eight-year period from these records is as follows: Corn, $1.107 per hundred pounds; mill-feeds, $1.306 per hundred pounds; hay, 55.7 cents per hundred pounds.
“It appears fair to the industry that it is entitled to the same proportionate increase in the price of its product as has occurred in the elements which make up the product. From the records of the Department for November, 1917, the beginning of the period under consideration, the following prices prevailed, obtained from the same sources: Corn, $3.089 per hundred pounds; mill-feeds, $2.3655 per hundred pounds; hay, 78 cents per hundred pounds.
“The commission has considered from the evidence and such information as was obtainable that the price of labor in November represents 50 per cent advance over the average for the eight-year period. Using the proportion of feed and labor and prices over the eight-year period, and comparing with November prices from the same source of information and on the same products, we find the following ratio of increase:
Basic Index. Eight-year period average. November, 1917, price. Pct. increase Nov., 1917, over 8-year period. New Index.
Corn 19 $1.107 $3.089 179 53.01
Mill-feeds 19 1.306 2.3655 81.1 34.41
Hay 35 .557 .780 40 49.00
Labor 27 50 40.50
100 177
“The average price of milk per one hundred (100) pounds for the month of November, from 1908 to 1915, inclusive, was $1.768. Applying the new index ratio of 1.77, the November, 1917, price would be, therefore, $3.13. In the same manner, the price for any month may be determined by taking the average price over the eight-year period for that month and multiplying it by the index 47figure, 1.77. It will be noted that by the use of this method the ratio of the costs of feed and labor between the average of the eight-year period and the November, 1917, period, is used rather than the actual prices of the commodities.
“The average monthly prices of milk per hundred pounds over the eight-year period were as follows: November, $1.768; December, $1.812; January, $1.781; February, $1.737; March, $1.60; April, $1.406; May, $1.15; June, $1.017. Applying this index, 1.77 November price, to these figures: November, $3.13; December, $3.20; January, $3.15; February, $3.07; March, $2.83; April, $2.49; May, $2.04; June, $1.80.”
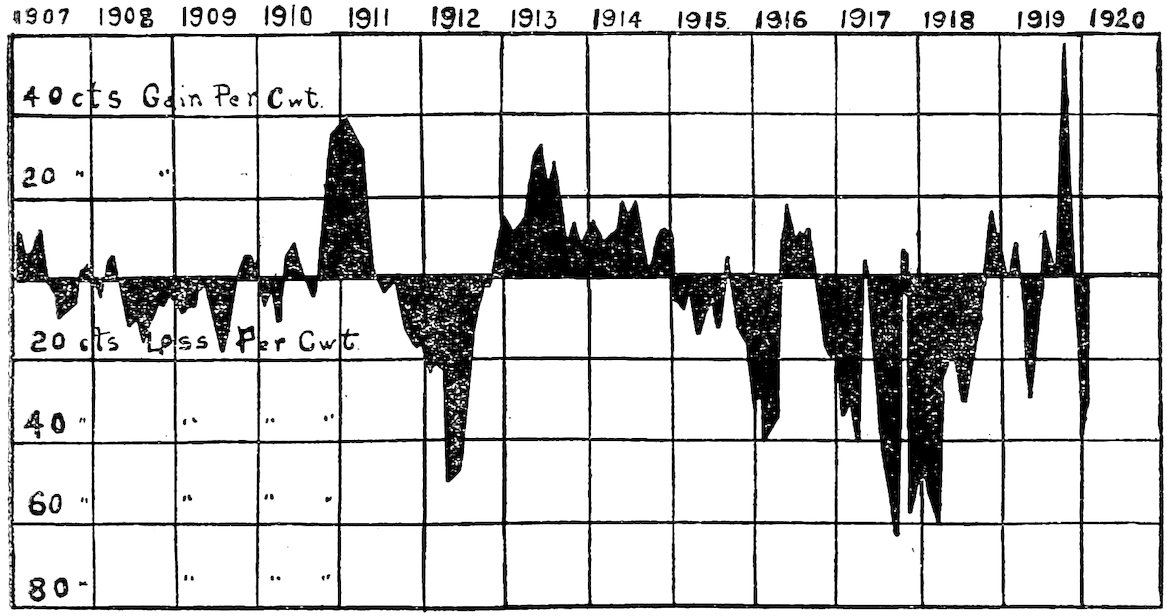
Illustrating when Chicago milk prices have been above and below their ten-year average ratio to feed and labor prices.
This report was signed only by the city members of the commission. The agriculturally-minded members and the Chicago milk producers knew that the prices secured by the ratio method as advocated by the commission were not high enough to cover cost of production. The fault was in the method of application. Hay and labor between them were made to represent, according to the commission, 62 per cent of the total cost of producing milk, which is altogether too high a weighting. This bad weighting was made worse because of the fact that thoroly up-to-date figures on hay and labor were not available, and the figures which were taken were far lower than those existing at the time when the report was actually published. The converting of silage into terms of hay instead of into terms of corn is a matter open to grave question in view of the fact that silage production costs are almost identical with corn production costs, and the alternative market for silage is the corn market and not the hay market. Several other mistakes 48were made which might have been avoided if the method had been applied by a thoroly impartial body well versed in the technique of dairying as well as the weighting of agricultural index numbers. The unjust prices secured by the commission should not be blamed on the ratio method, but on the way in which it was applied. The finest scales are not dependable in the hands of an ignorant or a dishonest man.
We present herewith a historical milk chart indicating profits and losses from January, 1908.
A full description of the derivation of the Pearson formula is to be found in Bulletin No. 216 of the Illinois Experiment Station.
49
COST OF PRODUCING CROPS
There are two methods of determining the cost of producing crops—the cost-accounting method and the ratio method. The common method is the cost-accounting system, as employed by farm management investigators. For example, it has been found that the average farmer in the corn belt puts about twenty hours of man labor and fifty hours of horse labor on the average acre of corn. This divides up roughly into three hours of man labor and twelve hours of horse labor for plowing, three hours of man labor and twelve hours of horse labor for disking and harrowing, three-fourths of an hour of man labor and one and one-half hours of horse labor for planting, six hours of man labor and twelve hours of horse labor for cultivating, six hours of man labor and twelve hours of horse labor for husking, two hours of man labor and five hours of horse labor for manuring and miscellaneous. In addition to the man and horse labor charges are machinery expense, seed, manure or fertilizer, insurance and depreciation on the general overhead charges, and the rent of land. With man labor at 35 cents an hour, horse labor at 18 cents an hour, land rent at $12 an acre, and machinery and miscellaneous expenses at $4 an acre, the total cost of producing an acre of corn in 1919 was about $32. On extra good land, the rent was as high as $18 or $20 an acre, and the cost of an acre was increased accordingly. However, on extra good land the yield was decidedly above the average. The average acre yield in Iowa in 1919 was forty bushels, or the cost of producing a bushel of corn was roughly 80 cents on the farm in the month of December. The 1919 crop was decidedly above the average; with an average crop it would have cost the Iowa farmer right around 90 cents a bushel in such a year as 1919.
The ratio method when applied to corn corroborates the farm management investigational method. The ratio method is based on the supposition that the cost of producing corn varies with the cost of man labor, horse labor and machinery. For the sake of convenience, it is taken that the cost of horse labor varies with the price of corn, oats and hay, and that the price of agricultural machinery varies with that part of Dun’s index known as metals. Roughly, it is figured that of the cost of producing corn in Iowa, 35 per cent is represented by land charge, 20 per cent by man labor, 15 per cent by corn (used either as seed or fed to horses), 10 per cent by hay fed to horses, 5 per cent by oats fed to horses, 5010 per cent by Dun’s metals, and 5 per cent by Dun’s miscellaneous. Dun’s metals are given a lag of two years, and Dun’s miscellaneous of one year, owing to the fact that machinery and the miscellaneous overhead expenses entering into the cost of corn production become felt rather slowly.
Applying the ratio method, we will take as our base the ten-year period from 1897 to 1906. During this period Iowa land averaged about $50 an acre; harvest labor, without board, $2 a day; corn, 29.4 cents a bushel; hay, $5.47 a ton; oats, 23 cents a bushel; Dun’s metals, about $14, and Dun’s miscellaneous, about $15. The average acre of Iowa corn during this ten-year period was worth on a December 1st farm basis $10.
Now, in 1919, Iowa land was worth about $192 an acre, or 384 per cent of the basic ten-year period; man labor, without board, at harvest time was around $5.20 a day, or approximately 260 per cent of this ten-year basic period. In like manner, corn was 410 per cent; oats, 280 per cent; hay, 330 per cent; Dun’s metals, 230 per cent, and Dun’s miscellaneous, 230 per cent. If land is allowed a weighting of 35 per cent; man labor, 20 per cent; corn, 15 per cent; hay, 10 per cent; oats, 5 per cent; Dun’s metals, 10 per cent, and Dun’s miscellaneous, 5 per cent, we arrive at 329 per cent as the cost of producing an acre of corn in 1919, as compared with 100 per cent for the basic ten-year period. In the basic ten-year period, an acre of corn actually sold for $10. In 1919, in order to come as near breaking even as in the basic ten-year period, an acre of corn should sell for $32.90. The ratio method gives almost identically the same results as the farm management method. Both indicate that it cost the average Iowa farmer in 1919 about 80 cents to produce a bushel of corn on a basis of December 1st farm values.[4]
The ratio method may be applied to other crops by using a somewhat different weighting of the production factors. In the case of oats in Iowa, for instance, land may be given a weighting of about 35 per cent; man labor, 15 per cent; corn, 10 per cent; hay, 10 per cent; oats, 15 per cent; Dun’s metals, 10 per cent, and Dun’s miscellaneous, 5 per cent. This would indicate that oats in Iowa in 1919 cost about 324 per cent as much as in the basic ten years. In the basic ten-year period, the average acre of oats in Iowa sold for $8. We may therefore conclude that the 51cost of producing oats in 1919 was 324 per cent of $8, or $25.92. With an average yield of thirty-three bushels per acre, the cost per bushel was about 78 cents on a December 1st farm basis.
Manifestly, the weak point in the ratio method of determining cost of producing crops is the character of the basic period. Did the crops actually sell during the basic ten-year period for cost of production? Manifestly, in some years they sold for less, and in some years they sold for more. As an average of the entire ten-year period, they must have sold for at least cost of production, or farmers would gradually have reduced their acreage of the particular crop under consideration, or else gone out of business entirely. As a matter of fact, in the ten-year period under consideration, 1897–1906, land values were constantly advancing. It would seem, on the whole that this particular ten-year period is a fair one to use, and that as an average of these ten years crops sold for approximately cost of production, no more, no less.
It is always conceivable that over long periods of time there might have occurred changes in supply or demand conditions that would make the basic ten-year period altogether false for the purpose of comparison. For example, in the case of oats, it is conceivable that tractors, trucks and automobiles might so displace horses as to make the city demand for oats decidedly less than during the ten-year period extending from 1897 to 1906. The oats acreage might therefore be considerably decreased, and oats be produced in large quantities only in those sections especially adapted to growing oats. It is conceivable, therefore, that the ratio method may possibly give the cost of oats production at rather too high a figure, a figure impossible of realization, one year with another. In the case of standard crops, however, there is remarkably little change in either supply conditions or demand conditions. Methods of producing corn are pretty well standardized. The market for corn is almost equally stable. It is believed that the ratio method of determining cost of corn production will be approximately accurate for the next fifty years.
52
CONSUMERS’ RATIOS
During the past fifty years, a number of people have set themselves to work to measure the shifting economic tides with index numbers. The more complete of these index numbers really undertake to measure the changing value of the dollar. In July of 1914, for instance, Dun’s index number was $119.71, which meant that it required $119.71 to buy a certain given amount of wheat, corn, oats, pork, beef, butter, eggs, wool, hides, pig iron, lumber, petroleum, etc. On September 1, 1919, it required $238.34 to buy these same goods. The dollar of July of 1914 had become worth about 50 cents in September of 1919, in its ability to buy wholesale products. The consumer, in his buying, has certain choices. The man who thinks pork is too high in price can shift to beef or mutton; or he can leave meat altogether out of his ration and secure the needed nutrients in dairy or poultry products.