Front matter
Reading edition
BY
GEORGE H. LOWERY, JR.
University of Kansas Publications Museum of Natural History
Volume 3, No. 2, pp. 361-472, 47 figures in text
June 29, 1951
University of Kansas
LAWRENCE
1951
UNIVERSITY OF KANSAS PUBLICATIONS, MUSEUM OF NATURAL HISTORY Editors: E. Raymond Hall, Chairman; A. Byron Leonard, Edward H. Taylor, Robert W. Wilson UNIVERSITY OF KANSAS Lawrence, Kansas PRINTED BY FERD VOILAND, JR., STATE PRINTER TOPEKA, KANSAS 1951 23-1020

A Quantitative Study of the Nocturnal Migration of Birds
By
GEORGE H. LOWERY, JR.
CONTENTS
Page
Introduction 365
Acknowledgments 367
Part i. Flight Densities and Their Determination 370
Lunar Observations of Birds and the Flight Density Concept 370
Observational Procedure and the Processing of Data 390
Part ii. The Nature of Nocturnal Migration 408
Horizontal Distribution of Birds on Narrow Fronts 409
Density as a Function of the Hour of the Night 413
Migration in Relation to Topography 424
Geographical Factors and the Continental Density Pattern 432
Migration and Meteorological Conditions 453
Conclusions 469
Literature Cited 470
LIST OF FIGURES
Figure page
1 The field of observation as it appears to the observer 374
2 Determination of diameter of cone at any point 375
3 Temporal change in size of the field of observation 376
4 Migration at Ottumwa, Iowa 377
5 Geographic variation in size of cone of observation 378
6 The problem of sampling migrating birds 380
7 The sampling effect of a square 381
8 Rectangular samples of square areas 382
9 The effect of vertical components in bird flight 383
10 The interceptory potential of slanting lines 384
11 Theoretical possibilities of vertical distribution 388
12 Facsimile of form used to record data in the field 391
13 The identification of co-ordinates 392
14 The apparent pathways of birds seen in one hour 393
15 Standard form for plotting the apparent paths of flight 395
16 Standard sectors for designating flight trends 398
17 The meaning of symbols used in the direction formula 399
18 Form used to compute zenith distance and azimuth of the moon 400
19 Plotting sector boundaries on diagrammatic plots 402
20 Form to compute sector densities 403
21 Determination of the angle α 404
22 Facsimile of form summarizing sector densities 405
23 Determination of net trend density 406
24 Nightly station density curve at Progreso, Yucatán 407
25 Positions of the cone of observation at Tampico, Tamps 411
26 Average hourly station densities in spring of 1948 414
27 Hourly station densities plotted as a percentage of peak 415
28 Incidence of maximum peak at the various hours of the night in 1948 416
29 Various types of density-time curves 418
30 Density-time curves on various nights at Baton Rouge 422
31 Directional components in the flight at Tampico, Tamps 428
32 Hourly station density curve at Tampico, Tamps 429
33 The nightly net trend of migrations at three stations in 1948 431
34 Stations at which telescopic observations were made in 1948 437
35 Positions of the cone of observation at Progreso, Yucatán 443
36 Hourly station density curve at Progreso, Yucatán 444
37 Sector density representation on two nights at Rosedale, Miss. 451
38 Over-all sector vectors at major stations in spring of 1948 455
39 Over-all net trend of flight directions shown in Figure 38 456
40 Comparison of flight trends and surface weather conditions on April 22-23, 1948 460
41 Winds aloft at 10:00 P. M. on April 22 (CST) 461
42 Comparison of flight trends and surface weather conditions on April 23-24, 1948 462
43 Winds aloft at 10:00 P. M. on April 23 (CST) 463
44 Comparison of flight trends and surface weather conditions on April 24-25, 1948 464
45 Winds aloft at 10:00 P. M. on April 24 (CST) 465
46 Comparison of flight trends and surface weather conditions on May 21-22, 1948 466
47 Winds aloft at 10:00 P. M. on May 21 (CST) 467
INTRODUCTION
The nocturnal migration of birds is a phenomenon that long has intrigued zoologists the world over. Yet, despite this universal interest, most of the fundamental aspects of the problem remain shrouded in uncertainty and conjecture.
Bird migration for the most part, whether it be by day or by night, is an unseen movement. That night migrations occur at all is a conclusion derived from evidence that is more often circumstantial than it is direct. During one day in the field we may discover hundreds of transients, whereas, on the succeeding day, in the same situation, we may find few or none of the same species present. On cloudy nights we hear the call notes of birds, presumably passing overhead in the seasonal direction of migration. And on stormy nights birds strike lighthouses, towers, and other tall obstructions. Facts such as these are indisputable evidences that migration is taking place, but they provide little basis for evaluating the flights in terms of magnitude or direction.
Many of the resulting uncertainties surrounding the nocturnal migration of birds have a quantitative aspect; their resolution hinges on how many birds do one thing and how many do another. If we knew, for instance, how many birds are usually flying between 2 and 3 A. M. and how this number compares with other one-hour intervals in the night, we would be in a position to judge to what extent night flight is sustained from dusk to dawn. If we could measure the number of birds passing selected points of observation, we could find out whether such migration in general proceeds more or less uniformly on a broad front or whether it follows certain favored channels or flyways. This in turn might give us a clearer insight into the nature of the orienting mechanism and the extent to which it depends on visual clues. And, if we had some valid way of estimating the number of birds on the wing under varying weather conditions, we might be able to understand better the nature and development of migration waves so familiar to field ornithologists. These are just random examples suggesting some of the results that may be achieved in a broad field of inquiry that is still virtually untouched—the quantitative study of migratory flights.
This paper is a venture into that field. It seeks to evaluate on a more factual basis the traditional ideas regarding these and similar problems, that have been developed largely from circumstantial criteria. It is primarily, therefore, a study of comparative quantities or volumes of migration—or what may be conveniently called flight densities, if this term be understood to mean simply the number of birds passing through a given space in a given interval of time.
In the present study, the basic data permitting the numerical expression of such migration rates from many localities under many different sets of circumstances were obtained by a simple method. When a small telescope, mounted on a tripod, is focused on the moon, the birds that pass before the moon's disc may be seen and counted, and their apparent pathways recorded in terms of coördinates. In bare outline, this approach to the problem is by no means new. Ornithologists and astronomers alike have recorded the numbers of birds seen against the moon in stated periods of time (Scott, 1881a and 1881b; Chapman, 1888; Libby, 1889; West, 1896; Very, 1897; Winkenwerder, 1902a and 1902b; Stebbins, 1906; Carpenter, 1906). Unfortunately, as interesting as these observations are, they furnish almost no basis for important generalizations. Most of them lack entirely the standardization of method and the continuity that would make meaningful comparisons possible. Of all these men, Winkenwerder appears to have been the only one to follow up an initial one or two nights of observation with anything approaching an organized program, capable of leading to broad conclusions. And even he was content merely to reproduce most of his original data without correlation or comment and without making clear whether he fully grasped the technical difficulties that must be overcome in order to estimate the important flight direction factor accurately.
The present study was begun in 1945, and early results obtained were used briefly in a paper dealing with the trans-Gulf migration of birds (Lowery, 1946). Since that time the volume of field data, as well as the methods by which they can be analyzed, has been greatly expanded. In the spring of 1948, through the cooperation and collaboration of a large number of ornithologists and astronomers, the work was placed on a continent-wide basis. At more than thirty stations (Figure 34, page 437) on the North American continent, from Yucatán to Ontario, and from California to South Carolina, observers trained telescopes simultaneously on the moon and counted the birds they saw passing before its disc.
Most of the stations were in operation for several nights in the full moon periods of March, April, and May, keeping the moon under constant watch from twilight to dawn when conditions permitted. They have provided counts representing more than one thousand hours of observation, at many places in an area of more than a million square miles. But, as impressive as the figures on the record sheets are, they, like the published observations referred to above, have dubious meaning as they stand. Were we to compare them directly, station for station, or hour for hour, we would be almost certain to fall into serious errors. The reasons for this are not simple, and the measures that must be taken to obtain true comparisons are even less so. When I first presented this problem to my colleague, Professor William A. Rense, of the Department of Physics and Astronomy at Louisiana State University, I was told that mathematical means exist for reducing the data and for ascertaining the desired facts. Rense's scholarly insight into the mathematics of the problem resulted in his derivation of formulae that have enabled me to analyze on a comparable basis data obtained from different stations on the same night, and from the same station at different hours and on different nights. Astronomical and technical aspects of the problem are covered by Rense in his paper (1946), but the underlying principles are discussed at somewhat greater length in this paper.
Part I of the present paper, dealing with the means by which the data were obtained and processed, will explore the general nature of the problem and show by specific example how a set of observations is prepared for analysis. Part II will deal with the results obtained and their interpretation.
ACKNOWLEDGMENTS
In the pursuit of this research I have received a tremendous amount of help from my colleagues, students, and other friends. In the first place, in order to obtain much of the data on which the study was based, it was necessary to enlist the aid of many persons in various parts of the country and to draw heavily on their time and patience to get all-night telescopic counts of migrating birds. Secondly, the processing of the primary data and its subsequent analysis demanded that I delve into the fields of astronomy and mathematics. Here, from the outset, I have enjoyed the constant and untiring help of Professor W. A. Rense of the Department of Physics and Astronomy at Louisiana State University. Without his collaboration, I would not have been able to do this work, for he not only supplied formulae whereby I was able to make desired computations, but time and again he maneuvered me through my difficulties in the mathematical procedures. Moreover, Professor Rense has manifested a great interest in the ornithological aspect of the problem, and his trenchant advice has been of inestimable value to me. No less am I indebted to my associate, Robert J. Newman, with whom I have spent untold hours discussing the various aspects of the problem. Indeed, most of the concepts that have evolved in the course of this study have grown out of discussions over a four-year period with both Rense and Newman. Whatever merit this work may have may be attributable in no small part to the help these two men have given me. In the preparation of many of the illustrations, I am further obligated to Newman for his excellent creative ideas as well as draftsmanship, and to Miss Helen Behrnes and A. Lowell Wood for their assistance.
The mathematical computations required in this study have been laborious and time-consuming. It is estimated that more than two thousand man-hours have gone into this phase of the work alone. Whereas I have necessarily done most of this work, I have received a tremendous amount of help from A. Lowell Wood. Further assistance in this regard came from Herman Fox, Donald Norwood, and Lewis Kelly.
The recording of the original field data in the spring of 1948 from the thirty-odd stations in North America involved the participation of more than 200 ornithologists and astronomers. This collaboration attests to the splendid cooperative spirit that exists among scientists. Many of these persons stayed at the telescope, either as observer or as recorder, hours on end in order to get sets of data extending through a whole night.
The following were responsible for much of the field data herein used: J. R. Andrews, S. A. Arny, M. Dale Arvey, H. V. Autrey, Charles C. Ayres, Mr. and Mrs. Roy Bailey, Irwin L. Baird, Maurice F. Baker, Rollin H. Baker, Bedortha and Edna Baldwin, Mrs. A. Marguerite Baumgartner, T. A. Becket, Paul Bellington, Donald Bird, Carl Black, Jr., Lea Black, Lytle Blankenship, Mr. and Mrs. J. Stewart Boswell, Bruce Boudreaux, Frank Bray, Mr. and Mrs. Leonard Brecher, Homer Brewer, Mrs. Harvey Broome, Heyward Brown, Floyd Browning, Cyril Broussard, Paul Buress, Ralph M. Burress, Robert Cain, Don Carlos, Mrs. Reba Campbell, Mr. and Mrs. E. Burnham Chamberlain, Laura Chaney, Van B. Chaney, Jr., Edward Clebsch, Mr. and Mrs. Ben B. Coffey, William Cook, Dr. Jack Craven, Hugh C. and William Davis, Katherine Davis, Richard Davis, Richard DeArment, Robert E. Delphia, J. C. Dickinson, Mr. and Mrs. Otto Dietrich, John Dietrich, Clara Dixon, Nina Driven, John J. Duffy, Mr. and Mrs. R. J. Dunbar, Betty Dupre, Bernard E. Eble, Jr., Robert G. Eble, Dr. and Mrs. William H. Elder, C. C. Emory, Davis Emory, Alice H. Farnsworth, James Fielding, William R. Fish, Mr. and Mrs. Myron Ford, W. G. Fuller, Louis Gainey, Dr. Mary E. Gaulden, Mr. and Mrs. John J. Giudice, Lt. L. E. Goodnight, Earl R. Greene, Max Grilkey, W. W. H. Gunn, Noel Maxwell Hall, Jr., A. J. Hanna, Paul Hansen, Harold W. Harry, Joseph Healy, Dorothy Helmer, Mr. and Mrs. John H. Helmer, Philip E. Hoberecht, William D. Hogan, Dr. and Mrs. Joseph C. Howell, E. J. Huggins, Mrs. Walter Huxford, Hugh Iltis, W. S. Jennings, William M. Johnson, William Kasler, Luther F. Keeton, Lawrence C. Kent, W. H. Kiel, L. P. Kindler, Mr. and Mrs. Joseph E. King, Harriet Kirby, E. J. Koestner, Roy Komarek, Ann Knight, Mr. and Mrs. N. B. Langworthy, Mr. and Mrs. C. F. Lard, Prentiss D. Lewis, Ernest Liner, Dr. and Mrs. R. W. Lockwood, Dr. Harvey B. Lovell, William J. Lueck, Don Luethy, James Major, Mr. and Mrs. Russell L. Mannette, Mrs. John B. Mannix, Donald Mary, Dale E. McCollum, Stewart McConnell, Mr. and Mrs. M. L. McCroe, Robert L. McDaniel, Mr. and Mrs. Frank McGill, Thomas Merimer, Mr. and Mrs. I. S. H. Metcalf, Ann Michener, John Michener, T. H. Milby, D. S. Miller, Burt Monroe, Jr., Burt Monroe, Sr., Mrs. R. A. Monroe, Gordon Montague, Duryea Morton, James Mosimonn, Don L. Moyle, Grant Murphy, John T. Murphy, Mrs. H. F. Murphy, Mrs. Hill Myers, Mr. and Mrs. Robert J. Newman, William Nichols, R. A. Norris, Floyd Oaks, Eugene P. Odum, Mrs. E. E. Overton, Lennie E. Pate, Kenneth Patterson, Ralph Paxton, Louis Peiper, Marie Peiper, Mr. and Mrs. Harold S. Peters, Mary Peters, Mr. and Mrs. D. W. Pfitzer, Betty Plice, Max Plice, Lestar Porter, D. R. Power, Kenneth Price, George Rabb, Marge Reese, Wayne L. Reeve, C. L. Riecke, R. D. Ritchie, V. E. Robinson, Beverly J. Rose, Mary Jane Runyon, Roger Rusk, Bernd Safinsley, Mr. and Mrs. Glen C. Sanderson, Lewis L. Sandidge, John Sather, J. Benton Schaub, Evelyn Schneider, Henry W. Setzer, Mr. and Mrs. Walter Shackleton, Mr. and Mrs. Francis P. Shannon, Mr. and Mrs. Charles Shaw, Paul H. Shepard, Jr., Alan C. Sheppard, Mabel Slack, Alice Smith, R. Demett Smith, Jr., Nat Smith, Major and Mrs. Charles H. Snyder, Albert Springs, Dr. and Mrs. Fred W. Stamm, J. S. Steiner, Mrs. Paul Stephenson, Herbert Stern, Jr., Herbert Stoddard, Mr. and Mrs. F. W. Stomm, Charles Strull, Harold P. Strull, Mrs. Fan B. Tabler, Dr. and Mrs. James T. Tanner, S. M. H. Tate, David Taylor, Hall Tennin, Scott Terry, Mr. and Mrs. S. Charles Thacher, Olive Thomas, G. A. Thompson, Jr., Dr. and Mrs. S. R. Tipton, Robert Tucker, Tom Uzzel, Mr. and Mrs. M. G. Vaiden, Richard Vaught, Edward Violante, Brother I. Vincent, Marilyn L. Walker, Mr. and Mrs. Willis Weaver, Mr. and Mrs. W. L. Webb, Margaret M. L. Wehking, W. A. Welshans, Jr., Mrs. J. F. Wernicke, Francis M. Weston, Miss G. W. Weston, Dr. James W. White, John A. White, A. F. Wicke, Jr., Oren Williams, J. L. Wilson III, W. B. Wilson, Dr. and Mrs. Leonard Wing, Sherry Woo, Rodney Wuthnow, Grace Wyatt, Mr. and Mrs. Malcom Young, Mr. and Mrs. A. J. Zimmerman. To the scores of other people who assisted in making these observations I extend my hearty thanks.
Drs. E. R. Hall, Edward H. Taylor, and H. B. Hungerford of the University of Kansas have read the manuscript and have made valuable suggestions, as have also Dr. W. H. Gates of Louisiana State University and Dr. Donald S. Farner of the State College of Washington. Dr. Farner has also been of great help, together with Drs. Ernst Mayr, J. Van Tyne, and Ernst Schüz, in suggesting source material bearing on the subject in foreign literature. Dr. N. Wyaman Storer, of the University of Kansas, pointed out a short-cut in the method for determining the altitude and azimuth of the moon, which resulted in much time being saved. For supplying climatological data and for guidance in the interpretation thereof, I am grateful to Dr. Richard Joel Russell, Louisiana State University; Commander F. W. Reichelderfer, Chief of the U. S. Weather Bureau, Washington, D. C.; Mr. Merrill Bernard, Chief of the Climatological and Hydrologic Services; and Mr. Ralph Sanders, U. S. Weather Bureau at New Orleans, Louisiana.
Acknowledgment is made to Bausch and Lomb Optical Company for the loan of six telescopes for use in this project. Messrs. G. V. Cutler and George Duff of Smith and Johnson Steamship Company, operators of the Yucatan Line, are to be thanked for granting me free passage on the "S. S. Bertha Brøvig" to Progreso, Yucatán, where I made observations in 1945 and 1948. I am also indebted to the Louisiana State University Committee on Faulty Research for a grant-in-aid.
PART I. FLIGHT DENSITIES AND THEIR DETERMINATION
A. Lunar Observations of Birds and the Flight Density Concept
The subject matter of this paper is wholly ornithological. It is written for the zoologist interested in the activities of birds. But its bases, the principles that make it possible, lie in other fields, including such rather advanced branches of mathematics as analytical geometry, spherical geometry, and differential calculus. No exhaustive exposition of the problem is practicable, that does not take for granted some previous knowledge of these disciplines on the part of all readers.
There are, however, several levels of understanding. It is possible to appreciate what is being done without knowing how to do it; and it is possible to learn how to carry out the successive steps of a procedure without entirely comprehending why. Some familiarity with the concepts underlying the method is essential to a full understanding of the results achieved, and details of procedure must be made generally available if the full possibilities of the telescopic approach are to be realized. Without going into proof of underlying propositions or actual derivation of formulae, I shall accordingly present a discussion of the general nature of the problem, conveyed as much as possible in terms of physical visualization. The development begins with the impressions of the student when he first attempts to investigate the movements of birds by means of the moon.
What the Observer Sees
Watched through a 20-power telescope on a cloudless night, the full moon shines like a giant plaster hemisphere caught in the full glare of a floodlight. Inequalities of surface, the rims of its craters, the tips of its peaks, gleam with an almost incandescent whiteness; and even the darker areas, the so-called lunar seas, pale to a clear, glowing gray.
Against this brilliant background, most birds passing in focus appear as coal-black miniatures, only 1/10 to 1/30 the apparent diameter of the moon. Small as these silhouettes are, details of form are often beautifully defined—the proportions of the body, the shape of the tail, the beat of the wings. Even when the images are so far away that they are pin-pointed as mere flecks of black against the illuminated area, the normal eye can follow their progress easily. In most cases the birds are invisible until the moment they "enter," or pass opposite, the rim of the moon and vanish the instant they reach the other side. The interval between is likely to be inestimably brief. Some birds seem fairly to flash by; others, to drift; yet seldom can their passing be counted in seconds, or even in measureable fractions of seconds. During these short glimpses, the flight paths tend to lie along straight lines, though occasionally a bird may be seen to undulate or even to veer off course.
Now and again, in contrast to this typical picture, more eerie effects may be noted. Some of them are quite startling—a minute, inanimate-looking object drifting passively by like a corpuscle seen in the field of a microscope; a gigantic wing brushing across half the moon; a ghost-like suggestion of a bird so transparent it seems scarcely more than a product of the imagination; a bird that pauses in mid-flight to hang suspended in the sky; another that beats its way ineffectually forward while it moves steadily to the side; and flight paths that sweep across the vision in astonishingly geometric curves. All of these things have an explanation. The "corpuscle" is possibly a physical entity of some sort floating in the fluid of the observer's eye and projected into visibility against the whiteness of the moon. The winged transparency may be an insect unconsciously picked up by the unemployed eye and transferred by the camera lucida principle to the field of the telescope. It may be a bird flying very close, so drastically out of focus that the observer sees right through it, as he would through a pencil held against his nose. The same cause, operating less effectively, gives a characteristic gray appearance with hazy edges to silhouettes passing just beneath the limits of sharp focus. Focal distortions doubtless also account for the precise curvature of some flight paths, for this peculiarity is seldom associated with distinct images. Suspended flight and contradictory directions of drift may sometimes be attributable to head winds or cross winds but more often are simply illusions growing out of a two-dimensional impression of a three-dimensional reality.
Somewhat more commonplace are the changes that accompany clouds. The moon can be seen through a light haze and at times remains so clearly visible that the overcast appears to be behind, instead of in front of, it. Under these circumstances, birds can still be readily discerned. Light reflected from the clouds may cause the silhouettes to fade somewhat, but they retain sufficient definition to distinguish them from out-of-focus images. On occasion, when white cloud banks lie at a favorable level, they themselves provide a backdrop against which birds can be followed all the way across the field of the telescope, whether or not they directly traverse the main area of illumination.
Types of Data Obtained
The nature of the observations just described imposes certain limitations on the studies that can be made by means of the moon. The speed of the birds, for instance, is utterly beyond computation in any manner yet devised. Not only is the interval of visibility extremely short, but the rapidity with which the birds go by depends less on their real rate of motion than on their proximity to the observer. The identification of species taking part in the migration might appear to offer more promise, especially since some of the early students of the problem frequently attempted it, but there are so many deceptive elements to contend with that the results cannot be relied upon in any significant number of cases. Shorn of their bills by the diminution of image, foreshortened into unfamiliar shape by varying angles of perspective, and glimpsed for an instant only, large species at distant heights may closely resemble small species a few hundred feet away. A sandpiper may appear as large as a duck; or a hawk, as small as a sparrow. A goatsucker may be confused with a swallow, and a swallow may pass as a tern. Bats, however, can be consistently recognized, if clearly seen, by their tailless appearance and the forward tilt of their wings, as well as by their erratic flight. And separations of nocturnal migrants into broad categories, such as seabirds and passerine birds, are often both useful and feasible.
It would be a wonderful convenience to be able to clock the speed of night-flying birds accurately and to classify them specifically, but neither of these things is indispensable to the general study of nocturnal migration, nor as important as the three kinds of basic data that are provided by telescopes directed at the moon. These concern:—(1) the direction in which the birds are traveling; (2) their altitude above the earth; (3) the number per unit of space passing the observation station.
Unfortunately none of these things can be perceived directly, except in a very haphazard manner. Direction is seen by the observer in terms of the slant of a bird's pathway across the face of the moon, and may be so recorded. But the meaning of every such slant in terms of its corresponding compass direction on the plane of the earth constantly changes with the position of the moon. Altitude is only vaguely revealed through a single telescope by the size and definition of images whose identity and consequent real dimensions are subject to serious misinterpretation, for reasons already explained. The number of birds per unit of space, seemingly the easiest of all the features of migration to ascertain, is actually the most difficult, requiring a prior knowledge of both direction and altitude. To understand why this is so, it will be necessary to consider carefully the true nature of the field of observation.
The Changing Field of Observation
Most of the observations used in this study were made in the week centering on the time of the full moon. During this period the lunar disc progresses from nearly round to round and back again with little change in essential aspect or apparent size. To the man behind the telescope, the passage of birds looks like a performance in two dimensions taking place in this area of seemingly constant diameter—not unlike the movement of insects scooting over a circle of paper on the ground. Actually, as an instant's reflection serves to show, the two situations are not at all the same. The insects are all moving in one plane. The birds only appear to do so. They may be flying at elevations of 500, 1000, or 2000 feet; and, though they give the illusion of crossing the same illuminated area, the actual breadth of the visible space is much greater at the higher, than at the lower, level. For this reason, other things being equal, birds nearby cross the moon much more swiftly than distant ones. The field of observation is not an area in the sky but a volume in space, bounded by the diverging field lines of the observer's vision. Specifically, it is an inverted cone with its base at the moon and its vertex at the telescope.
Since the distance from the moon to the earth does not vary a great deal, the full dimensions of the Great Cone determined by the diameter of the moon and a point on the earth remain at all times fairly constant. Just what they are does not concern us here, except as regards the angle of the apex (roughly ½°), because obviously the effective field of observation is limited to that portion of the Great Cone below the maximum ceiling at which birds fly, a much smaller cone, which I shall refer to as the Cone of Observation (Figure 1).
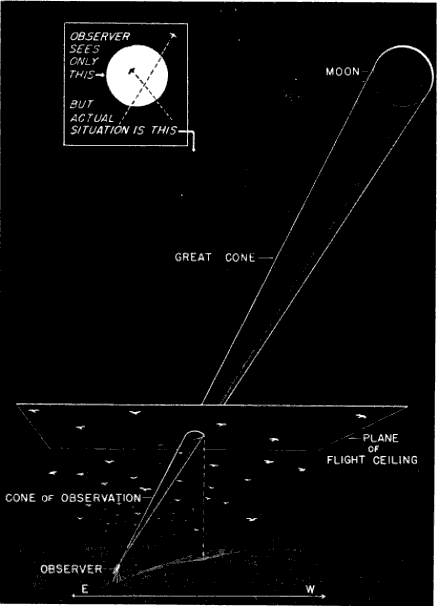
Fig. 1. The field of observation, showing its two-dimensional aspect as it appears to the observer and its three-dimensional actuality. The breadth of the cone is greatly exaggerated.
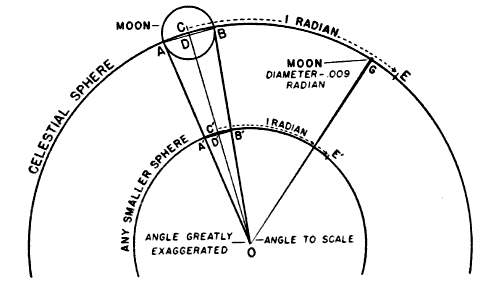
Fig. 2. Method for determining the diameter of the cone at any point. The angular diameter of the moon may be expressed in radians, or, in other words, in terms of lengths of arc equivalent to the radius of a circle. In the diagram, the arc between C and E, being equivalent to the radius CO, represents a radian. If we allow the arc between A and B to be the diameter of the moon, it is by astronomical calculation about .009 radian, or .009 CO. This ratio will hold for any smaller circle inscribed about the center O; that is, the arc between A´B´ equals .009 C´O. Thus the width of the cone of observation at any point, expressed in degrees of arc, is .009 of the axis of the cone up to that point. The cone is so slender that the arc between A and B is essentially equal to the chord AB. Exactly the same consideration holds true for the smaller circle where the chord A´B´ represents part of the flight ceiling.
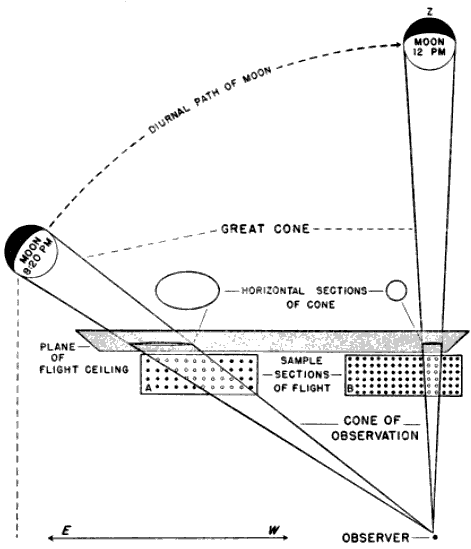
Fig. 3. Temporal change in the effective size of the field of observation. The sample sections, A and B, represent the theoretical densities of flight at 8:20 and 12:00 P. M., respectively. Though twice as many birds are assumed to be in the air at midnight when the moon is on its zenith (Z) as there were at the earlier hour, only half as many are visible because of the decrease in size of the cone of observation.
The problem of expressing the number of passing birds in terms of a definite quantity of space is fundamentally one of finding out the critical dimensions of this smaller cone. The diameter at any distance from the observer may be determined with enough accuracy for our purposes simply by multiplying the distance by .009, a convenient approximation of the diameter of the moon, expressed in radians (see Figure 2). One hundred feet away, it is approximately 11 inches; 1000 feet away, nine feet; at one mile, 48 feet; at two miles, 95 feet. Estimating the effective length of the field of observation presents more formidable difficulties, aggravated by the fact that the lunar base of the Great Cone does not remain stationary. The moon rises in the general direction of east and sets somewhere in the west, the exact points where it appears and disappears on the horizon varying somewhat throughout the year. As it drifts across the sky it carries the cone of observation with it like the slim beam of an immense searchlight slowly probing space. This situation is ideal for the purpose of obtaining a random sample of the number of birds flying out in the darkness, yet it involves great complications; for the size of the sample is never at two consecutive instants the same. The nearer the ever-moving great cone of the moon moves toward a vertical position, the nearer its intersection with the flight ceiling approaches the observer, shortening, therefore, the cone of observation (Figure 3). The effect on the number of birds seen is profound. In extreme instances it may completely reverse the meaning of counts. Under the conditions visualized in Figure 3, the field of observation at midnight is only one-fourth as large as the field of observation earlier in the evening. Thus the twenty-four birds seen from 7 to 8 P. M., represent not twice as many birds actually flying per unit of space as the twelve observed from 11:30 to 12:30 A. M., but only half the amount. Figure 4, based on observations at Ottumwa, Iowa, on the night of May 22-23, shows a similar effect graphically. Curve A represents the actual numbers of birds per hour seen; Curve B shows the same figures expressed as flight densities, that is, corrected to take into account the changing size of the field of observation. It will be noted that the trends are almost exactly opposite. While A descends, B rises, and vice-versa. In this case, inferences drawn from the unprocessed data lead to a complete misinterpretation of the real situation.
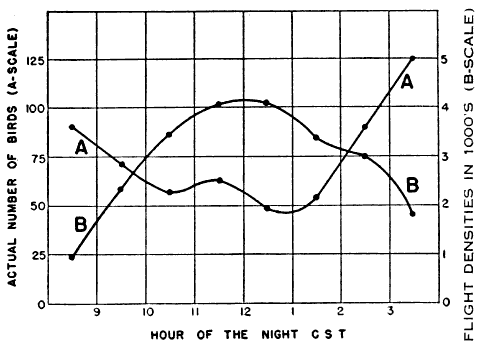
Fig. 4. Migration at Ottumwa, Iowa, on the night of May 22-23, 1948. Curve A is a graphic representation of the actual numbers of birds seen hourly through the telescope. Curve B represents the same figures corrected for the variation in the size of the cone of observation. The dissimilarity in the two curves illustrates the deceptive nature of untreated telescopic counts.
Nor does the moon suit our convenience by behaving night after night in the same way. On one date we may find it high in the sky between 9 and 10 P. M.; on another date, during the same interval of time, it may be near the horizon. Consequently, the size of the cone is different in each case, and the direct comparison of flights in the same hour on different dates is no more dependable than the misleading comparisons discussed in the preceding paragraph.
The changes in the size of the cone have been illustrated in Figure 3 as though the moon were traveling in a plane vertical to the earth's surface, as though it reached a point directly over the observer's head. In practice this least complicated condition seldom obtains in the regions concerned in this study. In most of the northern hemisphere, the path of the moon lies south of the observer so that the cone is tilted away from the vertical plane erected on the parallel of latitude where the observer is standing. In other words it never reaches the zenith, a point directly overhead. The farther north we go, the lower the moon drops toward the horizon and the more, therefore, the cone of observation leans away from us. Hence, at the same moment, stationed on the same meridian, two observers, one in the north and one in the south, will be looking into different effective volumes of space (Figure 5).
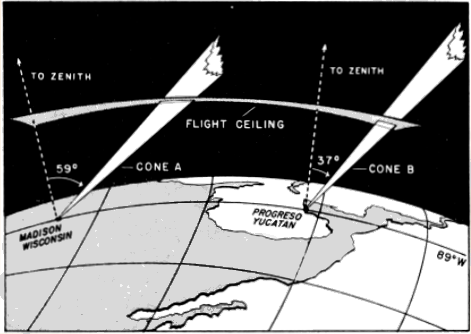
Fig. 5. Geographical variation in the size of the cone of observation. The cones A and B represent the effective fields of observation at two stations situated over 1,200 miles apart. The portions of the great cones included here appear nearly parallel, but if extended far enough would be found to have a common base on the moon. Because of the continental scale of the drawing, the flight ceiling appears as a curved surface, equidistant above each station. The lines to the zenith appear to diverge, but they are both perpendicular to the earth. Although the cones are shown at the same instant in time, and have their origin on the same meridian, the dimensions of B are less than one-half as great as those of A, thus materially decreasing the opportunity to see birds at the former station. This effect results from the different slants at which the zenith distances cause the cones to intersect the flight ceiling. The diagram illustrates the principle that northern stations, on the average, have a better chance to see birds passing in their vicinity than do southern stations
As a further result of its inclination, the cone of observation, seldom affords an equal opportunity of recording birds that are flying in two different directions. This may be most easily understood by considering what happens on a single flight level. The plane parallel to the earth representing any such flight level intersects the slanting cone, not in a circle, but in an ellipse. The proportions of this ellipse are very variable. When the moon is high, the intersection on the plane is nearly circular; when the moon is low, the ellipse becomes greatly elongated. Often the long axis may be more than twice the length of the short axis. It follows that, if the long axis happens to lie athwart the northward direction of flight and the short axis across the eastward direction, we will get on the average over twice as large a sample of birds flying toward the north as of birds flying toward the east.
In summary, whether we wish to compare different stations, different hours of the night, or different directions during the same hour of the night, no conclusions regarding even the relative numbers of birds migrating are warranted, unless they take into account the ever-varying dimensions of the field of observation. Otherwise we are attempting to measure migration with a unit that is constantly expanding or contracting. Otherwise we may expect the same kind of meaningless results that we might obtain by combining measurements in millimeters with measurements in inches. Some method must be found by which we can reduce all data to a standard basis for comparison.
The Directional Element in Sampling
In seeking this end, we must immediately reject the simple logic of sampling that may be applied to density studies of animals on land. We must not assume that, since the field of observation is a volume in space, the number of birds therein can be directly expressed in terms of some standard volume—a cubic mile, let us say. Four birds counted in a cone of observation computed as 1/500 of a cubic mile are not the equivalent of 500 × 4, or 2000, birds per cubic mile. Nor do four birds flying over a sample 1/100 of a square mile mathematically represent 400 birds passing over the square mile. The reason is that we are not dealing with static bodies fixed in space but with moving objects, and the objects that pass through a cubic mile are not the sum of the objects moving through each of its 500 parts. If this fact is not immediately apparent, consider the circumstances in Figures 6 and 7, illustrating the principle as it applies to areas. The relative capacity of the sample and the whole to intercept bodies in motion is more closely expressed by the ratio of their perimeters in the case of areas and the ratio of their surface areas in the case of volumes. But even these ratios lead to inaccurate results unless the objects are moving in all directions equally (see Figure 8). Since bird migration exhibits strong directional tendencies, I have come to the conclusion that no sampling procedure that can be applied to it is sufficiently reliable short of handling each directional trend separately.
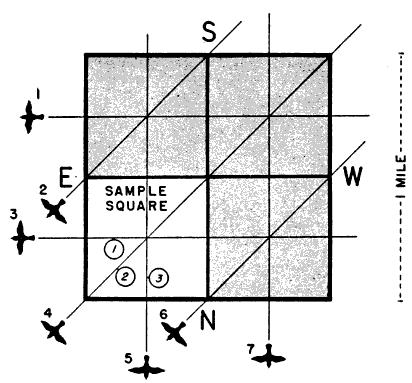
Fig. 6. The problem of sampling migrating birds. The large square in the diagram may be thought of as a square mile on the earth's surface, divided into four equal smaller squares. Birds are crossing over the area in three directions, equally spaced, so that each of the subdivisions is traversed by three of them. We might be tempted to conclude that 4 × 3, or 12, would pass over the large square. Actually there are only seven birds involved all told. Obviously, the interceptive potential of a small square and a larger square do not stand in the same ratio as their areas.
For this reason, the success of the whole quantitative study of migration depends upon our ability to make directional analyses of primary data. As I have already pointed out, the flight directions of birds may be recorded with convenience and a fair degree of objectivity by noting the slant of their apparent pathways across the disc of the moon. But these apparent pathways are seldom the real pathways. Usually they involve the transfer of the flight line from a horizontal plane of flight to a tilted plane represented by the face of the moon, and so take on the nature of a projection. They are clues to directions, but they are not the directions themselves. For each compass direction of birds flying horizontally above the earth, there is one, and only one, slant of the pathway across the moon at a given time. It is possible, therefore, knowing the path of a bird in relation to the lunar disc and the time of the observation, to compute the direction of its path in relation to the earth. The formula employed is not a complicated one, but, since the meaning of the lunar coördinates in terms of their corresponding flight paths parallel to the earth is constantly changing with the position of the moon, the calculation of each bird's flight separately would require a tremendous amount of time and effort.
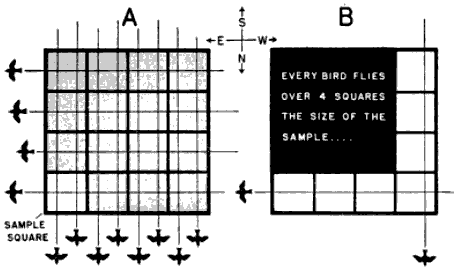
Fig. 7. The sampling effect of a square. In Diagram A eight evenly distributed birds are flying from south to north, and another four are proceeding from east to west. Three appear in each of the smaller squares. Thus, if we were to treat any of these smaller sections as a directly proportionate sample of the whole, we would be assuming that 3 × 16, or 48, birds had traversed the square mile—four times the real total of 12. If we consider the paths separately as in Diagram B, we see quite clearly what is wrong. Every bird crosses four plots the size of the sample and is being computed into the total over and over a corresponding number of times. Patently, just as many south-north birds cross the bottom tier of squares as cross the four tiers comprising the whole area. Just as many west-east birds traverse one side of the large square as cross the whole square. In other words, the inclusion of additional sections athwart the direction of flight involves the inclusion of additional birds proceeding in that direction, while the inclusion of additional sections along the direction does not. The correct ratio of the sample to the whole would seem to be the ratio of their perimeters, in this case the ratio of one to four. When this factor of four is applied to the problem it proves correct: 4 × 3 (the number of birds that have been seen in the sample square) equals 12 (the exact number of birds that could be seen in the square mile).
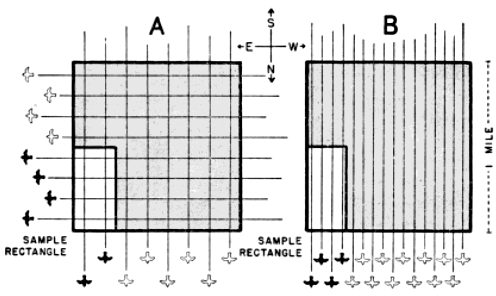
Fig. 8. Rectangular samples of square areas. In Diagram A, where as many birds are flying from west to east as are flying from south to north, the perimeter ratio (three to eight) correctly expresses the number of birds that have traversed the whole area relative to the number that have passed through the sample. But in Diagram B, where all thirty-two birds are flying from south to north, the correct ratio is the ratio of the base of the sample to the base of the total area (one to four), and use of the perimeter ratio would lead to an inaccurate result (forty-three instead of thirty-two birds). Perimeter ratios do not correctly express relative interceptory potential, unless the shape of the sample is the same as the shape of the whole, or unless the birds are flying in all directions equally.
Whatever we do, computed individual flight directions must be frankly recognized as approximations. Their anticipated inaccuracies are not the result of defects in the mathematical procedure employed. This is rigorous. The difficulty lies in the impossibility of reading the slants of the pathways on the moon precisely and in the three-dimensional nature of movement through space. The observed coördinates of birds' pathways across the moon are the projected product of two component angles—the compass direction of the flight and its slope off the horizontal, or gradient. These two factors cannot be dissociated by any technique yet developed. All we can do is to compute what a bird's course would be, if it were flying horizontal to the earth during the interval it passes before the moon. We cannot reasonably assume, of course, that all nocturnal migration takes place on level planes, even though the local distractions so often associated with sloping flight during the day are minimized in the case of migrating birds proceeding toward a distant destination in darkness. We may more safely suppose, however, that deviations from the horizontal are random in nature, that it is mainly a matter of chance whether the observer happens to see an ascending segment of flight or a descending one. Over a series of observations, we may expect a fairly even distribution of ups and downs. It follows that, although departures from the horizontal may distort individual directions, they tend to average out in the computed trend of the mean. The working of this principle applied to the undulating flight of the Goldfinch (Spinus) is illustrated in Figure 9.
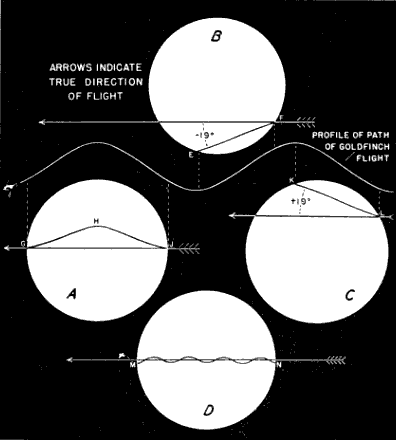
Fig. 9. The effect of vertical components in bird flight. The four diagrams illustrate various effects that might result if a bird with an undulating flight, such as a Goldfinch, flew before a moon 45° above the horizon. In each case the original profile of the pathways, illustrated against the dark background, is flattened considerably as a result of projection. In the situation shown in Diagram A, where the high point of the flight line, GHJ, occurs within the field of the telescope, it is not only obvious that a deviation is involved, but the line GJ drawn between the entry and departure points coincides with the normal coördinates of a bird proceeding on a horizontal plane. In Diagrams B and C, one which catches an upward segment of flight, and the other, a downward segment, the nature of the deviation would not be detectable, and an incorrect direction would be computed from the coördinates. Over a series of observations, including many Goldfinches, one would expect a fairly even distribution of ups and downs. Since the average between the coördinate angles in Diagrams B and C, +19° and -19°, is the angle of the true coördinate, we have here a situation where the errors tend to compensate. In Diagram D, where the bird is so far away that several undulations are encompassed within the diameter of the field of view, the coördinate readings do not differ materially from those of a straight line.
Since individually computed directions are not very reliable in any event, little is to be lost by treating the observed pathways in groups. Consequently, the courses of all the birds seen in a one-hour period may be computed according to the position of the moon at the middle of the interval and expressed in terms of their general positions on the compass, rather than their exact headings. For this latter purpose, the compass has been divided into twelve fixed sectors, 22½ degrees wide. The trends of the flight paths are identified by the mid-direction of the sector into which they fall. The sectoring method is described in detail in the section on procedures.
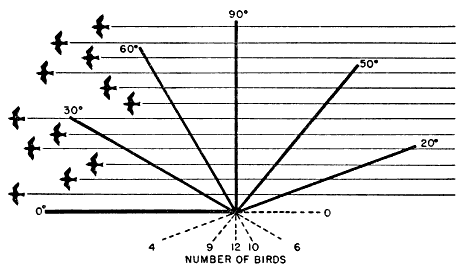
Fig. 10. The interceptory potential of slanting lines. The diagram deals with one direction of flight and its incidence across lines of six different slants, lines of identical length oriented in six different ways. Obviously, the number of birds that cross a line depends not only on the length of the line, but also on its slant with respect to the flight paths.
The problem remains of converting the number of birds involved in each directional trend to a fixed standard of measurement. Figure 7A contains the partial elements of a solution. All of the west-east flight paths that cross the large square also cross one of its mile-long sides and suggest the practicability of expressing the amount of migration in any certain direction in terms of the assumed quantity passing over a one-mile line in a given interval of time. However, many lines of that length can be included within the same set of flight paths (Figure 10); and the number of birds intercepted depends in part upon the orientation of the line. The 90° line is the only one that fully measures the amount of flight per linear unit of front; and so I have chosen as a standard an imaginary mile on the earth's surface lying at right angles to the direction in which the birds are traveling.
Definitions of Flight Density
When the count of birds in the cone of observation is used as a sample to determine the theoretical number in a sector passing over such a mile line, the resulting quantity represents what I shall call a Sector Density. It is one of several expressions of the more general concept of Flight Density, which may be defined as the passage of migration past an observation station stated in terms of the theoretical number of birds flying over a one-mile line on the earth's surface in a given interval of time. Note that a flight density is primarily a theoretical number, a statistical expression, a rate of passage. It states merely that birds were moving through the effective field of observation at the rate of so many per mile per unit of time. It may or may not closely express the amount of migration occurring over an actual mile or series of miles. The extent to which it does so is to be decided by other general criteria and by the circumstances surrounding a given instance. Its basic function is to take counts of birds made at different times and at different places, in fields of observation of different sizes, and to put them on the statistically equal footing that is the first requisite of any sound comparison.
The idea of a one-mile line as a standard spacial measurement is an integral part of the basic concept, as herein propounded. But, within these limitations, flight density may be expressed in many different ways, distinguished chiefly by the directions included and the orientation of the one-mile line with respect to them. Three such kinds of density have been found extremely useful in subsequent analyses and are extensively employed in this paper: Sector, Net Trend, and Station Density, or Station Magnitude.
Sector Density has already been referred to. It may be defined as the flight density within a 22½° directional spread, or sector, measured across a one-mile line lying at right angles to the mid-direction of the sector. It is the basic type of density from the point of view of the computer, the others being derived from it. In analysis it provides a means of comparing directional trends at the same station and of studying variation in directional fanning.
Net Trend Density represents the maximum net flow of migration over a one-mile line. It is found by plotting the sector densities directionally as lines of thrust, proportioned according to the density in each sector, and using vector analysis to obtain a vector resultant, representing the density and direction of the net trend. The mile line defining the spacial limits lies at right angles to this vector resultant, but the density figure includes all of the birds crossing the line, not just those that do so at a specified angle. Much of the directional spread exhibited by sector densities undoubtedly has no basis in reality but results from inaccuracies in coördinate readings and from practical difficulties inherent in the method of computation. By reducing all directions to one major trend, net trend density has the advantage of balancing errors one against the other and may often give the truer index to the way in which the birds are actually going. On the other hand, if the basic directions are too widely spread or if the major sector vectors are widely separated with little or no representation between, the net trend density may become an abstraction, expressing the idea of a mean direction but pointing down an avenue along which no migrants are traveling. In such instances, little of importance can be learned from it. In others, it gives an idea of general trends indispensable in comparing station with station to test the existence of flyways and in mapping the continental distribution of flight on a given night to study the influence of weather factors.
Station Density, or Station Magnitude, represents all of the migration activity in an hour in the vicinity of the observation point, regardless of direction. It expresses the sum of all sector densities. It includes, therefore, the birds flying at right angles over several one-mile lines. One way of picturing its physical meaning is to imagine a circle one-mile in diameter lying on the earth with the observation point in the center. Then all of the birds that fly over this circle in an hour's time constitute the hourly station density. While its visualization thus suggests the idea of an area, it is derived from linear expressions of density; and, while it involves no limitation with respect to direction, it could not be computed without taking every component direction into consideration. Station density is adapted to studies involving the total migration activity at various stations. So far it has been the most profitable of all the density concepts, throwing important light on nocturnal rhythm, seasonal increases in migration, and the vexing problem of the distribution of migrating birds in the region of the Gulf of Mexico.
Details of procedure in arriving at these three types of flight density will be explained in Section B of this discussion. For the moment, it will suffice to review and amplify somewhat the general idea involved.
Altitude as a Factor in Flight Density
A flight density, as we have seen, may be defined as the number of birds passing over a line one mile long; and it may be calculated from the number of birds crossing the segment of that line included in an elliptical cross-section of the cone of observation. It may be thought of with equal correctness, without in any way contradicting the accuracy of the original definition, as the number of birds passing through a vertical plane one mile long whose upper limits are its intersection with the flight ceiling and whose base coincides with the one mile line of the previous visualization. From the second point of view, the sample becomes an area bounded by the triangular projection of the cone of observation on the density plane. The dimensions of two triangles thus determined from any two cones of observation stand in the same ratio as the dimensions of their elliptical sections on any one plane; so both approaches lead ultimately to the same result. The advantage of this alternative way of looking at things is that it enables us to consider the vertical aspects of migration—to comprehend the relation of altitude to bird density.
If the field of observation were cylindrical in shape, if it had parallel sides, if its projection were a rectangle or a parallelogram, the height at which birds are flying would not be a factor in finding out their number. Then the sample would be of equal breadth throughout, with an equally wide representation of the flight at all levels. Since the field of observation is actually an inverted cone, triangular in section, with diverging sides, the opportunity to detect birds increases with their distance from the observer. The chances of seeing the birds passing below an elevation midway to the flight ceiling are only one-third as great as of seeing those passing above that elevation, simply because the area of that part of the triangle below the mid-elevation is only one-third as great as the area of that part above the mid-elevation. If we assume that the ratio of the visible number of birds to the number passing through the density plane is the same as the ratio of the triangular section of the cone to the total area of the plane, we are in effect assuming that the density plane is made up of a series of triangles the size of the sample, each intercepting approximately the same number of birds. We are assuming that the same number of birds pass through the inverted triangular sample as through the erect and uninvestigable triangle beside it (as in Figure 11, Diagram II). In reality, the assumption is sound only if the altitudinal distribution of migrants is uniform.
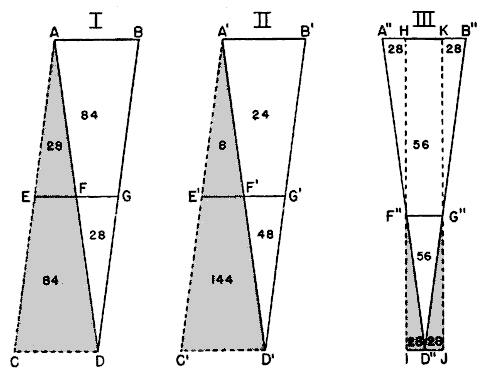
Fig. 11. Theoretical possibilities of vertical distribution. Diagram I shows the effect of a uniform vertical distribution of birds. The figures indicate the number of birds in the respective areas. Here the sample triangle, ABD, contains the same number of birds as the upright triangle, ACD, adjacent to it; the density plane may be conceived of as a series of such alternating triangles, equal in their content of birds. Diagram II portrays, on an exaggerated scale, the situation when many more birds are flying below the median altitude than above it. In contrast to the 152 birds occurring in the triangle A´C´D´, only seventy-two are seen in the triangle A´B´D´. Obviously, the latter triangle does not provide a representative sample of the total number of birds intersecting the density plane. Diagram III illustrates one method by which this difficulty may be overcome. By lowering the line F´G´ to the median altitude of bird density, F´´G´´ (the elevation above which there are just as many birds as below), we are able to determine a rectangular panel, HIJK, whose content of birds provides a representative sample of the vertical distribution.
The definite data on this subject are meagre. Nearly half a century ago, Stebbins worked out a way of measuring the altitude of migrating birds by the principle of parallax. In this method, the distance of a bird from the observers is calculated from its apparent displacement on the moon as seen through two telescopes. Stebbins and his colleague, Carpenter, published the results of two nights of observation at Urbana, Illinois (Stebbins, 1906; Carpenter, 1906); and then the idea was dropped until 1945, when Rense and I briefly applied an adaptation of it to migration studies at Baton Rouge. Results have been inconclusive. This is partly because sufficient work has not been done, partly because of limitations in the method itself. If the two telescopes are widely spaced, few birds are seen by both observers, and hence few parallaxes are obtained. If the instruments are brought close together, the displacement of the images is so reduced that extremely fine readings of their positions are required, and the margin of error is greatly increased. Neither alternative can provide an accurate representative sample of the altitudinal distribution of migrants at a station on a single night. New approaches currently under consideration have not yet been perfected.
Meanwhile the idea of uniform vertical distribution of migrants must be dismissed from serious consideration on logical grounds. We know that bird flight cannot extend endlessly upward into the sky, and the notion that there might be a point to which bird density extends in considerable magnitude and then abruptly drops off to nothing is absurd. It is far more likely that the migrants gradually dwindle in number through the upper limits at which they fly, and the parallax observations we have seem to support this view.
Under these conditions, there would be a lighter incidence of birds in the sample triangle than in the upright triangle beside it (Figure 11, Diagram III). Compensation can be made by deliberately scaling down the computed size of the sample area below its actual size. A procedure for doing this is explained in Figure 11. If it were applied to present altitudinal data, it would place the computational flight ceiling somewhere below 4000 feet. In arriving at the flight densities used in this paper, however, I have used an assumed ceiling of one mile. When the altitude factor is thus assigned a value of 1, it disappears from the formula, simplifying computations. Until the true situation with respect to the vertical distribution of flight is better understood, it seems hardly worthwhile to sacrifice the convenience of this approximation to a rigorous interpretation of scanty data. This particular uncertainty, however, does not necessarily impair the analytical value of the computations. Provided that the vertical pattern of migration is more or less constant, flight densities still afford a sound basis for comparisons, wherever we assume the upper flight limits to be. Raising or lowering the flight ceiling merely increases or reduces all sample cones or triangles proportionately.
A more serious possibility is that the altitudinal pattern may vary according to time or place. This might upset comparisons. If the divergencies were severe enough and frequent enough, they could throw the study of flight densities into utter confusion.
This consideration of possible variation in the altitudinal pattern combines with accidents of sampling and the concessions to perfect accuracy, explained on pages 379-385, to give to small quantities of data an equivocal quality. As large-scale as the present survey is from one point of view, it is only a beginning. Years of intensive work and development leading to a vast accumulation of data must elapse before the preliminary indications yet discernible assume the status of proved principles. As a result, much of the discussion in Part II of this paper is speculative in intent, and most of the conclusions suggested are of a provisional nature. Yet, compared with similar procedures in its field, flight density study is a highly objective method, and a relatively reliable one. In no other type of bird census has there ever been so near a certainty of recording all of the individuals in a specified space, so nearly independently of the subjective interpretations of the observer. The best assurance of the essential soundness of the flight density computations lies in the coherent results and the orderly patterns that already emerge from the analyses presented in Part II.
B. Observational Procedure And The Processing Of Data
At least two people are required to operate an observation station—one to observe, the other to record the results. They should exchange duties every hour to avoid undue eye fatigue. Additional personnel are desirable so that the night can be divided into shifts.
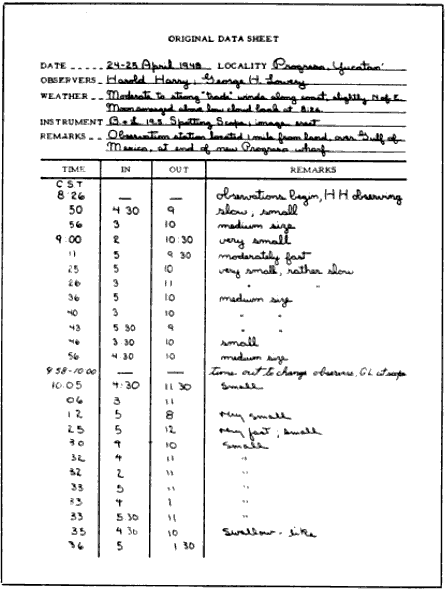
Essential materials and equipment include: (1) a small telescope; (2) a tripod with pan-tilt or turret head and a mounting cradle; (3) data sheets similar to the one illustrated in Figure 12. Bausch and Lomb or Argus spotting scopes (19.5 ×) and astronomical telescopes up to 30- or 40-power are ideal. Instruments of higher magnification are subject to vibration, unless very firmly mounted, and lead to difficulties in following the progress of the moon, unless powered by clockwork. Cradles usually have to be devised. An adjustable lawn chair is an important factor in comfort in latitudes where the moon reaches a point high overhead.
Click here to see a transcription.
Fig. 12. Facsimile of form used to record data in the field. One sheet of the actual observations obtained at Progreso, Yucatán, on April 24-25, 1948, is reproduced here. The remainder of this set of data, which is to be used throughout the demonstration of procedures, is shown in Table 1.
As much detail as possible should be entered in the space provided at the top of the data sheet. Information on the weather should include temperature, description of cloud cover, if any, and the direction and apparent speed of surface winds. Care should be taken to specify whether the telescope used has an erect or inverted image. The entry under "Remarks" in the heading should describe the location of the observation station with respect to watercourses, habitations, and prominent terrain features.
The starting time is noted at the top of the "Time" column, and the observer begins the watch for birds. He must keep the disc of the moon under unrelenting scrutiny all the while he is at the telescope. When interruptions do occur as a result of changing positions with the recorder, re-adjustments of the telescope, or the disappearance of the moon behind clouds, the exact duration of the "time out" must be set down.
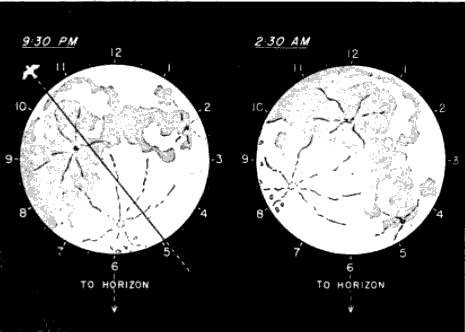
Fig. 13. The identification of coördinates. These diagrams illustrate how the moon may be envisioned as a clockface, constantly oriented with six o'clock nearest the horizon and completely independent of the rotation of the moon's topographic features.
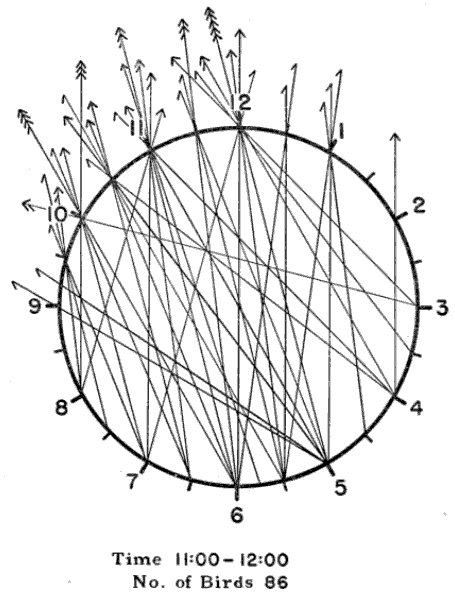
Fig. 14. The apparent pathways of the birds seen in one hour. The observations are those recorded in the 11:00-12:00 P. M. interval on April 24-25, 1948, at Progreso, Yucatán (see Table 1).
Whenever a bird is seen, the exact time must be noted, together with its apparent pathway on the moon. These apparent pathways can be designated in a simple manner. The observer envisions the disc of the moon as the face of a clock, with twelve equally spaced points on the circumference marking the hours (Figure 13). He calls the bottommost point 6 o'clock and the topmost, 12. The intervals in between are numbered accordingly. As this lunar clockface moves across the sky, it remains oriented in such a way that 6 o'clock continues to be the point nearest the horizon, unless the moon reaches a position directly overhead. Then, all points along the circumference are equidistant from the horizon, and the previous definition of clock values ceases to have meaning. This situation is rarely encountered in the northern hemisphere during the seasons of migration, except in extreme southern latitudes. It is one that has never actually been dealt with in the course of this study. But, should the problem arise, it would probably be feasible to orient the clock during this interval with respect to the points of the compass, calling the south point 6 o'clock.
When a bird appears in front of the moon, the observer identifies its entry and departure points along the rim of the moon with respect to the nearest half hour on the imaginary clock and informs the recorder. In the case of the bird shown in Figure 13, he would simply call out, "5 to 10:30." The recorder would enter "5" in the "In" column on the data sheet (see Figure 12) and 10:30 in the "Out" column. Other comment, offered by the observer and added in the remarks column, may concern the size of the image, its speed, distinctness, and possible identity. Any deviation of the pathway from a straight line should be described. This information has no bearing on subsequent mathematical procedure, except as it helps to eliminate objects other than birds from computation.
The first step in processing a set of data so obtained is to blue-pencil all entries that, judged by the accompanying remarks, relate to extraneous objects such as insects or bats. Next, horizontal lines are drawn across the data sheets marking the beginning and the end of each even hour of observation, as 8 P. M.-9 P. M., 9 P. M.-10 P. M., etc. The coördinates of the birds in each one-hour interval may now be plotted on separate diagrammatic clockfaces, just as they appeared on the moon. Tick marks are added to each line to indicate the number of birds occurring along the same coördinate. The slant of the tick marks distinguishes the points of departure from the points of entry. Figure 14 shows the plot for the 11 P. M.-12 P. M. observations reproduced in Table 1. The standard form, illustrated in Figure 15, includes four such diagrams.
Applying the self-evident principle that all pathways with the same slant represent the same direction, we may further consolidate the plots by shifting all coördinates to the corresponding lines passing through the center of the circle, as in Figure 15. To illustrate, the 6 to 8, 5 to 9, 3 to 11, and 2 to 12 pathways all combine on the 4 to 10 line. Experienced computers eliminate a step by directly plotting the pathways through center, using a transparent plastic straightedge ruled off in parallel lines.
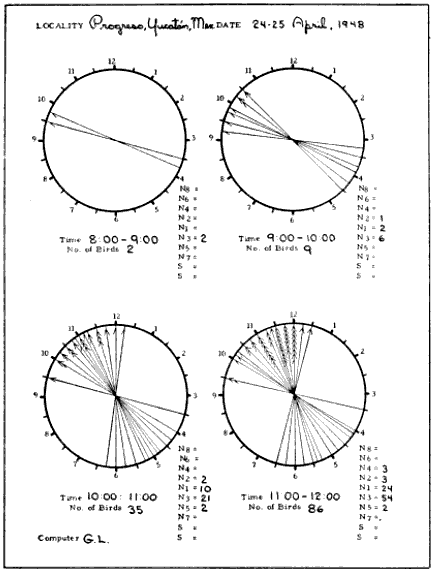
Fig. 15. Standard form for plotting the apparent paths of flight. On these diagrams the original coördinates, exemplified by Figure 14, have been moved to center. In practice the sector boundaries are drawn over the circles in red pencil, as shown by the white lines in Figure 19, making it possible to count the number of birds falling within each zone. These numbers are then tallied in the columns at the lower right of each hourly diagram.
Table 1.—Continuation of Data in Figure 12, Showing Time and Readings of Observations on 24-25 April 1948, Progreso, Yucatán
============================= ============================= Time In Out Time In Out ----------------------------- ----------------------------- 10:37-10:41 Time out 11:15 8 9:30 10:45 5:30 10 11:16 4 11 6 9 5 9 5:30 10 11:17 5 11:30 10:46 6 8 11:18 5 12 3:30 11 6 11:30 5 12 11:19 5:30 11:30 10:47 3:15 1 11:20 6 10 6 8:30 3 12 5:45 11:45 5 12 5 10 11:21 5:45 11 10:48 6 9:45 5 11 10:50 5:30 11 11:23 5 12 10:51 4 11 11:25 5 10:30 10:52 4 2 6 11 5:30 11 6 12 10:53 5:30 11:30 11:27 6 10 5 11 11:28 6 11:30 10:55 5 12 5:30 12:30 5 11 11:29 6 11:30 10:56 6 10 4 12 10:58 4:30 11:30 6:30 10:30 5:45 11:45 6 11 10:59 6:30 10:30 11:30 3 10 11:00 3:30 12 (2 birds at once) 6:30 11 11:31 5 10:30 (2 birds at once) 5:30 10:30 11:03 6 11 11:32 6 11:30 11:04 3 12 11:33 7:30 9:30 5 12 4 10:30 11:05 6 10 6 11:30 5 11 8 9:30 11:06 6 10:30 11:35 7 10 11:07 3 10 4:30 1 11:08 6 11 11:38 6:30 11 11:10 7 9:30 11:40 5:30 12 11:11 5 9:15 11:42 4 2 11:13 5 12 5 12 11:14 6:30 10 6 10 5:30 1 4 2 4 12 5 12
Table 1.—Concluded
============================= ============================= Time In Out Time In Out ----------------------------- ----------------------------- 11:44 8 9:30 8 10:15 7 11 12:16 3:30 1:30 6 10 8 11 11:45 5 12 12:23 7 1:30 6 10:30 6 12:30 5:45 11 12:36 8 11 4 12 12:37 7:30 1 11:46 7 11 12:38 7 12:30 6 12 12:40 8 1 11:47 8 10 12:45 7:30 1 11:48 6 10 12:47 5:30 1 11:49 6:30 10:30 12:48 7 1 11:51 8 10 12:52 5:30 1:30 8 10 12:54-12:55 Time out 8 10 12:56 8 10:45 8 10 12:58 5:30 1:30 6 10 7 1:30 8 10 7 2 6 11 12:59 5 3 7 12 1:00-1:30 Time out 11:52 5 1 1:37 8 12 11:54 7 11 1:38 8 12 6 12:30 1:48 7 1 11:55 5 12 7 1 11:56 7 10 1:51 5:30 11 5 12 1:57 8 1 11:58 8 11 2:07 7 2 11:59 5:30 12 2:09 9 12 12:00-12:03 Time out 2:10 8 1 12:03 5:30 11:30 2:17 9 12 12:04 8 11 2:21 6 2 12:07 6 12:30 2:30 5:30 3:15 7:30 1 2:32 8 2 12:08 5 10:30 2:46 7 1 12:09 5:30 1 3:36 9 2 7:30 2 3:39 8:30 2 12:10 6:30 12:45 3:45 6 4 12:13 8 11 3:55 9 2 12:14 7 1 4:00 8 3 12:15 7 12:30 4:03 9 2 7:15 1:30 4:30 Closed station ----------------------------- -----------------------------
We now have a concise picture of the apparent pathways of all the birds recorded in each hour of observation. But the coördinates do not have the same meaning as readings of a horizontal clock on the earth's surface, placed in relation to the points of the compass. They are merely projections of the birds' courses. An equation is available for reversing the effect of projection and discovering the true directions of flight. This formula, requiring thirty-five separate computations for the pathways reproduced in Figure 12 alone, is far too-consuming for the handling of large quantities of data. A simpler procedure is to divide the compass into sectors and, with the aid of a reverse equation, to draw in the projected boundaries of these divisions on the circular diagrams of the moon. A standardized set of sectors, each 22½° wide and bounded by points of the compass, has been evolved for this purpose. They are identified as shown in Figure 16. The zones north of the east-west line are known as the North, or N, Sectors, as N1, N2, N3, etc. Each zone south of the east-west line bears the same number as the sector opposite, but is distinguished by the designation S.
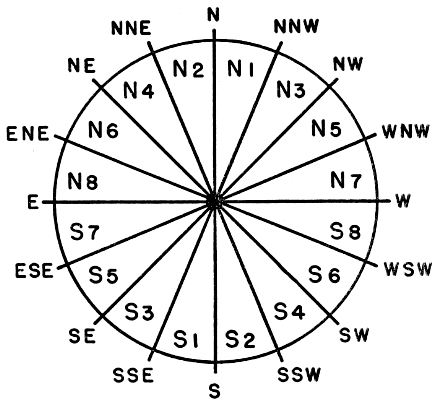
Fig. 16. Standard sectors for designating flight trends. Each zone covers a span of 22½°. The N6 and N8, the N5 and N7, and their south complements, where usually few birds are represented, can be combined and identified as N6-8 and N5-7, etc.
Several methods may be used to find the projection of the sector boundaries on the plot diagrams of Figure 15. Time may be saved by reference to graphic tables, too lengthy for reproduction here, showing the projected reading in degrees for every boundary, at every position of the moon; and a mechanical device, designed by C. M. Arney, duplicating the conditions of the original projection, speeds up the work even further. Both methods are based on the principle of the following formula:
tan 0 (1)
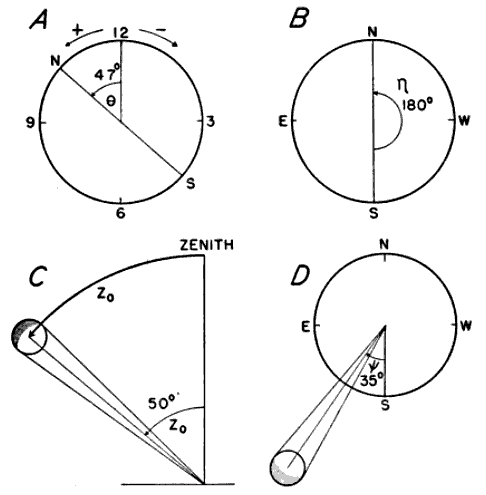
Fig. 17. The meaning of symbols used in the direction formula.
The symbols have these meanings:
Figure 17A).
Figure 17B).
Z0 is the zenith distance of the moon's center midway through the hour of observation, that is, at the half hour. It represents the number of degrees of arc between the center of the moon and a point directly over the observer's head (Figure 17C).
Figure 17D).
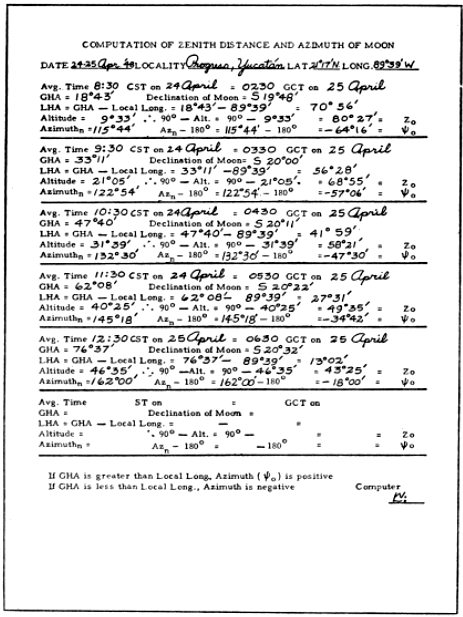
Fig. 18. Form used in the computation of the zenith distance and azimuth of the moon.
The angle Figure 16). The form (Figure 18) for the "Computation of Zenith Distance and Azimuth of the Moon" illustrates the steps in calculating the values of Z0 and 0. From the American Air Almanac (Anonymous, 1945-1948), issued annually by the U. S. Naval Observatory in three volumes, each covering four months of the year, the Greenwich Hour Angle (GHA) and the declination of the moon may be obtained for any ten-minute interval of the date in question. The Local Hour Angle (LHA) of the observation station is determined by subtracting the longitude of the station from the GHA. Reference is then made to the "Tables of Computed Altitude and Azimuth," published by the U. S. Navy Department, Hydrographic Office (Anonymous, 1936-1941), and better known as the "H.O. 214," to locate the altitude and azimuth of the moon at the particular station for the middle of the hour during which the observations were made. The tables employ three variables—the latitude of the locality measured to the nearest degree, the LHA as determined above, and the declination of the moon measured to the nearest 30 minutes of arc. Interpolations can be made, but this exactness is not required. When the latitude of the observation station is in the northern hemisphere, the H.O. 214 tables entitled "Declinations Contrary Name to Latitude" are used with south declinations of the moon, and the tables "Declinations Same Name as Latitude," with north declinations. In the sample shown in Figure 15, the declination of the moon at 11:30 P. M., midway through the 11 to 12 o'clock interval, was S 20° 22´. Since the latitude of Progreso, Yucatán is N 21° 17´, the "Contrary Name" tables apply to this hour.
Because the H.O. 214 expresses the vertical position of the moon in terms of its altitude, instead of its zenith distance, a conversion is required. The former is the number of arc degrees from the horizon to the moon's center; therefore Z0 is readily obtained by subtracting the altitude from 90°. Moreover, the azimuth given in the H.O. 214 is measured on a 360° scale from the north point, whereas the azimuth used here (0) is measured 180° in either direction from the south point, negative values to the east, positive values to the west. I have designated the azimuth of the tables as Azn and obtained the desired azimuth (0) by subtracting 180° from Azn. The sign of 0 may be either positive or negative, depending on whether or not the moon has reached its zenith and hence the meridian of the observer. When the GHA is greater than the local longitude (that is, the longitude of the observation station), the azimuth is positive. When the GHA is less than the local longitude, the azimuth is negative.
Locating the position of a particular sector boundary now becomes a mere matter of substituting the values in the equation (1) and reducing. The computation of the north point for 11 to 12 P. M. in the sample set of data will serve as an example. Since the north point reckoned west from the south point is 180°, its
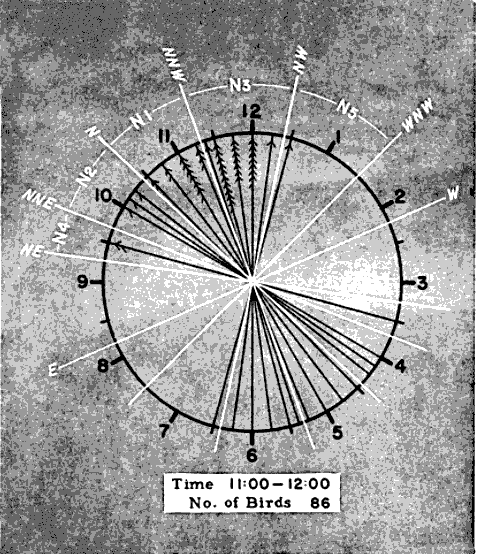
Fig. 19. Method of plotting sector boundaries on the diagrammatic plots. The example employed is the 11:00 to 12:00 P. M. diagram of Figure 15.
tan Npt. = tan (180° - 0)
cos Z0
Substituting values of 0 found on the form (Figure 18):
tan Npt. = tan [180° - (-35°)] = tan 215° = .700 = 1.09
cos 50° cos 50° .643
Npt. = 47°28´
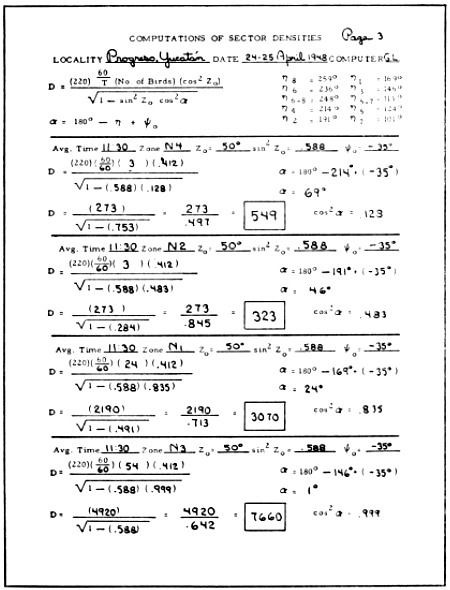
Fig. 20. Form for computing sector densities.
Four angles, one in each quadrant, have the same tangent value. Since, in processing spring data, we are dealing mainly with north sectors, it is convenient to choose the acute angle, in this instance 47°28´. In doubtful cases, the value of the numerator of the equation (here 215°) applied as an angular measure from 6 o'clock will tell in which quadrant the projected boundary must fall. The fact that projection always draws the boundary closer to the 3-9 line serves as a further check on the computation.
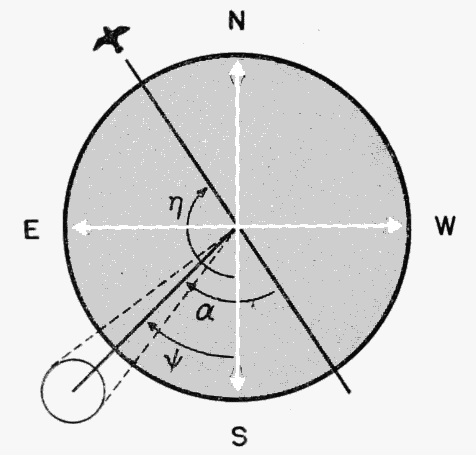
Fig. 21. Determination of the angle
In the same manner, the projected position angles of all the pertinent sector boundaries for a given hour may be calculated and plotted in red pencil with a protractor on the circular diagrams of Figure 15. To avoid confusion in lines, the zones are not portrayed in the black and white reproduction of the sample plot form. They are shown, however, in the shaded enlargement (Figure 19) of the 11 to 12 P. M. diagram. The number of birds recorded for each sector may be ascertained by counting the number of tally marks between each pair of boundary lines and the information may be entered in the columns provided in the plot form (Figure 15).
We are now prepared to turn to the form for "Computations of Sector Densities" (Figure 20), which systematizes the solution of the following equation:
(2)
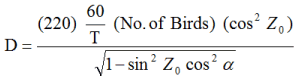
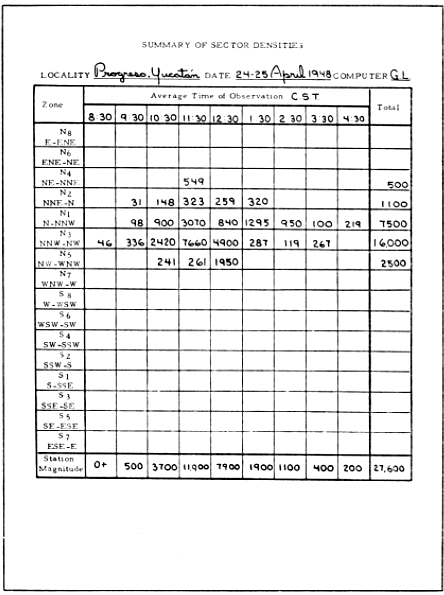
Fig. 22. Facsimile of form summarizing sector densities. The totals at the bottom of each column give the station densities.
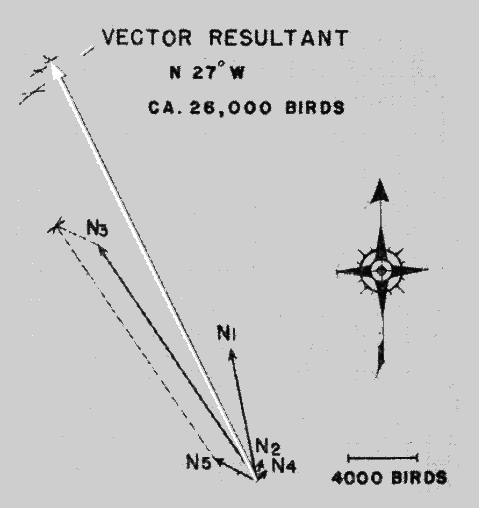
Fig. 23. Determination of Net Trend Density.
Some of the symbols and factors, appearing here for the first time, require brief explanation. D stands for Sector Density. The constant, 220, is the reciprocal of the quotient of the angular diameter of the moon divided by 2. T is Time In, arrived at by subtracting the total number of minutes of time out, as noted for each hour on the original data sheets, from 60. "No. of Birds" is the number for the sector and hour in question as just determined on the plot form. The symbol
0 (3)
The symbol Figure 21. The values of Figure 20). The subsequent reductions of the equations, as they appear in the figure for four zones, are self-explanatory. The end result, representing the sector density, is entered in the rectangular box provided.
After all the sector densities have been computed, they are tabulated on a form for the "Summary of Sector Densities" (Figure 22). By totaling each vertical column, sums are obtained, expressing the Station Density or Station Magnitude for each hour.
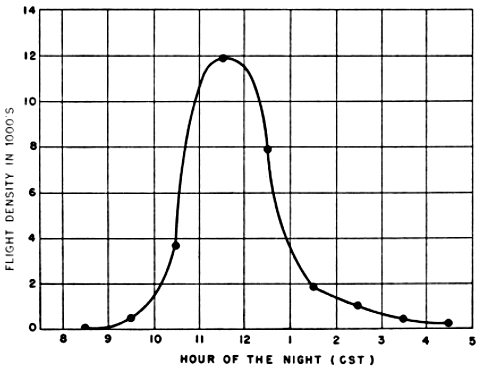
Fig. 24. Nightly station density curve at Progreso, Yucatán, on April 24-25, 1948.
An informative way of depicting the densities in each zone is to plot them as lines of thrust, as in Figure 23. Each sector is represented by the directional slant of its mid-line drawn to a length expressing the flight density per zone on some chosen scale, such as 100 birds per millimeter. Standard methods of vector analysis are then applied to find the vector resultant. This is done by considering the first two thrust lines as two sides of an imaginary parallelogram and using a drawing compass to draw intersecting arcs locating the position of the missing corner. In the same way, the third vector is combined with the invisible resultant whose distal end is represented by the intersection of the first two arcs. The process is repeated successively with each vector until all have been taken into consideration. The final intersection of arcs defines the length and slant of the Vector Resultant, whose magnitude expresses the Net Trend Density in terms of the original scale.
The final step in the processing of a set of observations is to plot on graph paper the nightly station density curve as illustrated by Figure 24.
PART II. THE NATURE OF NOCTURNAL MIGRATION
Present day concepts of the whole broad problem of bird migration are made up of a few facts and many guesses. The evolutionary origin of migration, the modern necessities that preserve its biologic utility, the physiological processes associated with it, the sensory mechanisms that make it possible, the speed at which it is achieved, and the routes followed, all have been the subject of some investigation and much conjecture. All, to a greater or less extent, remain matters of current controversy. All must be considered unknowns in every logical equation into which they enter. Since all aspects of the subject are intimately interrelated, since all have a bearing on the probabilities relating to any one, and since new conjectures must be judged largely in the light of old conjectures rather than against a background of ample facts, the whole field is one in which many alternative explanations of the established phenomena remain equally tenable. Projected into this uncertain atmosphere, any statistical approach such as determinations of flight density will require the accumulation of great masses of data before it is capable of yielding truly definitive answers to those questions that it is suited to solve. Yet, even in their initial applications, density analyses can do much to bring old hypotheses regarding nocturnal migration into sharper definition and to suggest new ones.
The number of birds recorded through the telescope at a particular station at a particular time is the product of many potential variables. Some of these—like the changing size of the field of observation and the elevation of flight—pertain solely to the capacity of the observer to see what is taking place. It is the function of the density and direction formulae to eliminate the influences of these two variables insofar as is possible, so that the realities of the situation take shape in a nearly statistically true form. There remain to be considered those influences potentially responsible for variations in the real volume of migration at different times and places—things like the advance of season, geographic location, disposition of terrain features, hourly activity rhythm, wind currents, and other climatological causes. The situation represented by any set of observations probably is the end result of the interaction of several such factors. It is the task of the discussions that follow to analyze flight densities in the light of the circumstances surrounding them and by statistical insight to isolate the effects of single factors. When this has been done, we shall be brought closer to an understanding of these influences themselves as they apply to the seasonal movements of birds. Out of data that is essentially quantitative, conclusions of a qualitative nature will begin to take form. It should be constantly borne in mind, however, that such conclusions relate to the movement of birds en masse and that caution must be used in applying these conclusions to any one species.
Since the dispersal of migrants in the night sky has a fundamental bearing on the sampling procedure itself, and therefore on the reliability of figures on flight density, consideration can well be given first to the horizontal distribution of birds on narrow fronts.
A. Horizontal Distribution Of Birds On Narrow Fronts
Bird migration, as we know it in daytime, is characterized by spurts and uneven spatial patterns. Widely separated V's of geese go honking by. Blackbirds pass in dense recurrent clouds, now on one side of the observer, now on the other. Hawks ride along in narrow file down the thermal currents of the ridges. Herons, in companies of five to fifty, beat their way slowly along the line of the surf. And an unending stream of swallows courses low along the levees. Everywhere the impression is one of birds in bunches, with vast spaces of empty sky between.
Such a situation is ill-suited to the sort of sampling procedure on which flight density computations are based. If birds always traveled in widely separated flocks, many such flocks might pass near the cone of observation and still, by simple chance, fail to enter the sliver of space where they could be seen. Chance would be the dominating factor in the number of birds recorded, obscuring the effects of other influences. Birds would seldom be seen, but, when they did appear, a great many would be observed simultaneously or in rapid succession. When these telescopic studies were first undertaken at Baton Rouge in 1945, some assurance already existed, however, that night migrants might be so generally dispersed horizontally in the darkness above that the number passing through the small segment of sky where they could be counted would furnish a nearly proportionate sample of the total number passing in the neighborhood of the observation station. This assurance was provided by the very interesting account of Stone (1906: 249-252), who enjoyed the unique experience of viewing a nocturnal flight as a whole. On the night of March 27, 1906, a great conflagration occurred in Philadelphia, illuminating the sky for a great distance and causing the birds overhead to stand out clearly as their bodies reflected the light. Early in the night few birds were seen in the sky, but thereafter they began to come in numbers, passing steadily from the southwest to the northeast. At ten o'clock the flight was at its height. The observer stated that two hundred birds were in sight at any given moment as he faced the direction from which they came. This unparalleled observation is of such great importance that I quote it in part, as follows: "They [the birds] flew in a great scattered, wide-spread host, never in clusters, each bird advancing in a somewhat zigzag manner…. Far off in front of me I could see them coming as mere specks…gradually growing larger as they approached…. Over the illuminated area, and doubtless for great distances beyond, they seemed about evenly distributed…. I am inclined to think that the migrants were not influenced by the fire, so far as their flight was concerned, as those far to the right were not coming toward the blaze but keeping steadily on their way…. Up to eleven o'clock, when my observations ceased, it [the flight] continued apparently without abatement, and I am informed that it was still in progress at midnight."
Similarly, in rather rare instances in the course of the present study, the combination of special cloud formations and certain atmospheric conditions has made it possible to see birds across the entire field of the telescope, whether they actually passed before the moon or not. In such cases the area of the sky under observation is greatly increased, and a large segment of the migratory movement can be studied. In my own experience of this sort, I have been forcibly impressed by the apparent uniformity and evenness of the procession of migrants passing in review and the infrequence with which birds appeared in close proximity.
As striking as these broader optical views of nocturnal migration are, they have been too few to provide an incontestable basis for generalizations. A better test of the prevailing horizontal distribution of night migrants lies in the analysis of the telescopic data themselves.
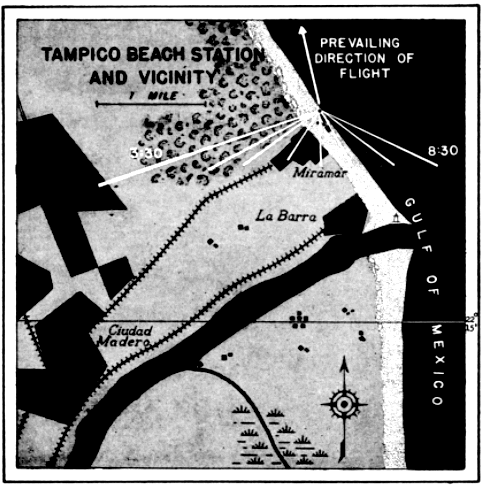
Fig. 25. Positions of the cone of observation at Tampico, Tamps., on April 21-22, 1948. Essential features of this diagrammatic map are drawn to scale, the triangular white lines representing the projections of the cone of observation on the actual terrain at the mid-point of each hour of observation. If the distal ends of the position lines were connected, the portion of the map encompassed would represent the area over which all the birds seen between 8:30 P. M. and 3:30 A. M. must have flown.
The distribution in time of birds seen by a single observer may be studied profitably in this connection. Since the cone of observation is in constant motion, swinging across the front of birds migrating from south to north, each interval of time actually represents a different position in space. This is evident from the map of the progress of the field of observation across the terrain at Tampico, Tamaulipas, on April 21-22, 1948 (Figure 25). At this station on this night, a total of 259 birds were counted between 7:45 P. M. and 3:45 A. M. The number seen in a single hour ranged from three to seventy-three, as the density overhead mounted to a peak and then declined. The number of birds seen per minute was not kept with stop watch accuracy; consequently, analysis of the number of birds that passed before the moon in short intervals of time is not justified. It appears significant, however, that in the ninety minutes of heaviest flight, birds were counted at a remarkably uniform rate per fifteen minute interval, notwithstanding the fact that early in the period the flight rate overhead had reached a peak and had begun to decline. The number of birds seen in successive fifteen-minute periods was twenty-six, twenty-five, nineteen, eighteen, fifteen, and fifteen.
Also, despite the heavy volume of migration at this station on this particular night, the flight was sufficiently dispersed horizontally so that only twice in the course of eight hours of continuous observation did more than one bird simultaneously appear before the moon. These were "a flock of six birds in formation" seen at 12:09 A. M. and "a flock of seven, medium-sized and distant," seen at 2:07 A. M. In the latter instance, as generally is the case when more than one bird is seen at a time, the moon had reached a rather low altitude, and consequently the cone of observation was approaching its maximum dimensions.
The comparative frequency with which two or more birds simultaneously cross before the moon would appear to indicate whether or not there is a tendency for migrants to fly in flocks. It is significant, therefore, that in the spring of 1948, when no less than 7,432 observations were made of birds passing before the moon, in only seventy-nine instances, or 1.1 percent of the cases, was more than one seen at a time. In sixty percent of these instances, only two birds were involved. In one instance, however, again when the moon was low and the cone of observation near its maximum size, a flock estimated at twenty-five was recorded.
The soundest approach of all to the study of horizontal distribution at night, and one which may be employed any month, anywhere, permitting the accumulation of statistically significant quantities of data, is to set up two telescopes in close proximity. Provided the flight overhead is evenly dispersed, each observer should count approximately the same number of birds in a given interval of time. Some data of this type are already available. On May 19-20, at Urbana, Illinois, while stationed twenty feet apart making parallax studies with two telescopes to determine the height above the earth of the migratory birds, Carpenter and Stebbins (loci cit.) saw seventy-eight birds in two and one-half hours. Eleven were seen by both observers, thirty-three by Stebbins only, and thirty-four by Carpenter only. On October 10, 1905, at the same place, in two hours, fifty-seven birds were counted, eleven being visible through both telescopes. Of the remainder, Stebbins saw seventeen and Carpenter, twenty-nine. On September 12, 1945, at Baton Rouge, Louisiana, in an interval of one hour and forty minutes, two independent observers each counted six birds. Again, on October 17, 1945, two observers each saw eleven birds in twenty-two minutes. On April 10, 1946, in one hour and five minutes, twenty-four birds were seen through one scope and twenty-six through the other. Likewise on May 12, 1946, in a single hour, seventy-three birds were counted by each of two observers. The Baton Rouge observations were made with telescopes six to twelve feet apart. These results show a remarkable conformity, though the exceptional October observation of Carpenter and Stebbins indicates the desirability of continuing these studies, particularly in the fall.
On the whole, the available evidence points to the conclusion that night migration differs materially from the kind of daytime migration with which we are generally familiar. Birds are apparently evenly spread throughout the sky, with little tendency to fly in flocks. It must be remembered, however, that only in the case of night migration have objective and truly quantitative studies been made of horizontal distribution. There is a possibility that our impressions of diurnal migration are unduly influenced by the fact that the species accustomed to flying in flocks are the ones that attract the most attention.
These conclusions relate to the uniformity of migration in terms of short distances only, in the immediate vicinity of an observation station. The extent to which they may be applied to broader fronts is a question that may be more appropriately considered later, in connection with continental aspects of the problem.
B. Density As Function Of The Hour Of The Night
There are few aspects of nocturnal migration about which there is less understanding than the matter of when the night flight begins, at what rate it progresses, and for what duration it continues. One would think, however, that this aspect of the problem, above most others, would have been thoroughly explored by some means of objective study. Yet, this is not the case. Indeed, I find not a single paper in the American literature wherein the subject is discussed, although some attention has been given the matter by European ornithologists. Siivonen (1936) recorded in Finland the frequency of call notes of night migrating species of Turdus and from these data plotted a time curve showing a peak near midnight. Bergman (1941) and Putkonen (1942), also in Finland, studied the night flights of certain ducks (Clangula hyemalis and Oidemia fusca and O. nigra) and a goose (Branta bernicla) and likewise demonstrated a peak near midnight. However, these studies were made at northern latitudes and in seasons characterized by evenings of long twilight, with complete darkness limited to a period of short duration around midnight. Van Oordt (1943: 34) states that in many cases migration lasts all night; yet, according to him, most European investigators are of the opinion that, in general, only a part of the night is used, that is, the evening and early morning hours. The consensus of American ornithologists seems to be that migratory birds begin their flights in twilight or soon thereafter and that they remain on the wing until dawn. Where this idea has been challenged at all, the implication seems to have been that the flights are sustained even longer, often being a continuation far into the night of movements begun in the daytime. The telescopic method fails to support either of these latter concepts.