Front matter (continued 2)
Reading edition
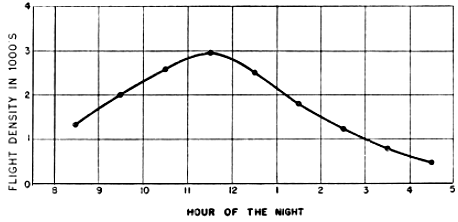
Fig. 26. Average hourly station densities in spring of 1948. This curve represents the arithmetic mean obtained by adding all the station densities for each hour, regardless of date, and dividing the sum by the number of sets of observations at that hour (CST).
The Time Pattern
When the nightly curves of density at the various stations are plotted as a function of time, a salient fact emerges—that the flow of birds is in no instance sustained throughout the night. The majority of the curves rise smoothly from near zero at the time of twilight to a single peak and then decline more or less symmetrically to near the base line before dawn. The high point is reached in or around the eleven to twelve o'clock interval more often than at any other time.
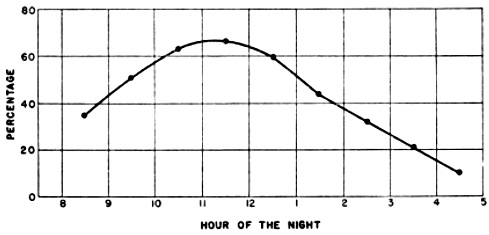
Fig. 27. Hourly station densities plotted as a percentage of peak. The curve is based only on those sets of data where observations were continued long enough to include the nightly peak. In each set of data the station density for each hour has been expressed as a percentage of the peak for the night at the station in question. All percentages for the same hour on all dates have been averaged to obtain the percentile value of the combined station density at each hour (CST).
Figure 26, representing the average hourly densities for all stations on all nights of observation, demonstrates the over-all effect of these tendencies. Here the highest density is reached in the hour before midnight with indications of flights of great magnitude also in the hour preceding and the hour following the peak interval. The curve ascends somewhat more rapidly than it declines, which fact may or may not be significant. Since there is a great disproportion in the total volume of migration at different localities, the thought might be entertained that a few high magnitude stations, such as Tampico and Progreso, have imposed their own characteristics on the final graph. Fortunately, this idea may be tested by subjecting the data to a second treatment. If hourly densities are expressed as a percentage of the nightly peak, each set of observations, regardless of the number of birds involved, carries an equal weight in determining the character of the over-all curve. Figure 27 shows that percentage analysis produces a curve almost identical with the preceding one. To be sure, all of the individual curves do not conform with the composite, either in shape or incidence of peak. The extent of this departure in the latter respect is evident from Figure 28, showing the number of individual nightly station curves reaching a maximum peak in each hour interval. Even this graph demonstrates that maximum densities near midnight represent the typical condition.
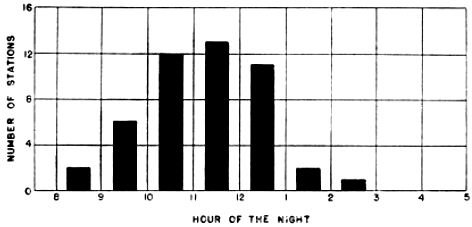
Fig. 28. Incidence of maximum peak at the various hours of the night in 1948. "Number of stations" represents the total for all nights of the numbers of station peaks falling within a given hour.
The remarkable smoothness and consistency of the curves shown in Figures 26 and 27 seem to lead directly to the conclusion that the volume of night migration varies as a function of time. Admittedly other factors are potentially capable of influencing the number of birds passing a given station in a given hour. Among these are weather conditions, ecological patterns, and specific topographical features that might conceivably serve as preferred avenues of flight. However, if any of these considerations were alone responsible for changes in the numbers of birds seen in successive intervals, the distribution of the peak in time could be expected to be haphazard. For example, there is no reason to suppose that the cone of observation would come to lie over favored terrain at precisely the hour between eleven and twelve o'clock at so many widely separated stations. Neither could the topographical hypothesis explain the consistently ascending and descending pattern of the ordinates in Figure 28. This is not to say that other factors are without effect; they no doubt explain the divergencies in the time pattern exhibited by Figure 28. Nevertheless, the underlying circumstances are such that when many sets of data are merged these other influences are subordinated to the rise and fall of an evident time pattern. Stated in concrete terms, the time frequencies shown in the graphs suggest the following conclusions: first, nocturnal migrations are not a continuation of daytime flights; second, nearly all night migrants come to earth well before dawn; and, third, in each hour of the night up until eleven or twelve o'clock there is typically a progressive increase in the number of birds that have taken wing and in each of the hours thereafter there is a gradual decrease. Taken at its face value, the evidence seems to indicate that birds do not begin their night migrations en masse and remain on the wing until dawn and that in all probability most of them utilize less than half of the night.
Interestingly enough, the fact that the plot points in Figure 26 lie nearly in line tempts one to a further conclusion. The curve behaves as an arithmetic progression, indicating that approximately the same number of birds are leaving the ground in each hour interval up to a point and that afterwards approximately the same number are descending within each hour. However, some of the components making up this curve, as later shown, are so aberrant in this regard that serious doubt is cast on the validity of this generalization.
Because the results of these time studies are unexpected and startling, I have sought to explore other alternative explanations and none appears to be tenable. For example, the notion that the varying flight speeds of birds might operate in some way to produce a cumulative effect as the night progresses must be rejected on close analysis. If birds of varying flight speeds are continuously and evenly distributed in space, a continuous and even flow would result all along their line of flight. If they are haphazardly distributed in space, a correspondingly haphazard density pattern would be expected.
Another explanation might be sought in the purely mathematical effects of the method itself. The computational procedure assumes that the effective area of the sample is extremely large when the moon is low, a condition that usually obtains in the early hours of the evening in the days surrounding the full moon. Actually no tests have yet been conducted to ascertain how far away a silhouette of a small bird can be seen as it passes before the moon. Consequently, it is possible that some birds are missed under these conditions and that the effective field of visibility is considerably smaller than the computed field of visibility. The tendency, therefore, may be to minimize the densities in such situations more than is justified. However, in many, if not most, cases, the plotting of the actual number of birds seen, devoid of any mathematical procedures, results in an ascending and descending curve.
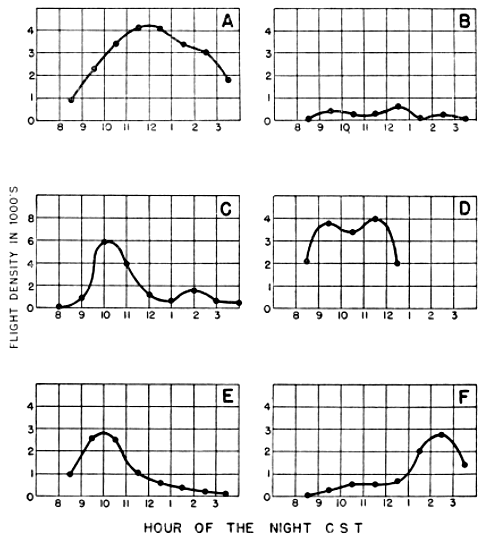
Fig. 29. Various types of density-time curves. (A) Near typical, Ottumwa, April 22-23; (B) random fluctuation, Stillwater, April 23-24; (C) bimodal, Knoxville, April 22-23; (D) sustained peak, Ottumwa, April 21-22; (E) early peak, Oak Grove, May 21-22; (F) late peak, Memphis, April 23-24.
A third hypothesis proposes that all birds take wing at nearly the same time, gradually increase altitude until they reach the mid-point of their night's journey, and then begin a similarly slow descent. Since the field of observation of the telescope is conical, it is assumed that the higher the birds arise into the sky the more they increase their chances of being seen. According to this view, the changes in the density curve represent changes in the opportunity to see birds rather than an increase or decrease in the actual number of migrants in the air. Although measurements of flight altitude at various hours of the night have not been made in sufficient number to subject this idea to direct test, it is hardly worthy of serious consideration. The fallacy in the hypothesis is that the cone of observation itself would be rising with the rising birds so that actually the greatest proportion of birds flying would still be seen when the field of observation is in the supine position of early evening.
It cannot be too strongly emphasized that the over-all time curves just discussed have been derived from a series of individual curves, some of which differ radically from the composite pattern. In Figure 29, six dissimilar types are shown. This variation is not surprising in view of the fact that many other causative factors aside from time operate on the flow of birds from hour to hour. Figure 29A illustrates how closely some individual patterns conform with the average. Figure 29B is an example of a random type of fluctuation with no pronounced time character. It is an effect rarely observed, occurring only in the cases where the number of birds observed is so small that pure chance has a pronounced effect on the computed densities; its vacillations are explicable on that account alone. Errors of sampling may similarly account for some, though not all, of the curves of the bimodal type shown in Figure 29C. Some variation in the curves might be ascribed to the variations in kinds of species comprising the individual flights at different times at different places, provided that it could be demonstrated that different species of birds show dissimilar temporal patterns. The other atypical patterns are not so easily dismissed and will be the subject of inquiry in the discussions that follow. It is significant that in spite of the variety of the curves depicted, which represent every condition encountered, in not a single instance is the density sustained at a high level throughout the night. Moreover, these dissident patterns merge into a remarkably harmonious, almost normal, average curve.
When, at some future date, suitable data are available, it would be highly desirable to study the average monthly time patterns to ascertain to what extent they may deviate from the over-all average. At present this is not justifiable because there are not yet enough sets of data in any two months representing the same selection of stations.
Correlations with Other Data
It is especially interesting to note that the data pertaining to this problem derived from other methods of inquiry fit the conclusions adduced by the telescopic method. Overing (1938), who for several years kept records of birds striking the Washington Monument, stated that the record number of 576 individuals killed on the night of September 12, 1937, all came down between 10:30 P. M. and midnight. His report of the mortality on other nights fails to mention the time factor, but I am recently informed by Frederick C. Lincoln (in litt.) that it is typical for birds to strike the monument in greatest numbers between ten and twelve o'clock at night. At the latter time the lights illuminating the shaft are extinguished, thus resulting in few or no casualties after midnight. The recent report by Spofford (1949) of over 300 birds killed or incapacitated at the Nashville airport on the night of September 9-10, 1948, after flying into the light beam from a ceilometer, is of interest in this connection even though the cause of the fatality is shrouded in mystery. It may be noted, however, that "most of the birds fell in the first hour," which, according to the account, was between 12:30 A. M. and 1:30 A. M. Furthermore, birds killed at the Empire State Building in New York on the night of September 10-11, 1948, began to strike the tower "shortly after midnight" (Pough, 1948). Also it will be recalled that the observations of Stone (loc. cit.), already referred to in this paper (page 410), show a situation where the flight in the early part of the night was negligible but mounted to a peak between ten and eleven o'clock, with continuing activity at least until midnight.
All of these observations are of significance in connection with the conclusions herein advanced, but by far the most striking correlation between these present results and other evidences is found in the highly important work of various European investigators studying the activity of caged migratory birds. This work was recently reviewed and extended by Palmgren (1944) in the most comprehensive treatise on the subject yet published. Palmgren recorded, by an electrically operated apparatus, the seasonal, daily, and hourly activity patterns in caged examples of two typical European migrants, Turdus ericetorum philomelos Brehm and Erithacus rubecula (Linnaeus). Four rather distinct seasonal phases in activity of the birds were discerned: winter non-migratory, spring migratory, summer non-migratory, and autumn migratory. The first of these is distinguished by morning and evening maxima of activity, the latter being better developed but the former being more prolonged. Toward the beginning of migration, these two periods of activity decline somewhat. The second, or spring migratory phase, which is of special interest in connection with the present problem, is characterized by what Palmgren describes as nightly migratory restlessness (Zugunruhe). The morning maximum, when present, is weaker and the evening maximum often disappears altogether. Although variations are described, the migratory restlessness begins ordinarily after a period of sleep ("sleeping pause") in the evening and reaches a maximum and declines before midnight.
This pattern agrees closely with the rhythm of activity indicated by the time curves emerging from the present research. Combining the two studies, we may postulate that most migrants go to sleep for a period following twilight, thereby accounting for the low densities in the early part of the night. On awakening later, they begin to exhibit migratory restlessness. The first hour finds a certain number of birds sufficiently stimulated so that they rise forthwith into the air. In the next hour still others respond to this urge and they too mount into the air. This continues until the "restlessness" begins to abate, after which fewer and fewer birds take wing. By this time, the birds that began to fly early are commencing to descend, and since their place is not being filled by others leaving the ground, the density curve starts its decline. Farner (1947) has called attention to the basic importance of the work by Palmgren and the many experimental problems it suggests. Of particular interest would be studies comparing the activity of caged American migrant species and the nightly variations in the flight rates.
The Baton Rouge Drop-off
As already stated, the present study was initiated at Baton Rouge, Louisiana, in 1945, and from the outset a very peculiar density time pattern was manifest. I soon found that birds virtually disappeared from the sky after midnight. Within an hour after the termination of twilight, the density would start to ascend toward a peak which was usually reached before ten o'clock, and then would begin, surprisingly enough, a rapid decline, reaching a point where the migratory flow was negligible. In Figure 30 the density curves are shown for five nights that demonstrate this characteristically early decline in the volume of migration at this station. Since, in the early stages of the work, coördinates of apparent pathways of all the birds seen were not recorded, I am unable now to ascertain the direction of flight and thereby arrive at a density figure based on the dimension of the cone and the length of the front presented to birds flying in certain directions. It is feasible, nevertheless, to compute what I have termed a "plus or minus" flight density figure stating the rate of passage of birds in terms of the maximum and minimum corrections which all possible directions of flight would impose. In other words, density is here computed, first, as if all the birds were flying perpendicular to the long axis of the ellipse, and, secondly, as if all the birds were flying across the short axis of the ellipse. Since the actual directions of flight were somewhere between these two extremes, the "plus or minus" density figure is highly useful.
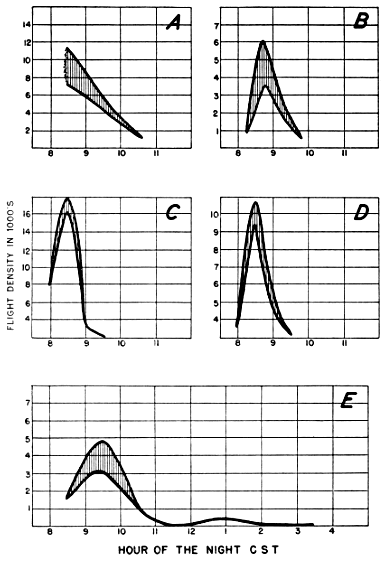
Fig. 30. Density-time curves on various nights at Baton Rouge. (A) April 25, 1945; (B) April 15, 1946; (C) May 10, 1946; (D) May 15, 1946; (E) April 22-23, 1948. These curves are plotted on a "plus or minus" basis as described in the text, with the bottom of the curve representing the minimum density and the top of the curve the maximum.
The well-marked decline before midnight in the migration rates at Baton Rouge may be regarded as one of the outstanding results emerging from this study. Many years of ornithological investigation in this general region failed to suggest even remotely that a situation of this sort obtained. Now, in the light of this new fact, it is possible for the first time to rationalize certain previously incongruous data. Ornithologists in this area long have noted that local storms and cold-front phenomena at night in spring sometimes precipitate great numbers of birds, whereupon the woods are filled the following day with migrants. On other occasions, sudden storms at night have produced no visible results in terms of bird densities the following day. For every situation such as described by Gates (1933) in which hordes of birds were forced down at night by inclement weather, there are just as many instances, even at the height of spring migration, when similar weather conditions yielded no birds on the ground. However, the explanation of these facts is simple; for we discover that storms that produced birds occurred before midnight and those that failed to produce birds occurred after that time (the storm described by Gates occurred between 8:30 and 9:00 P. M.).
The early hour decline in density at Baton Rouge at first did not seem surprising in view of the small amount of land area between this station and the Gulf of Mexico. Since the majority of the birds destined to pass Baton Rouge on a certain night come in general from the area to the south of that place, and since the distances to various points on the coast are slight, we inferred that a three-hour flight from even the more remote points would probably take the bulk of the birds northward past Baton Rouge. In short, the coastal plain would be emptied well before midnight of its migrant bird life, or at least that part of the population destined to migrate on any particular night in question. Although data in quantity are not available from stations on the coastal plain other than Baton Rouge, it may be pointed out that such observations as we do have, from Lafayette and New Orleans, Louisiana, and from Thomasville, Georgia, are in agreement with this hypothesis.
A hundred and seventy miles northward in the Mississippi Valley, at Oak Grove, Louisiana, a somewhat more normal density pattern is manifested. There, in four nights of careful observation, a pronounced early peak resulted on the night of May 21-22 (Figure 29E), but on the other three nights significant densities held up until near twelve o'clock, thereby demonstrating the probable effect of the increased amount of land to the south of the station.
Subsequent studies, revealing the evident existence of an underlying density time pattern, cast serious doubt on the explanations just advanced of the early decline in the volume of migration at Baton Rouge. It has as yet been impossible to reconcile the early drop-off at this station with the idea that birds are still mounting into the air at eleven o'clock, as is implied by the ideal time curves.
C. MIGRATION IN RELATION TO TOPOGRAPHY
To this point we have considered the horizontal distribution of birds in the sky only on a very narrow scale and mainly in terms of the chance element in observations. Various considerations have supported the premise that the spread of nocturnal migration is rather even, at least within restricted spacial limits and short intervals of time. This means that in general the flow of birds from hour to hour at a single station exhibits a smooth continuity. It does not mean that it is a uniform flow in the sense that approximately the same numbers of birds are passing at all hours, or at all localities, or even on all one-mile fronts in the same locality. On the contrary, there is evidence of a pronounced but orderly change through the night in the intensity of the flight, corresponding to a basic and definitely timed cycle of activity. Other influences may interfere with the direct expression of this temporal rhythm as it is exhibited by observations at a particular geographical location. Among these, as we have just seen, is the disposition of the areas that offer suitable resting places for transient birds and hence contribute directly and immediately to the flight overhead. A second possible geographical effect is linked with the question of the tendency of night migrants to follow topographical features.
General Aspects of the Topographical Problem
That many diurnal migrants tend to fly along shorelines, rivers, and mountain ridges is well known, but this fact provides no assurance that night migrants do the same thing. Many of the obvious advantages of specialized routes in daylight, such as feeding opportunities, the lift provided by thermal updrafts, and the possible aid of certain landmarks in navigation, assume less importance after night falls. Therefore, it would not be safe to conclude that all nocturnal migrants operate as do some diurnal migrants. For instance, the passage of great numbers of certain species of birds along the Texas coast in daylight hours cannot be regarded as certain proof that the larger part of the nocturnal flight uses the same route. Neither can we assume that birds follow the Mississippi River at night simply because we frequently find migrants concentrated along its course in the day. Fortunately we shall not need to speculate indefinitely on this problem; for the telescopic method offers a means of study based on what night migrants are doing at night. Two lines of attack may be pursued. First we may compare flight densities obtained when the field of the telescope lies over some outstanding topographical feature, such as a river, with the recorded volume of flight when the cone of observation is directed away from that feature. Secondly, we may inquire how the major flight directions at a certain station are oriented with respect to the terrain. If the flight is concentrated along a river, for instance, the flight density curve should climb upward as the cone of observation swings over the river, regardless of the hour at which it does so. The effect should be most pronounced if the observer were situated on the river bank, so that the cone would eventually come to a position directly along the watercourse. Though in that event birds coming up the river route would be flying across the short axis of an elliptical section of the cone, the fact that the whole field of observation would be in their path should insure their being seen in maximum proportions. If, on the other hand, the telescope were set up some distance away from the river so that the cone merely moved across its course, only a section of the observation field would be interposed on the main flight lane.
The interaction of these possibilities with the activity rhythm should have a variety of effects on the flight density curves. If the cone comes to lie over the favored topographical feature in the hour of greatest migrational activity, the results would be a simple sharp peak of doubtful meaning. However, since the moon rises at a different time each evening, the cone likewise would reach the immediate vicinity of the terrain feature at a different time each night. As a result, the terrain peak would move away from its position of coincidence with the time peak on successive dates, producing first, perhaps, a sustention of peak and later a definitely bimodal curve. Since other hypotheses explain double peaks equally well, their mere existence does not necessarily imply that migrants actually do travel along narrow topographical lanes. Real proof requires that we demonstrate a moving peak, based on properly corrected density computations, corresponding always with the position of the cone over the most favored terrain, and that the flight vectors be consistent with the picture thus engendered.
The Work of Winkenwerder
To date, none of the evidence in favor of the topographical hypothesis completely fills these requirements. Winkenwerder (loc. cit.), in analyzing the results of telescopic counts of birds at Madison and Beloit, Wisconsin, Detroit and Ann Arbor, Michigan, and at Lake Forest, Illinois, between 1898 and 1900, plotted the number of birds seen at fifteen-minute intervals as a function of the time of the night. He believed that the high points in the resulting frequency histograms represented intervals when the field of the telescope was moving over certain topographically determined flight lanes, though he did not specify in all cases just what he assumed the critical physiographic features to be. Especially convincing to him were results obtained at Beloit, where the telescope was situated on the east bank of the Rock River, on the south side of the city. Immediately below Beloit the river turns southwestward and continues in this direction about five miles before turning again to flow in a southeastward course for approximately another five miles. In this setting, on two consecutive nights of observation in May, the number of birds observed increased tremendously in the 2 to 3 A. M. interval, when, according to Winkenwerder's interpretation of the data (he did not make the original observations at Beloit himself), the telescope was pointing directly down the course of the river. This conclusion is weakened, however, by notable inconsistencies. Since the moon rises later each evening, it could not have reached the same position over the Rock River at the same time on both May 12-13 and May 13-14, and therefore, if the peaks in the graph were really due to a greater volume of migration along the watercourse, they should not have so nearly coincided. As a matter of fact the incidence of the peak on May 12-13 should have preceded that of the peak on May 13-14; whereas his figure shows the reverse to have been true. Singularly enough, Winkenwerder recognized this difficulty in his treatment of the data from Madison, Wisconsin. Unable to correlate the peak period with the Madison terrain by the approach used for Beloit, he plotted the observations in terms of hours after moonrise instead of standard time. This procedure was entirely correct; the moon does reach approximately the same position at each hour after its rise on successive nights. The surprising thing is that Winkenwerder did not seem to realize the incompatibility of his two approaches or to realize that he was simply choosing the method to suit the desired results.
Furthermore, as shown in Part I of this paper, the number of birds seen through the telescope often has only an indirect connection with the actual number of birds passing over. My computations reveal that the highest counts of birds at Beloit on May 12-13 were recorded when the moon was at an altitude of only 8° to 15° and, that when appropriate allowance is made for the immense size of the field of observation at this time, the partially corrected flight density for the period is not materially greater than at some other intervals in the night when the telescope was not directed over the course of the Rock River. These allowances do not take the direction factor into consideration. Had the birds been flying at right angles to the short axis of an elliptical section of the cone throughout the night, the flight density in the period Winkenwerder considered the peak would have been about twice as high as in any previous interval. On the other hand, if they had been flying across the long axis at all times, the supposed peak would be decidedly inferior to the flight density at 10 to 11:00 P. M., before the cone came near the river.
Admittedly, these considerations contain a tremendous element of uncertainty. They are of value only because they expose the equal uncertainty in Winkenwerder's basic evidence. Since the coördinates of the birds' apparent pathways at Beloit were given, I at first entertained the hope of computing the flight densities rigorously, by the method herein employed. Unfortunately, Winkenwerder was apparently dealing with telescopes that gave inverted images, and he used a system for recording coördinates so ambiguously described that I am not certain I have deciphered its true meaning. When, however, his birds are plotted according to the instructions as he stated them, the prevailing direction of flight indicated by the projection formula falls close to west-northwest, not along the course of the Rock River, but at direct right angles to it.
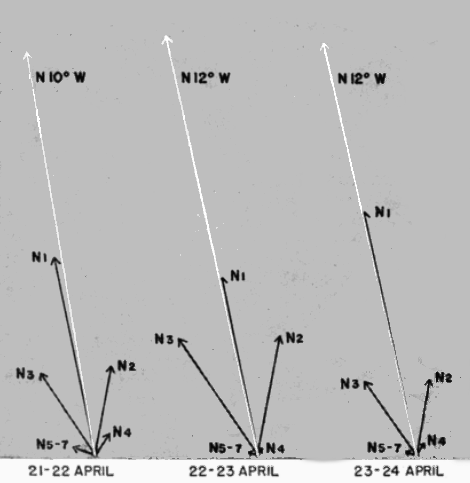
Fig. 31. Directional components in the flight at Tampico on three nights in 1948. The lengths of the sector vectors are determined by their respective densities expressed as a percentage of the station density for that night; the vector resultants are plotted from them by standard procedure. Thus, the nightly diagrams are not on the same scale with respect to the actual number of birds involved.
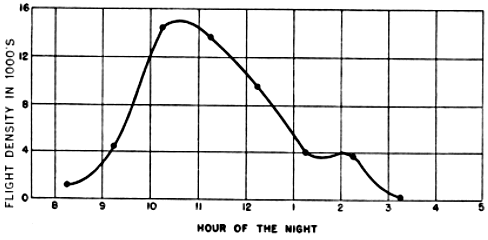
Fig. 32. Hourly station density curve at Tampico, Tamaulipas, on the night of April 21-22, 1948 (CST).
Interpretation of Recent Data
I am in a position to establish more exact correlations between flight density and terrain features in the case of current sets of observations. Some of these data seem at first glance to fit the idea of narrow topographically-oriented flight lanes rather nicely. At Tampico, where six excellent sets of observations were made in March and April, 1948, the telescope was set up on the beach within a few yards of the Gulf of Mexico. As can be seen from Figure 25 (ante), the slant of the coastline at this point is definitely west of north, as is also the general trend of the entire coast from southern Veracruz to southern Tamaulipas (see Figure 34, beyond). The over-all vector resultant of all bird flights at this station was N 11° W, and, as will be seen from Figure 31, none of the nightly vector resultants in April deviates more than one degree from this average. Thus the prevailing direction of flight, as computed, agrees with the trend of the coast at the precise point of the observations, at least to the extent that both are west of north. To be sure, the individual sector vectors indicate that not all birds were following this course; indeed, some appear to have been flying east of north, heading for a landfall in the region of Brownsville, Texas, and a very few to have been traveling northeastward toward the central Gulf coast. But it must be remembered that a certain amount of computational deviation and of localized zigzagging in flight must be anticipated. Perhaps none of these eastward vectors represents an actual extended flight path. The nightly vector resultants, on the other hand, are so consistent that they have the appearance of remarkable accuracy and tempt one to draw close correlations with the terrain. When this is done, it is found that, while the prevailing flight direction is 11° west of north, the exact slant of the coastline at the location of the station is about 30° west of north, a difference of around 19°. It appears, therefore, that the birds were not following the shoreline precisely but cutting a chord about ten miles long across an indentation of the coast. If it be argued that the method of calculation is not accurate enough to make a 19° difference significant, and that most of the birds might have been traveling along the beach after all, it can be pointed out with equal justification that, if this be so, the 11° divergence from north does not mean anything either and that perhaps the majority of the birds were going due north. We are obliged to conclude either that the main avenue of flight paralleled the disposition of the major topographical features only in a general way or that the angle between the line of the coast and true north is not great enough to warrant any inference at all.
Consideration of the Tampico density curves leads to similarly ambiguous results. On the night of April 21-22, as is evident from a comparison of Figures 25 and 32, the highest flight density occurred when the projection of the cone on the terrain was wholly included within the beach. This is very nearly the case on the night of April 23-24 also, the positions of the cone during the peak period of density being only about 16° apart. (On the intervening date, clouds prevented continuous observation during the critical part of the night.) These correlations would seem to be good evidence that most of these night migrants were following the coastline of the Gulf of Mexico. However, the problem is much more complicated. The estimated point of maximum flight density fell at 10:45 P. M. on April 21-22 and 11:00 P. M. on April 23-24, both less than an hour from the peak in the ideal time curve (Figure 26, ante). We cannot be sure, therefore, that the increase in density coinciding with the position of the moon over the beach is not an increase which would have occurred anyway. Observations conducted several nights before or after the second quarter, when the moon is not on or near its zenith at the time of the predictable peak in the density curve, would be of considerable value in the study of this particular problem.
The situation at Tampico has been dealt with at length because, among all the locations for which data are available, it is the one that most strongly supports the topographical hypothesis. In none of the other cases have I been able to find a definite relation between the direction of migration and the features of the terrain. Studies of data from some of these stations disclose directional patterns that vary from night to night only slightly more than does the flight at Tampico. In three nights of observation at Lawrence, Kansas, marked by very high densities, the directional trend was north by north-northeast with a variation of less than 8°, yet Lawrence is so situated that there seems to be no feature of the landscape locally or in the whole of eastern Kansas or of western Missouri that coincides with this heading. At Mansfield, Louisiana, in twelve nights of observation, the strong east by northeast trend varied less than 15°, but again there appears to be no correlation over a wide area between this direction and any landmarks. And, at Progreso, Yucatán, where the vector resultants were 21° and 27° on successive nights, most of the birds seen had left the land and were beginning their flight northward over the trackless waters of the Gulf of Mexico. Furthermore, as I have elsewhere pointed out (1946: 205), the whole northern part of the Yucatán Peninsula itself is a flat terrain, unmarked by rivers, mountains, or any other strong physiographic features that conceivably might be followed by birds.
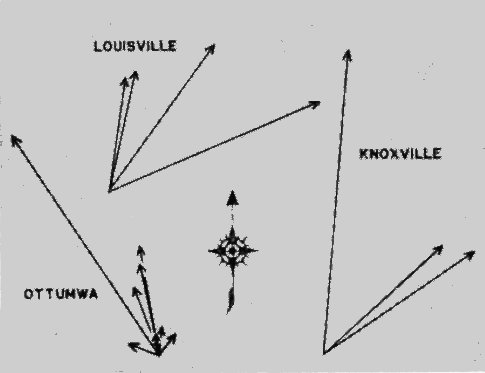
Fig. 33. The nightly net trend of migrations at three stations in 1948. Each arrow is the vector resultant for a particular night, its length expressing the nightly density as a percentage of the total station density for the nights represented. Thus, the various station diagrams are not to the same scale.
In Figure 33 I have shown the directional patterns at certain stations where, unlike the cases noted above, there is considerable change on successive nights. Each vector shown is the vector resultant for one particular night. The lengths of the vectors have been determined by their respective percentages of the total computed density, or total station magnitude, for all the nights in question. In other words, the lengths of the individual vectors denote the percentile rôle that each night played in the total density. From the directional spread at these stations it becomes apparent that if most of the birds were traveling along a certain topographic feature on one night, they could not have been traveling along the same feature on other nights.
The possibility should be borne in mind, however, that there may be more than one potential topographic feature for birds to follow at some stations. Moreover, it is conceivable that certain species might follow one feature that would lead them in the direction of their ultimate goal, whereas other species, wishing to go in an entirely different direction, might follow another feature that would lead them toward their respective destination. It would seem unlikely, however, that the species composition of the nocturnal flights would change materially from night to night, although there is a strong likelihood that it might do so from week to week and certainly from month to month.
By amassing such data as records of flight direction along the same coast from points where the local slant of the shoreline is materially different, and comparisons of the volume of migration at night along specialized routes favored during the day with the flight densities at progressive distances from the critical terrain feature involved, we shall eventually be able to decide definitely the rôle topography plays in bird migration. We cannot say on the basis of the present ambiguous evidence that it is not a factor in determining which way birds fly, but, if I had to hazard a guess one way or the other, I would be inclined to discount the likelihood of its proving a major factor.
D. Geographical Factors and the Continental Density Pattern
A study of the total nightly or seasonal densities at the various stations brings forth some extremely interesting factors, many of which, however, cannot be fully interpreted at this time. A complete picture of the magnitude of migration at a given station cannot be obtained from the number of birds that pass the station on only a few nights in one spring. Many years of study may be required before hard and fast principles are justifiable. Nevertheless, certain salient features stand out in the continental density pattern in the spring of 1948. (The general results are summarized in Tables 2-5; the location of the stations is shown in Figure 34.) These features will be discussed now on a geographical basis.
Table 2.—Extent of Observations and Seasonal Station Densities at Major Stations in 1948
Observation Station Nights of observation Hours of observation Season density
March April May Total March April May Total
Canada
Pt. Pelee 1 1 6 6 2,500
Mexico
S. L. P.: Ebano 1 1 3 3 1,300
Tamps.: Tampico 3 3 6 20 20 40 140,300
Yuc.: Progreso 3 3 18 18 60,500
United States
Fla.: Pensacola 2 2 4 8 7 15 1,500
Winter Park 5 6 11 39 38 77 21,700
Ga.: Athens 2 2 10 10 4,000
Thomasville 1 1 2 8 8 16 4,700
Iowa: Ottumwa 5 5 10 16 28 44 134,400
Kans.: Lawrence 2 1 3 16 4 20 68,700
Ky.: Louisville 3 2 5 20 14 34 49,300
Murray 2 2 13 13 26,200
La.: Baton Rouge 3 3 15 15 11,000
Lafayette 1 1 5 5 2,800
Mansfield 1 5 4 10 2 16 22 40 22,400
New Orleans 1 1 2 5 2 7 1,900
Oak Grove 2 2 4 16 15 31 33,900
Mich.: Albion 1 1 3 3 1,100
Minn.: Hopkins 1 1 4 4 2,000
Miss.: Rosedale 1 1 2 6 8 14 12,600
Mo.: Columbia 2 1 3 8 6 14 13,100
Liberty 1 1 2 7 7 14 4,800
Okla.: Stillwater 1 2 1 4 5 11 3 19 8,400
S. Car.: Charleston 1 1 1 3 5 8 9 22 3,000
Tenn.: Knoxville 2 2 4 18 14 32 35,400
Memphis 2 3 2 7 13 20 12 45 29,700
Tex.: College Station 3 1 4 19 8 27 32,200
Rockport 1 1 4 4 6,200
Table 3.—Average Hourly Station Densities in 1948
Observation Station March April May Season
Canada
Pt. Pelee 400 400
Mexico
S. L. P.: Ebano 400 400
Tamps.: Tampico 700 6,300 3,500
Yuc.: Progreso 2,800 2,800
United States
Fla.: Pensacola 0+ 200 100
Winter Park 300 200 300
Ga.: Athens 400 400
Thomasville 500 100 300
Iowa: Ottumwa 1,700 3,800 3,100
Kans.: Lawrence 4,000 1,400 3,400
Ky.: Louisville 2,000 700 1,500
Murray 2,000 2,000
La.: Baton Rouge 700 700
Lafayette 600 600
Mansfield 0 700 800 600
New Orleans 60 800 300
Oak Grove 1,400 800 1,100
Mich.: Albion 400 400
Minn.: Hopkins 500 500
Miss.: Rosedale 1,100 700 900
Mo.: Columbia 400 1,700 900
Liberty 500 200 300
Okla.: Stillwater 500 200 1,000 400
S. Car.: Charleston 200 200 0+ 100
Tenn.: Knoxville 1,300 800 1,100
Memphis 300 800 900 700
Tex.: College Station 1,100 1,500 1,200
Rockport 1,600 1,600
Table 4.—Maximum Hourly Station Densities in 1948
Observation Station March April May
Canada
Pt. Pelee 1,400
Mexico
S. L. P.: Ebano 600
Tamps.: Tampico 3,100 21,200
Yuc.: Progreso 11,900
United States
Fla.: Pensacola 100 700
Winter Park 2,300 1,000
Ga.: Athens 900
Thomasville 1,500 200
Iowa: Ottumwa 3,800 12,500
Kans.: Lawrence 14,500 2,200
Ky.: Louisville 5,000 1,400
Murray 3,700
La.: Baton Rouge 3,400
Lafayette 1,800
Mansfield 2,100 1,600
New Orleans 200 1,100
Oak Grove 2,700 2,500
Mich.: Albion 700
Minn.: Hopkins 1,100
Miss.: Rosedale 2,200 1,400
Mo.: Columbia 800 3,400
Liberty 800 800
Okla.: Stillwater 900 700 1,400
S. Car.: Charleston 400 600 200
Tenn.: Knoxville 5,800 1,900
Memphis 1,200 3,400 2,100
Tex.: College Station 3,400 3,100
Rockport 2,400
Table 5.—Maximum Nightly Densities at Stations with More Than One Night of Observation
Observation Station March April May
Mexico
Tamps.: Tampico 5,500 63,600
Yuc.: Progreso 31,600
United States
Fla.: Winter Park 6,200
Ga.: Athens 2,600
Thomasville 3,900
Iowa: Ottumwa 15,300 54,600
Kans.: Lawrence 51,600 5,400
Ky.: Louisville 17,000 8,400
Murray 16,400
La.: Baton Rouge 6,200
Mansfield 4,900 5,200
Oak Grove 13,600 5,800
Miss.: Rosedale 6,800 5,800
Mo.: Columbia 1,400 10,300
Okla.: Stillwater 2,700 1,900 3,000
Tenn.: Knoxville 15,200 9,000
Memphis 3,600 7,900 7,000
Tex.: College Station 6,200 13,200
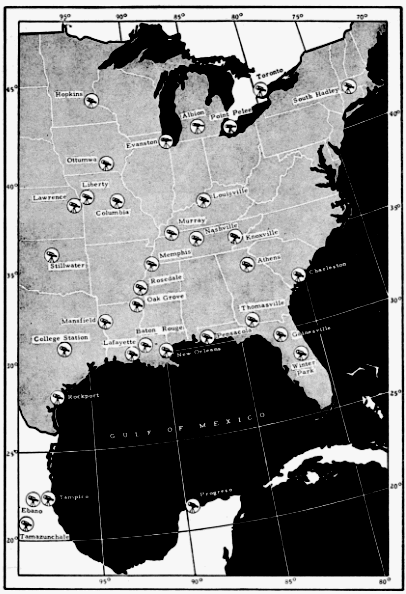
Fig. 34. Stations at which telescopic observations were made in 1948.
Gulf Migration: A Review of the Problem
In view of the controversy in recent years pertaining to migration routes in the region of the Gulf of Mexico (Williams, 1945 and 1947; Lowery, 1945 and 1946), the bearing of the new data on the problem is of especial interest. While recent investigations have lent further support to many of the ideas expressed in my previous papers on the subject, they have suggested alternative explanations in the case of others. In the three years that have elapsed since my last paper dealing with Gulf migration, some confusion seems to have arisen regarding the concepts therein set forth. Therefore, I shall briefly re-state them.
It was my opinion that evidence then available proved conclusively that birds traverse the Gulf frequently and intentionally; that the same evidence suggested trans-Gulf flights of sufficient magnitude to come within the meaning of migration; that great numbers of birds move overland around the eastern and western edges of the Gulf; that it was too early to say whether the coastal or trans-Gulf route was the more important, but that enough birds cross the water from Yucatán to account for transient migration in the extreme lower Mississippi Valley; and, that, in fair weather, most trans-Gulf migrants continue on inland for some distance before coming to land, creating an area of "hiatus" that is usually devoid of transient species. I tried to make it emphatically clear that I realized that many birds come into Texas from Mexico overland, that I did not think the hordes of migrants normally seen on the Texas coast in spring were by any means all trans-Gulf migrants. I stated (1946: 206): "Proving that birds migrate in numbers across the Gulf does not prove that others do not make the journey by the coastal routes. But that is exactly the point. No one has ever pretended that it does." Although some ornithologists seem to have gained the impression that I endorse only the trans-Gulf route, this is far from the truth. I have long held that the migrations overland through eastern Mexico and southern Texas on one hand, and the over-water flights on the other, are each part of the broad movement of transients northward into the United States. There are three avenues of approach by which birds making up the tremendous concentrations on the Texas coast may have reached there: by a continental pathway from a wintering ground in eastern and southern Mexico; by the over-water route from Yucatán and points to the southward; and, finally, by an overland route from Central America via the western edge of the Gulf. As a result of Louisiana State University's four-year study of the avifauna in eastern Mexico, I know that migrants reach Texas from the first source. As a consequence of my studies in Yucatán of nocturnal flight densities and their directional trends, I strongly believe that migrants reach Texas from this second source. As for the third source, I have never expressed an opinion. I am not prepared to do so now, for the reason that today, as three years ago, there is no dependable evidence on which to base a judgment one way or another.
Western Gulf Area
Among the present flight density data bearing on the above issues, are the six sets of observations from the vicinity of Tampico, Tamaulipas, already referred to. These were secured in the spring of 1948 by a telescope set up on the Gulf beach just north of the Miramar pavilion and only a hundred feet from the surf (see Figure 25, ante). The beach here is approximately 400 feet wide and is backed by scrub-covered dunes, which rapidly give way toward the west to a rather dense growth of low shrubs and trees. One might have expected that station densities at Tampico in March would be rather high. Actually, though they are the second highest recorded for the month, they are not impressive and afford a striking contrast with the record flights there in April (Table 6). Unfortunately, only
Table 6.—Computed Hourly Densities at Tampico, Tamps., in Spring of 1948
Date Average hour of observation
8:30 9:30 10:30 11:30 12:30 1:30 2:30 3:30 4:30
22-23 March 600 700 1,000 800 100 100 0 100 ..
23-24 March 0 400 1,200 3,100 800 .. .. .. ..
24-25 March 300 700 800 1,600 1,100 .. .. .. ..
21-22 April 1,100 7,000 14,900 12,900 8,100 3,800 3,500 200 ..
22-23 April 700 2,900 7,500 .. .. .. .. .. ..
23-24 April 600 4,700 19,100 21,200 5,500 5,900 4,000 2,000 200
a few stations were operating in March and thus adequate comparisons are impossible; but the indications are that, in March, migration activity on the western edges of the Gulf is slight. It fails even to approach the volume that may be observed elsewhere at the same time, as for example, in eastern Kansas where, however, the migration is not necessarily correlated with the migration in the lower Gulf area. Strangely enough, on the night of March 22-23, at Tampico, approximately 85 per cent of the birds were flying from north of an east-west line to south of it, opposite to the normal trend of spring migration. This phenomenon, inexplicable in the present instance, will be discussed below. On the other two nights in March, the directional trend at Tampico was northward with few or no aberrant components. Observations made approximately thirty-five miles inland from the Gulf, at Ebano, San Luis Potosí, on the night of March 25-26, show lower station densities than the poorest night at Tampico, but since they cover only a three-hour watch, they reveal little or nothing concerning the breadth of the so-called coastal flyway.
April flight densities at Tampico are the highest recorded in the course of this study. The maximum hourly density of 21,200 birds is 46 per cent higher than the maximum hourly density anywhere else. The average hourly density of 6,300 in April is more than twice as great as the next highest average for that month. These figures would seem to satisfy certain hypotheses regarding a coastwise flight of birds around the western edge of the Gulf. Other aspects of the observations made at that time do not satisfy these hypotheses. Texas ornithologists have found that in periods of heavy spring migration, great numbers of birds are invariably precipitated by rainy weather. On April 23, in the midst of the record-breaking telescopic studies at Tampico, Mr. Robert J. Newman made a daytime census immediately following four hours of rain. He made an intensive search of a small area of brush and low growth back of the beach for traces of North American migrants. In his best hour, only thirteen individual birds out of seventy-five seen were of species that do not breed there. The transient species were the Ruby-throated Hummingbird (1), Scissor-tailed Flycatcher (1), Western Wood Pewee (1), Black-throated Green Warbler (2) Orchard Oriole (7), and Baltimore Oriole (1), all of which winter extensively in southern Mexico. Perhaps, however, the apparent scarcity of transients on this occasion is not surprising in the light of the analysis of flight density in terms of bird density on the ground which I shall develop beyond. My only point here is to demonstrate that rain along the coast does not always produce birds.
As large as the nocturnal flights at Tampico have so far proved to be, they are not commensurate with the idea that nearly all birds follow a narrow coastwise route around the Gulf. To establish the latter idea, one must be prepared to show that the migrant species returning to the United States pass along two flyways a few miles wide in the immense volume necessary to account for their later abundance on a 1500-mile front extending across eastern North America. One might expect at least ten to twenty fold the number observable at any point in the interior of the United States. In actuality, the highest nightly density of 63,600 birds at Tampico is barely sufficient to account for the highest nightly density of 54,600 at Ottumwa, Iowa, alone.
Of course, there is no way of knowing how closely a ratio of anywhere from ten to one through twenty to one, employed in this comparison, expresses the true situation. It may be too high. It could be too low, particularly considering that preliminary studies of flight density in Florida indicate that the western shores of the Gulf of Mexico must carry the major part of the traffic if migratory flights back to the United States in spring take place only along coastwise routes. Consideration of the data obtained in Florida in 1948 will serve to emphasize the point.
Eastern Gulf Area
At Winter Park, Florida, seventy-seven hours were spent at the telescope in April and May. This was 71 per cent more hours of actual observation than at the next highest station. Nevertheless, the total seasonal density amounted to only 21,700 birds. The average hourly density was only 300 birds, with the maximum for any one hour being 2,300 birds. In contrast, forty-five hours of observation at Tampico, Tamaulipas, in March and April, yielded a total station density of 140,300 birds. At the latter place, on the night of April 23-24, almost as many birds passed in a single hour as passed Winter Park in all of its seventy-seven hours of observation.
Should future telescopic studies at Florida stations fail to produce densities appreciably higher than did Winter Park in 1948, the currently-held ideas that the Florida Peninsula is a major flyway will be seriously shaken. But one consideration must be kept in mind regarding the present picture. No observations were made at Winter Park in March, when it is conceivable that densities may have been materially higher. We know, for instance, that many of the early migrants to the southern United States are species whose winter homes are in the West Indies. Numbers of Vireonidae and Parulidae (notably the genera Vireo, Parula, Protonotaria, Mniotilta, Seiurus, Geothlypis, Setophaga, and certain Dendroica and Vermivora) winter extensively in this region and are among the first birds to return to the southern states in the spring. Many of them often reach Louisiana and other states on the Gulf coastal plain by mid-March. In the same connection, it may be mentioned that many of the outstanding instances of birds striking lighthouses in southern Florida occurred in March and early April (Howell, 1932).
Yucatán Area
I have long felt that the answers to many of the questions which beset us in our study of Gulf migration are to be found on the open waters of the Gulf of Mexico itself or on the northern tip of the Yucatán Peninsula. Accordingly, in the spring of 1945 I crossed the Gulf by slow freighter for the purpose of determining how many and what kinds of birds might be seen between the mouth of the Mississippi River and the Yucatán Peninsula in fair weather, when it could not be argued that the birds had been blown there by inclement weather. To my own observations I was able to add those of other ornithologists who likewise had been aboard ship in the Gulf.
The summary of results proved that birds of many species cross the Gulf and do so frequently. It failed to demonstrate beyond all doubt that they do so in large numbers. Nor had I expected it to do so. The consensus of Gulf coast ornithologists seemed to be that transient migration in their respective regions is often performed at too high an elevation to be detected unless the birds are forced to earth by bad weather. I saw no reason to anticipate that the results would be otherwise over the waters of the Gulf of Mexico.
The application of the telescopic method held promise of supplying definite data on the numbers of trans-Gulf migrants, however high their flight levels. The roll and vibration of the ship had prevented me in 1945 from making telescopic observations at sea. Since no immediate solution to the technical difficulties involved presented itself, I undertook to reach one of the small cays in Alacrán Reef, lying seventy-five miles north of Yucatán and in line with the coast of southern Louisiana. Because of transportation difficulties, my plans to place a telescopic station in this strategic location failed. Consequently, I returned in 1948 by freighter to Progreso, Yucatán, where telescopic counts were made for three nights, one of which was rendered almost valueless by the cloud cover.
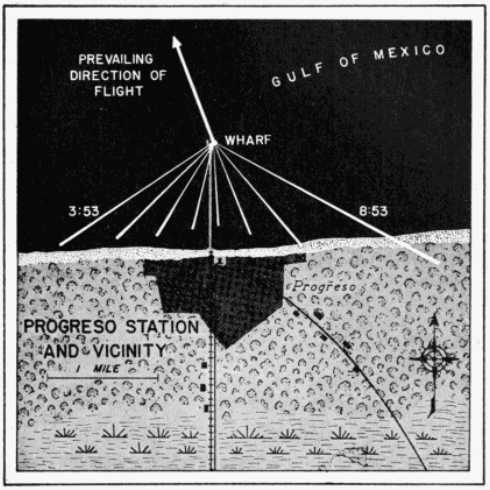
Fig. 35. Positions of the cone of observation at Progreso, Yucatán, on the night of April 23-24, 1948, from 8:53 P. M. to 3:53 A. M. Essential features of this map are drawn to scale. The telescope was set up on the end of a one-mile long wharf that extends northward from the shore over the waters of the Gulf of Mexico. The triangular (white) lines represent the projections of the cone of visibility on the earth at the mid-point of each hour of observation. Only briefly, in the first two hours, did the cone lie even in part over the adjacent mainland. Hence, nearly all of the birds seen in the course of the night had actually left the land behind.
The observation station at Progreso was situated on the northern end of the new wharf which projects northward from the beach to a point one mile over the Gulf. As will be seen from Figure 35, the entire cone of observation lay at nearly all times over the intervening ing water between the telescope on the end of the wharf and the beach. Therefore, nearly all of the birds seen were actually observed leaving the coast and passing out over the open waters of the Gulf. The hourly station densities are shown in Table 7 and Figures 24 and 36. In the seventeen hours of observation on the nights of April 23-24 and April 24-25, a total computed density of 59,200 birds passed within one-half mile of each side of Progreso. This is the third highest density recorded in the course of this study. The maximum for one hour was a computed density of 11,900 birds. This is the fourth highest hourly density recorded in 1948.
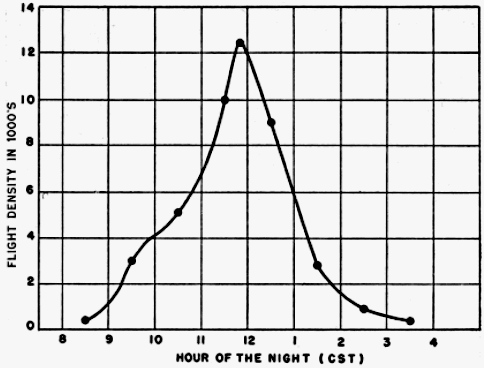
Fig. 36. Hourly station density curve for night of April 23-24, 1948, at Progreso, Yucatán.
Table 7.—Computed Hourly Densities at Progreso, Yuc., in Spring of 1948
Date Average hour of observation
8:30 9:30 10:30 11:30 12:30 1:30 2:30 3:30 4:30
23-24 April 400 3,000 5,100 10,000 9,000 2,800 900 400 ....
24-25 April 0 500 3,700 11,900 7,900 1,900 1,100 400 200
It is not my contention that this many birds leave the northern coast of Yucatán every night in spring. Indeed, further studies may show negligible flight densities on some nights and even greater densities on others. As a matter of fact several hours of observation on the night of April 25-26, at Mérida, Yucatán, approximately twenty-five miles inland from Progreso, indicated that on this night the density overhead was notably low, a condition possibly accounted for by a north wind of 10 mph blowing at 2,000 feet. I merely submit that on the nights of April 23-24 and 24-25, birds were leaving the coast of Yucatán at Progreso at the rate indicated. But, as I have emphasized in this paper and elsewhere (1946: 205-206), the northern part of the Yucatán Peninsula is notably unmarked by streams or any other physiographic features which birds might follow. The uniformity of the topography for many miles on either side of Progreso, if not indeed for the entire breadth of the Peninsula, makes it probable that Progreso is not a particularly favored spot for observing migration, and that it is not the only point along the northern coast of Yucatán where high flight densities can be recorded. This probability must be considered when comparisons are made between Progreso densities and those at Tampico. The argument could be advanced that the present densities from Tampico do not sufficiently exceed those at Progreso to establish the coastal route as the main avenue of traffic in spring, since there is every reason to suspect topography of exerting some influence to produce a channeling effect in eastern Mexico. Here the coast parallels the directional trend of the migratory movement for more than 600 miles. Likewise the Sierra Madre Oriental of eastern Mexico, situated approximately 100 miles inland (sometimes less), lies roughly parallel to the coast. Because of the slant of the Mexican land mass, many winter residents in southern Mexico, by short northward movements, would sooner or later filter into the coastal plain. Once birds are shunted into this lowland area, it would seem unlikely that they would again ascend to the top of the Sierra Madre to the west. In this way the great north-south cordillera of mountains may act as a western barrier to the horizontal dispersion of transients bound for eastern North America. Similarly, the Gulf itself may serve as an eastern barrier; for, as long as migrants may progress northward in the seasonal direction of migration and still remain over land, I believe they would do so.
To put the matter in a slightly different way, the idea of a very narrow flight lane is inherent in the idea of coastwise migration. For, as soon as we begin to visualize flights of great volume over fronts extending back more than fifty miles from the shore line, we are approaching, if indeed we have not already passed, the point where the phenomenon is no longer coastwise in essence, but merely overland (as indeed my own unprocessed, telescopic data for 1949 indicate may be the case). In actuality, those who have reported on the migration along the western edge of the Gulf of Mexico have never estimated the width of the main flight at more than fifty miles and have intimated that under some circumstances it may be as narrow as two miles. No evidence of such restrictions can be discerned in the case of the trans-Gulf flights. If it cannot be said that they may be assumed to be as wide as the Gulf itself, they at least have the potential breadth of the whole 260-mile northern coast of the Yucatán Peninsula. On these premises, to be merely equal in total magnitude, the coastwise flights must exhibit, depending on the particular situation, from five to 130 times the concentrations observable among trans-Gulf migrants. This point seems almost too elementary to mention, but I have yet to find anyone who, in comparing the two situations, takes it into consideration.
Judged in this light, the average hourly density of 2,800 birds at Progreso in April would appear to be indicative of many more migrants on the entire potential front than the 6,300 birds representing the average hourly density for the same month at Tampico.
That the Progreso birds were actually beginning a trans-Gulf flight seems inevitable. The Yucatán Peninsula projects 200 miles or more northward into the vast open expanses of the Gulf of Mexico and the Caribbean Sea, with wide stretches of water on either side. The great majority of the birds were observed after they had proceeded beyond the northern edge of this land mass. Had they later veered either to the east or the west, they would have been obliged to travel several hundred miles before again reaching land, almost as far as the distance straight across the Gulf. Had they turned southward, some individuals should have been detected flying in that direction. As can be seen from Figures 23, 42, and 44, not one bird observed was heading south of east or south of west on either night. No other single piece of evidence so conclusively demonstrates that birds cross the Gulf of Mexico in spring in considerable numbers as do flight density data recorded from Progreso in 1948.
Northern Gulf Area
Unfortunately only a few data on flight density are available from critical localities on the northern shores of the Gulf in spring. As the density curves in Figure 30 demonstrate, several sets of observation, including some phenomenal flights, have been recorded at Baton Rouge. This locality, however, lies sixty-four miles from the closest point on the Gulf coast, and the point due southward on the coast is eighty-four miles distant. Since all of the birds seen at Baton Rouge on any one night may have come from the heavily forested area between Baton Rouge and the coast of the Gulf, we cannot use data from Baton Rouge as certainly representative of incoming trans-Gulf flights. Data from repeated observations at stations on the coast itself are needed to judge the degree of trans-Gulf migration northward. On the few nights of observation at such localities (Cameron and Grand Isle, Louisiana, and Pensacola, Florida), flight densities have been zero or negligible. To be sure, negative results have been obtained at stations in the interior of the United States, and flights of low density have been recorded on occasion at stations where the flight densities are otherwise high. Nevertheless, in view of the volume of migration departing from Progreso, Yucatán, it would appear, upon first consideration, that we should at times record on the coast of Louisiana enough birds arriving in a night of continuous observation to yield a high density figure.
Upon further consideration, however, there are factors mitigating against heavy densities of birds in northern flight on the northern coast of the Gulf. In the first place, presuming the main trans-Gulf flight to originate from northern Yucatán, and that there is a directional fanning to the northward, the birds leave on a 260-mile front, and arrive on a front 400 miles or more wide. Consequently, other factors remaining the same, there would be only approximately half the number of birds on the coast of arrival, at a given time and place, as there was on the coast of departure. Secondly, we may now presume on the basis of the telescopic studies at Progreso, that most migrants leaving northern Yucatán do so in the few hours centering about midnight. The varying speeds of the birds making the 580-mile flight across the Gulf distribute them still more sparsely on the north coast of the Gulf both in time and in space. Also we can see only that segment of the flight, which arrives in that part of a twenty-four hour period when the moon is up. This circumstance further reduces the interceptive potential because the hours after dark, to which the present telescopic studies have been restricted, comprise the period in which the fewest migrants arrive from over the water. To illustrate: it is a mathematical certainty that none of the birds leaving Yucatán in the hours of heaviest flight, before 12 P. M., and flying on a straight course at a speed of approximately 33 mph will reach the northern Gulf coast after nightfall; they arrive in the daytime. It will be useful to devise a technique for employing the sun as a background for telescopic observation of birds, thereby making observations possible on a twenty-four hour basis, so as to test these inferences by objective data.
When a whole night's observation (1949 data not yet processed) at Port Aransas, on the southern coast of Texas, on the great overland route from eastern Mexico, yields in one night in April only seven birds, the recording of no birds at a station near the mouth of the Mississippi River becomes less significant.
As I have previously remarked in this paper, the new data obtained since 1946, when I last wrote on the subject of migration in the region of Gulf of Mexico, requires that I alter materially some of my previously held views. As more and more facts come to light, I may be compelled to alter them still further. For one thing, I have come to doubt seriously the rigidity of the coastal hiatus as I envisioned it in 1945. I believe instead that the scarcity of records of transient migrants on the Gulf coastal plain in fair weather is to a very large extent the result of a wide dispersion of birds in the dense cover that characterizes this general region. I now question if appreciable bird densities on the ground ever materialize anywhere except when the sparseness of suitable habitat for resting or feeding tends to concentrate birds in one place, or when certain meteorological conditions erect a barrier in the path of an oncoming migratory flight, precipitating many birds in one place.
This retrenchment of ideas is a direct consequence of the present study, for time and again, as discussed in the case of Tampico densities, maximal nightly flights have failed to produce a visible abundance of transients on land the following day. A simple example may serve to illustrate why. The highest one-hour density recorded in the course of this study is 21,200 birds. That means that this many birds crossed a line one mile long on the earth's surface and at right angles to the direction of flight. Let us further assume that the average flight speed of all birds comprising this flight was 30 mph. Had the entire flight descended simultaneously, it would have been dispersed over an area one mile wide and thirty miles long, and the precipitated density on the ground would have been only 1.1 birds per acre. Moreover, if as many as ten species had been involved in the flight, this would have meant an average per species of less than one bird per nine acres. This would have failed, of course, to show appreciable concentrations to the observer in the field the following day. If, however, on the other hand, the same flight of 21,200 birds had encountered at one point a weather barrier, such as a cold-front storm, all 21,200 birds might have been precipitated in one place and the field observer would have recorded an "inundation of migrants." This would be especially true if the locality were one with a high percentage of open fields or prairies and if the flight were mainly of woodland dwelling species, or conversely, if the locality were densely forested with few open situations and the flight consisted mainly of open-country birds. As explained on page 389, the density formula may be too conservative in its expression of actual bird densities. Even if the densities computed for birds in the air are only half as high as the actual densities in the air, the corresponding ground density of 2.2 birds per acre that results if all the birds descended simultaneously would hardly be any more impressive than the 1.1 bird per acre.
This consideration is doubtless highly modified by local circumstances, but, in general, it seems to suggest a working hypothesis that provides an explanation for many of the facts that we now have. For example, on the coast of Texas there are great expanses of terrain unattractive to such birds as warblers, vireos, tanagers, and thrushes. The precipitation there by bad weather of even a mediocre nightly flight composed of birds of the kinds mentioned would surely produce an overwhelming concentration of birds in the scattered woods and shrubs.
In spite of all that has been written about the great concentrations of transient migrants on the coast of Texas in spring, I am not convinced that they are of a different order of magnitude than those concentrations that sometimes occur along the cheniers and coastal islands of Louisiana and Mississippi. I have read over and over the highly informative accounts of Professor Williams (loci cit.) and the seasonal summaries by Davis (1936-1940) and Williams (1941-1945). I have conversed at length with Mrs. Jack Hagar, whom I regard as one of the leading authorities on the bird life of the Texas coast, and she has even permitted me access to her voluminous records covering a period of fifteen years residence at Rockport. Finally, I have spent a limited amount of time myself on the Texas coast studying first-hand the situation that obtains there in order that I might be in a position to compare it with what I have learned from observations elsewhere in the region of the Gulf of Mexico, Louisiana, Florida, Yucatán, and eastern Mexico.
Although the concentrations of birds on some days near the mouth of the Mississippi River are almost incalculable, the fact remains that in Texas the densities of transient species on the ground are more consistently high from day to day. The reason for this may be simple. As birds move up daily from Mexico overland, a certain percentage would be destined to come down at all points along the route but so dispersed in the inland forest that they might pass unnoticed. However, that part of the same flight settling down in coastal areas, where trees are scarce, would produce visible concentrations of woodland species. With the advent of a cold-front storm, two diametrically opposite effects of the same meteorological phenomenon would tend to pile up great concentrations of migrants of two classes—the overland and the trans-Gulf flights. During the prepolar-front weather the strong southerly (from the south) and southeasterly winds would tend to displace much of the trans-Gulf segment to the western part of the Gulf. With the shift of the winds to the north and northwest, which always occurs as the front passes, the overland flight still in the air would tend to be banked up against the coast, and the incoming trans-Gulf flight would be confronted with a barrier, resulting in the precipitation of birds on the first available land.
These postulated conditions are duplicated in part in autumn along the Atlantic coast of the eastern United States. There, as a result of the excellent work of Allen and Peterson (1936) and Stone (1937), a similar effect has been demonstrated when northwest winds shove the south-bound flights up against the coast of New Jersey and concentrate large aggregations of migrants there.
Interior of the United States
Attention has been drawn already to the nature of the nightly flights at stations immediately inland from the Gulf coast, where densities decline abruptly well before midnight. I have suggested that this early drop-off is mainly a result of the small amount of terrain south of these stations from which birds may be contributed to a night's flight. At Oak Grove, Louisiana, the flight exhibited a strong directional trend with no significant aberrant components. Therefore, one may infer that a considerable part of the flight was derived from regions to the south of the station.
At Mansfield, Louisiana, thirty-eight hours of observation in April and May resulted in flight densities that are surprisingly low—much lower, in fact, than at Oak Grove. In eleven of the hours of observation no birds at all were seen. A possible explanation for these low densities lies in the fact that eastern Texas and western Louisiana, where, probably, the Mansfield flights originated, is not an especially attractive region to migrants because of the great amount of deforested and second growth pine land. Oak Grove, in contrast, is in the great Tensas-Mississippi River flood plain, characterized by an almost solid stand of deciduous forest extending over thousands of square miles in the lower Mississippi valley.
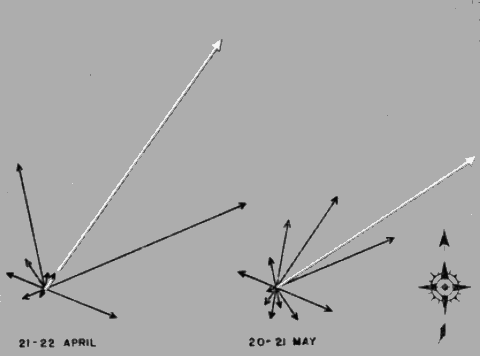
Fig. 37. Sector density representation on two nights at Rosedale, Mississippi, in 1948. The white lines are the vector resultants.
In further contrast to the considerable flight densities and pronounced directional trend at Oak Grove, we have the results from Rosedale, Mississippi, only seventy miles to the north and slightly to the east. At Rosedale the densities were mediocre and the flight directions were extremely divergent. Many of the nights of observation at this locality were seriously interrupted by clouds, but such counts as were made on those dates indicated little migration taking place. On two nights, however, April 21-22 and May 20-21, visibility was almost continuous and densities were moderately high. In Figure 37 I have shown the flight directions for these two nights. The lengths of the individual sector vectors are plotted as a percentage of the total station density for each of the two nights (5,800 and 6,800 birds, respectively). Although the vector resultants show a net movement of birds to the northeast, there are important divergent components of the flights. This "round-the-compass" pattern is characteristic of stations on the edge of meteorological disturbances, as was Rosedale on April 21-22, but not on the night of May 20-21. If bats are presumed to have played a rôle in these latter observations, their random flights would tend to cancel out and the vector resultant would emerge as a graphic representation of the actual net trend density of the birds and its prevailing direction of flow. Although I do not believe that bats are the real reason for the diverse directional patterns at Rosedale, I can offer no alternative explanation consistent with data from other stations.
Moving northward in the valley of the Mississippi and its tributaries, we find a number of stations that yielded significantly high densities on most nights when weather conditions were favorable for migration. Louisville and Murray, Kentucky, and Knoxville, Tennessee, each show several nights with many birds flying, but only Lawrence, Kansas, and Ottumwa, Iowa, had migrations that approach in magnitude the record station densities at Tampico. Indeed, these were the only two stations in the United States that produced flights exceeding the densities at Progreso, Yucatán. The densities at Lawrence are unique in one respect, in that they were extremely high in the month of March. Since there were very few stations in operation then, these high densities would be of little significance were it not for the fact that at no time in the course of this study from 1945 to the present have comparable densities been obtained this early in the migration period. Examination of the "Remarks" section of the original data sheets from Lawrence show frequent mention of "duck-like" birds passing before the moon. We may infer from these notations that a considerable part of the overhead flight was composed of ducks and other aquatic birds that normally leave the southern United States before the main body of transient species reach there. The heavy flight densities at Lawrence may likewise have contained certain Fringillidae, Motacillidae, Sylviidae, and other passerine birds that winter mainly in the southern United States and which are known to begin their return northward in March or even earlier. Observations in 1948 at Lawrence in April were hindered by clouds, and in May no studies were attempted. However, we do have at hand two excellent sets of data recorded at Lawrence on the nights of May 3-4 and May 5-6, 1947, when the density was also extremely high.
At Ottumwa, Iowa, where a splendid cooperative effort on the part of the local ornithologists resulted in forty-four hours of observation in April and May, densities were near the maximum for all stations. Considering this fact along with results at Lawrence and other mid-western stations where cloud cover did not interfere at the critical periods of observation, we have here evidence supporting the generally held thesis that eastern Kansas, Missouri, and Iowa lie on a principal migratory flyway.
Stations in Minnesota, Illinois, Michigan, Massachusetts, and Ontario were either operated for only parts of one or two nights, or else clouds seriously interfered with observations, resulting in discontinuous counts. It may be hoped that future studies will include an adequate representation of stations in these states and that observations will be extensive enough to permit conclusions regarding the density and direction of migration.
Charleston, South Carolina, which does not conveniently fall in any of the geographic regions so far discussed, had, to me, a surprisingly low flight density; twenty-two hours of observation there in March, April, and May yielded a total flight density of only 3,000 birds. This is less, for example, than the number of birds computed to have passed Lawrence, Kansas, in one hour, or to have passed Progreso, Yucatán, in one twenty-minute interval! Possibly observations at Charleston merely chanced to fall on nights of inexplicably low densities; further observations will be required to clear up this uncertainty.
E. Migration And Meteorological Conditions
The belief that winds affect the migration of birds is an old one. The extent to which winds do so, and the precise manner in which they operate, have not until rather recently been the subject of real investigation. With modern advances in aerodynamics and the development of the pressure-pattern system of flying in aviation, attention of ornithologists has been directed anew to the part that air currents may play in the normal migrations of birds. In America, a brief article by Bagg (1948), correlating the observed abundance of migrants in New England with the pressure pattern obtaining at the time, has been supplemented by the unpublished work of Winnifred Smith. Also Landsberg (1948) has pointed out the close correspondence between the routes of certain long-distance migrants and prevailing wind trajectories. All of this is basis for the hypothesis that most birds travel along definite air currents, riding with the wind. Since the flow of the air moves clockwise around a high pressure area and counterclockwise around a low pressure area, the birds are directed away from the "high" and toward the center of the "low." The arrival of birds in a particular area can be predicted from a study of the surrounding meteorological conditions, and the evidence in support of the hypothesis rests mainly upon the success of these predictions in terms of observations in the field.
From some points of view, this hypothesis is an attractive one. It explains how long distances involved in many migrations may be accomplished with a minimum of effort. But the ways in which winds affect migration need analysis on a broader scale than can be made from purely local vantage points. Studies of the problem must be implemented by data accumulated from a study of the process in action, not merely from evidence inferred from the visible results that follow it. Although several hundred stations operating simultaneously would surely yield more definite results, the telescopic observations in 1948 offer a splendid opportunity to test the theory on a continental scale.
The approach employed has been to plot on maps sector vectors and vector resultants that express the directional trends of migration in the eastern United States and the Gulf region, and to compare the data on these maps with data supplied by the U. S. Weather Bureau regarding the directions and velocities of the winds, the location of high and low pressure areas, the movement of cold and warm fronts, and the disposition of isobars or lines of equal pressure. It should be borne in mind when interpreting these vectors that they are intended to represent the directions of flight only at the proximal ends, or junction points, of the arrows. The tendency of the eye to follow a vector to its distal extremity should not be allowed to create the misapprehension that the actual flight is supposed to have continued on in a straight line to the map location occupied by the arrowhead.
A fundamental difficulty in the pressure-pattern theory of migration has no doubt already suggested itself to the reader. The difficulty to which I refer is made clear by asking two questions. How can the birds ever get where they are going if they are dependent upon the whim of the winds? How can pressure-pattern flying be reconciled with the precision birds are supposed to show in returning year after year to the same nesting area? The answer is, in part, that, if the wind is a major controlling influence on the routes birds follow, there must be a rather stable pattern of air currents prevailing from year to year. Such a situation does in fact exist. There are maps showing wind roses at 750 and 1,500 meters above mean sea level during April and May (Stevens, 1933, figs. 13-14, 17-18). Similarly, the "Airway Meteorological Atlas for the United States" (Anonymous, 1941) gives surface wind roses for April (Chart 6) and upper wind roses at 500 and 1,000 meters above mean sea level for the combined months of March, April, and May (Charts 81 and 82). The same publication shows wind resultants at 500 and 1,000 meters above mean sea level (Charts 108 and 109). Further information permitting a description in general terms of conditions prevailing in April and May is found in the "Monthly Weather Review" covering these months (cf. Anonymous, 1948 a, Charts 6 and 8; 1948 b, Charts 6 and 8).
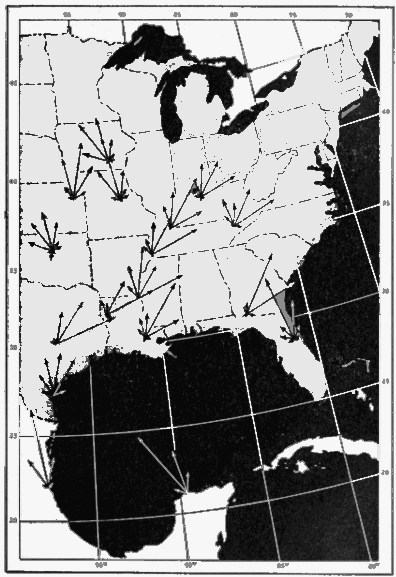
Fig. 38. Over-all sector vectors at major stations in the spring 1948. See text for explanation of system used in determining the length of vectors. For identification of stations, see Figure 34.
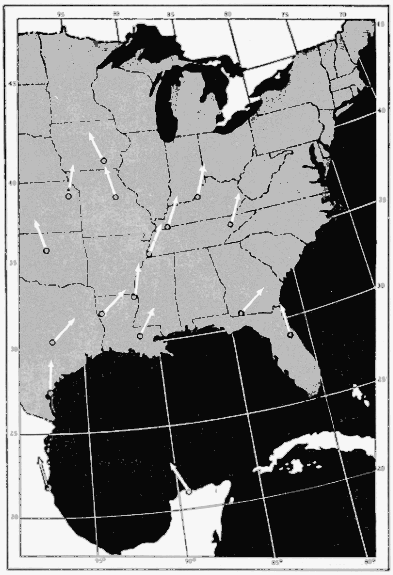
Fig. 39. Over-all net trend of flight directions at stations shown in Figure 38. The arrows indicate direction only and their slants were obtained by vector analysis of the over-all sector densities.
First, however, it is helpful as a starting point to consider the over-all picture created by the flight trends computed from this study. In Figure 38, the individual sector vectors are mapped for the season for all stations with sufficient data. The length of each sector vector is determined as follows: the over-all seasonal density for the station is regarded as 100 percent, and the total for the season of the densities in each individual sector is then expressed as a percentage. The results show the directional spread at each station. In Figure 39, the direction of the over-all vector resultant, obtained from the sector vectors on the preceding map, is plotted to show the net trend at each station.
As is evident from the latter figure, the direction of the net trend at Progreso, Yucatán, is decidedly west of north (N 26° W). At Tampico this trend is west of north (N 11° W), but not nearly so much so as at Progreso. In Texas, Louisiana, Georgia, Tennessee, and Kentucky, it is decidedly east of north. In the upper Mississippi Valley and in the eastern part of the Great Plains, the flow appears to be northward or slightly west of north. At Winter Park, Florida, migration follows in general the slant of the Florida Peninsula, but, the meager data from Thomasville, Georgia, do not indicate a continuation of this trend.
It might appear, on the basis of the foregoing data, that birds migrate along or parallel to the southeast-northwest extension of the land masses of Central America and southern Mexico. This would carry many of them west of the meridian of their ultimate goal, obliging them to turn back eastward along the lines of net trend in the Gulf states and beyond. This curved trajectory is undoubtedly one of the factors—but certainly not the only factor—contributing to the effect known as the "coastal hiatus." The question arises as to whether this northwestward trend in the southern part of the hemisphere is a consequence of birds following the land masses or whether instead it is the result of some other natural cause such as a response to prevailing winds. I am inclined to the opinion that both factors are important. Facts pertinent to this opinion are given below.
In April and May a high pressure area prevails over the region of the Gulf of Mexico. As the season progresses, fewer and fewer cold-front storms reach the Gulf area, and as a result the high pressure area over the Gulf is more stable. Since the winds move clockwise around a "high," this gives a general northwesterly trajectory to the air currents in the vicinity of the Yucatán Peninsula. In the western area of the Gulf, the movement of the air mass is in general only slightly west of north, but in the central Gulf states and lower Mississippi Valley the trend is on the average northeasterly. In the eastern part of the Great Plains, however, the average circulation veers again slightly west of north. The over-all vector resultants of bird migration at stations in 1948, as mapped in Figure 39, correspond closely to this general pattern.
Meteorological data are available for drawing a visual comparison between the weather pattern and the fight pattern on individual nights. I have plotted the directional results of four nights of observation on the Daily Weather Maps for those dates, showing surface conditions (Figures 40, 42, 44 and 46). Each sector vector is drawn in proportion to its percentage of the corresponding nightly station density; hence the vectors at each station are on an independent scale. The vector resultants, distinguished by the large arrowheads, are all assigned the same length, but the nightly and average hourly station densities are tabulated in the legends under each figure. For each map showing the directions of flight, there is on the facing page another map showing the directions of winds aloft at 2,000 and 4,000 feet above mean sea level on the same date (see Figures 41-47). The maps of the wind direction show also the velocities.
Unfortunately, since there is no way of analyzing the sector trends in terms of the elevations of the birds involved, we have no certain way of deciding whether to compare a given trend with the winds at 2,000, 1,000, or 0 feet. Nor do we know exactly what wind corresponds to the average or median flight level, which would otherwise be a good altitude at which to study the net trend or vector resultant. Furthermore, the Daily Weather Map illustrates conditions that obtained at 12:30 A. M. (CST); the winds aloft are based on observations made at 10:00 P. M. (CST); and the data on birds covers in most cases the better part of the whole night. Add to all this the fact that the flight vectors, their resultants, and the wind representations themselves are all approximations, and it becomes apparent that only the roughest sort of correlations are to be expected.
However, as will be seen from a study of the accompanying maps (Figures 40-47), the shifts in wind direction from the surface up to 4,000 feet above sea level are not pronounced in most of the instances at issue, and such variations as do occur are usually in a clockwise direction. All in all, except for regions where frontal activity is occurring, the weather maps give a workable approximation to the average meteorological conditions on a given night.
The maps (Figures 40-47) permit, first, study of the number of instances in which the main trend of flight, as shown by the vector resultant, parallels the direction of wind at a reasonable potential mean flight elevation, and, second, comparison of the larger individual sector vectors and the wind currents at any elevation below the tenable flight ceiling—one mile.
On the whole, inspection of the trend of bird-flight and wind direction on specific nights supports the principle that the flow of migration is in general coincident with the flow of air. It might be argued that when the flow of air is toward the north, and when birds in spring are proceeding normally in that direction, no significance can be attached to the agreement of the two trends. However, the same coincidence of wind directions and bird flights seems to be maintained when the wind currents deviate markedly from a northward trajectory. Figures 46 and 47, particularly in regard to the unusual slants of the flight vectors at Ottumwa, Knoxville, and Memphis, illustrate that this coincidence holds even when the wind is proceeding obliquely eastward or westward. On the night of May 22-23, when a high pressure area prevailed from southern Iowa to the Atlantic coast, and the trajectory of the winds was northward, migration activity at Knoxville and Ottumwa was greatly increased and the flow of birds was again northward in the normal seasonal direction of migration.
Further study of the data shows fairly conclusively that maximum migration activity occurs in the regions of high barometric pressure and that the volume of migration is either low or negligible in regions of low pressure. The passage of a cold-front storm may almost halt migration in spring. This was demonstrated first to me by the telescopic method at Baton Rouge, on April 12, 1946, following a strong cold front that pushed southeastward across the Gulf coastal plain and over the eastern Gulf of Mexico. The winds, as usual, shifted and became strong northerly. On this night, following the shift of the wind, only three birds were seen in seven hours of continuous observation. Three nights later, however, on April 15, when the warm air of the Gulf was again flowing from the south, I saw 104 birds through the telescope in two hours. Apropos of this consideration in the 1948 data are the nights of May 21-22 and 22-23.
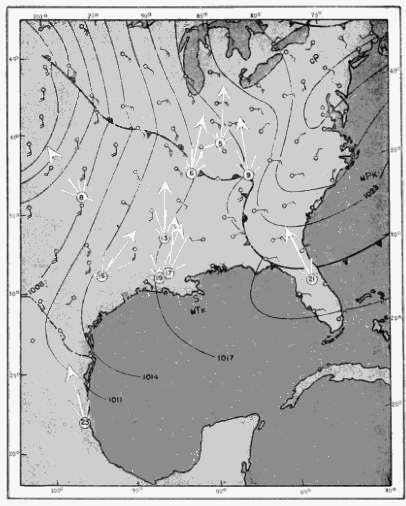
Fig. 40.
Comparison of flight trends and surface weather conditions on April 22-23, 1948. The meteorological data were taken from the U. S. Weather Bureau Daily Weather Map for 12:30 A. M. (CST) on April 23. The nightly station densities and the average hourly station density (shown in parentheses) are as follows:
5. Louisville: 9,100 (1,100) 16. College Station: 13,300 (1,900) 6. Murray: 16,300 (2,700) 17. Baton Rouge: 6,200 (1,000) 8. Stillwater: 1,900 (500) 19. Lafayette: 2,800 (600) 9. Knoxville: 15,200 (1,700) 21. Winter Park: 6,200 (700) 13. Oak Grove: 13,600 (1,700) 23. Tampico: 11,100 (3,700)
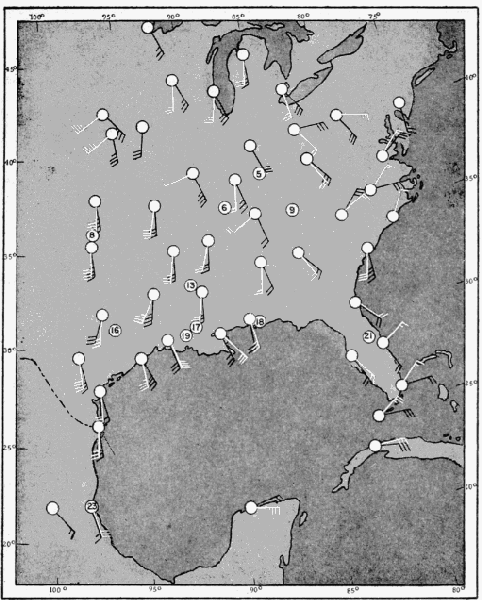
Fig. 41. Winds aloft at 10:00 P. M. on April 22 (CST). Winds at 2,000 feet above mean sea level are shown in black; those at 4,000 feet, in white. Velocities are indicated by standard Beaufort Scale of Wind Force. The numbers in circles refer to the stations shown in Figure 40.
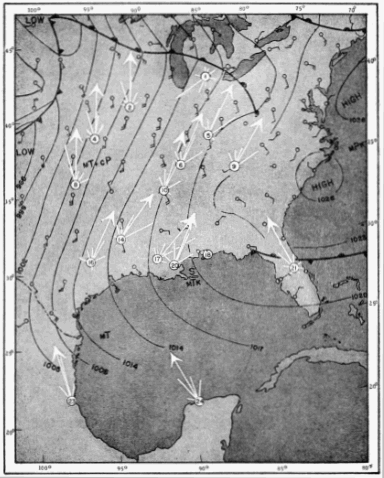
Fig. 42.
Comparison of flight trends and surface weather conditions on April 23-24, 1948. The meteorological data were taken from the U. S. Weather Bureau Daily Weather Map for 12:30 A. M. (CST) on April 24. The nightly station densities and the average hourly station density (shown in parentheses) are as follows:
1. Albion: 1,100 (300) 14. Mansfield: 4,900 (1,200) 2. Ottumwa: 5,500 (900) 16. College Station: 700 (100) 4. Lawrence: 5,400 (1,400) 17. Baton Rouge: 1,700 (400) 5. Louisville: 13,300 (2,700) 18. Pensacola: migration negligible 6. Murray: 9,800 (1,400) 20. New Orleans: 1,600 (800) 8. Stillwater: 800 (100) 21. Winter Park: 2,700 (300) 9. Knoxville: 8,000 (900) 23. Tampico: 63,600 (6,300) 10. Memphis: 7,900 (1,000) 24. Progreso: 31,300 (3,900)
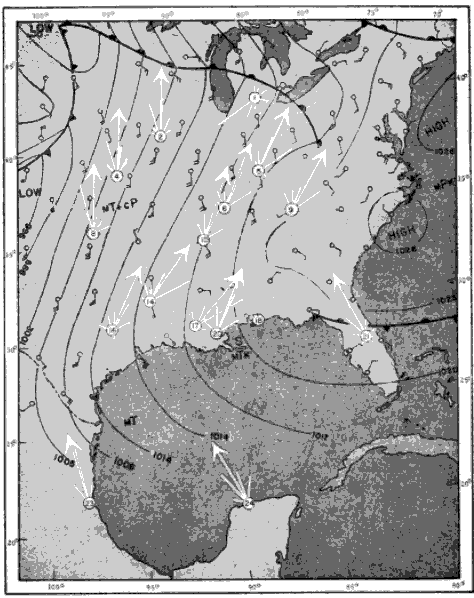
Fig. 43. Winds aloft at 10:00 P. M. on April 23 (CST). Winds at 2,000 feet above mean sea level are shown in black; those at 4,000 feet, in white. Velocities are indicated by standard Beaufort Scale of Wind Force. The numbers in circles refer to the stations shown in Figure 42.
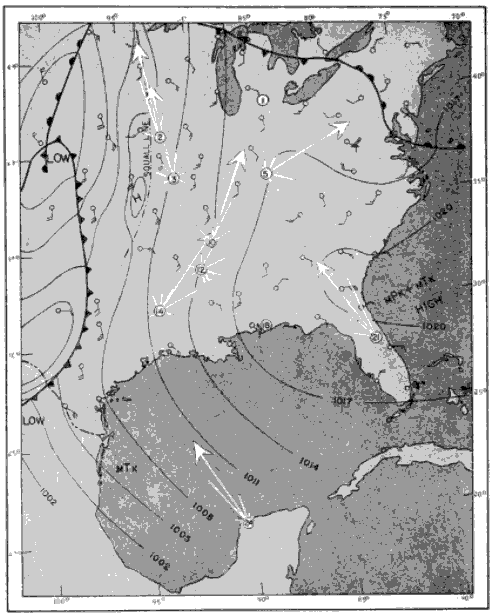
Fig. 44.
Comparison of flight trends and surface weather conditions on April 24-25, 1948. The meteorological data were taken from the U. S. Weather Bureau Daily Weather Map for 12:30 A. M. (CST) on April 25. The nightly station densities and the average hourly station density (shown in parentheses) are as follows:
1. Albion: migration negligible 12. Rosedale: 1,100 (100) 2. Ottumwa: 4,600 (1,500) 14. Mansfield: 1,700 (400) 3. Columbia: 1,400 (400) 18. Pensacola: migration negligible 5. Louisville: 1,700 (200) 21. Winter Park: 600 (100) 10. Memphis: 6,600 (900) 24. Progreso: 27,300 (3,000)
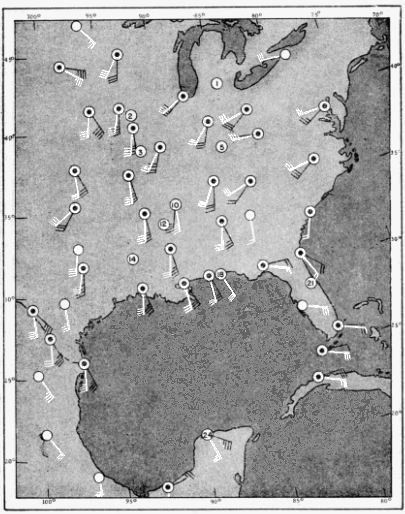
Fig. 45. Winds aloft at 10:00 P. M. on April 24 (CST). Winds at 2,000 feet above mean sea level are shown in black; those at 4,000 feet, in white. Velocities are indicated by standard Beaufort Scale of Wind Force. The numbers in circles refer to the stations shown in Figure 44.
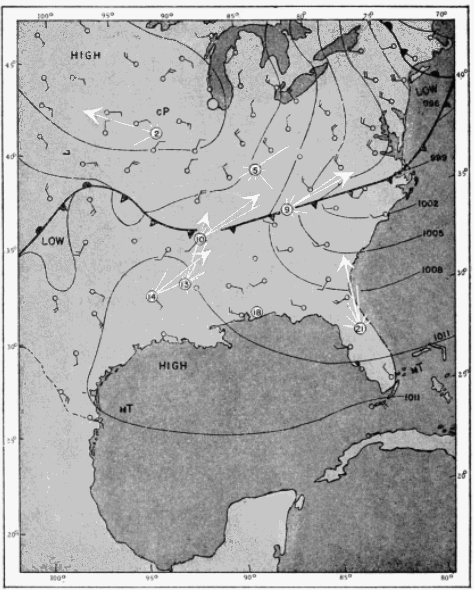
Fig. 46.
Comparison of flight trends and surface weather conditions on May 21-22, 1948. The meteorological data were taken from the U. S. Weather Bureau Daily Weather Map for 12:30 A. M. (CST) on May 22. The nightly station densities and the average hourly station density (shown in parentheses) are as follows:
2. Ottumwa: 6,900 (1,400) 13. Oak Grove: 5,800 (800) 5. Louisville: 1,500 (200) 14. Mansfield: 2,500 (800) 9. Knoxville: 3,200 (500) 18. Pensacola: migration negligible 10. Memphis: 7,000 (1,200) 21. Winter Park: 1,200 (200)
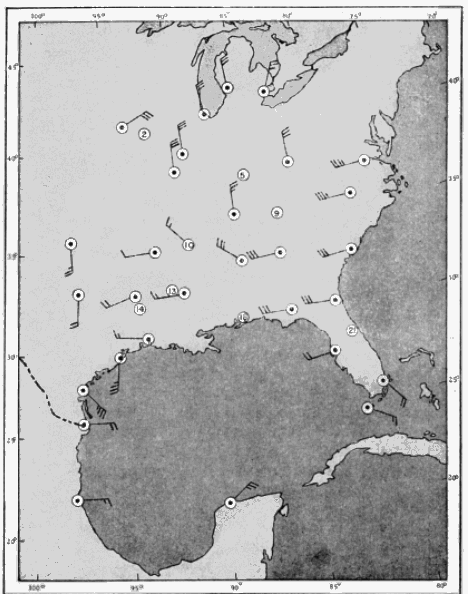
Fig. 47. Winds aloft at 10:00 P. M. on May 21 (CST). Winds at 2,000 feet above mean sea level are shown. Velocities are indicated by standard Beaufort Scale of Wind Force. The numbers in circles refer to the stations shown in Figure 46.
On the first night, following the passage of a cold front, migration at Ottumwa was comparatively low (6,900 birds in five hours). On the following night, when the trajectory of the winds was toward the north, the volume of migration was roughly twice as high (22,300 birds in eight hours). At Louisville, on May 21-22, the nightly station density was only 1,500 birds in seven hours, whereas on the following night, it was 8,400 birds in the same length of time, or about six times greater.
The evidence adduced from the present study gives support to the hypothesis that the continental pattern of spring migration in eastern North America is regulated by the movement of air masses. The clockwise circulation of warm air around an area of high pressure provides, on its western edge, tail winds which are apparently favorable to northward migration. High pressure areas exhibit a centrifugal force outward from the center, which may tend to disperse the migratory flight originating at any given point. In contrast, the circulation of air in the vicinity of a low pressure area is counterclockwise with the force tending to be directed inward toward the center. Since the general movement of the air is from the high pressure area toward a low pressure area, birds starting their migrations with favorable tail winds, are often ultimately carried to a region where conditions are decidedly less favorable. In the vicinity of an area of low pressure the greater turbulence and high wind velocities, combined with the possibly slightly less buoyant property of the air, cause birds to descend. Since low pressure areas in spring generally precede cold fronts, with an attending shift of the wind to the north, an additional barrier to the northward migration of birds is imposed. The extreme manifestation of low pressure conditions and the manner in which they operate against bird flight, are associated with tropical hurricanes. There, the centripetal force of the wind is so great that it appears to draw birds into the "eye" of the hurricane. A classic example of this effect is seen in the case of the birds that came aboard the "West Quechee" when this vessel passed through the "eye" of a hurricane in the Gulf of Mexico in August, 1927. I have already discussed the details of this incident in a previous paper (1946:192). There is also the interesting observation of Mayhew (1949), in which a similar observation was made of large numbers of birds aboard a ship passing through one of these intense low-pressure areas.