REPORT OF CHILDREN’S COURT, 1913 Excerpts from Annual Report Court of Special Sessions of the City of New York For the Year Ending December 31, 1913
Reading edition
The following tables and charts are taken from the annual report of the children’s court for the county of New York.
In the preparation of this report the court officials had the active co-operation of the Committee on Criminal Courts of the Charity Organization Society. With the approval of Frank Smith, the Chief Clerk of the Court of Special Sessions, and under the direction of Lawrence Veiller, Secretary of the Committee, the report was planned and compiled by George Everson, the Assistant Secretary of the Committee.
These statistics, based on a total of 9,019 cases and representing the juvenile delinquency of the entire county, make it possible for us to compare some of the features of juvenile lawlessness on the Middle West Side with corresponding conditions in the larger area. To quote from the report:
“The total number of arraignments in the Court for the year 1913 was 9,019. The statistical tables of this report are based on this large number of cases. Any facts concerning juvenile delinquency in these statistics should be of permanent scientific value because of the fact of the large number of cases involved.
“In the present report an effort has been made to put before the public more detailed information, in the form of statistical tables and charts, than has been done in previous years. These tables, and their illustrative graphics, will show to some extent the detail of the work of the Court and will make available for popular use some of the information which is carefully tabulated for each case that comes into the Court during the year.
“Many pertinent and interesting facts concerning juvenile delinquency are available from the court records. Owing to the limited time at the disposal of the clerical staff for the compilation of statistics from the individual records of the Court, we have heretofore been unable to get as much of the information before the public as we should like to have done. The assistance which we have received from the Committee on Criminal Courts of the Charity Organization Society has made it possible for us to put the statistics in their present form, they having collaborated with our staff, at the expenditure of considerable time and money, for which we are considerably indebted.
“The installation of the probation system, with its very accurate and detailed records of each case investigated by, or placed in charge of probation officers, has put many more facts at our disposal in regard to the family conditions, school and employment records, etc., of children receiving probationary treatment. It has been our purpose to include some of these facts of general and scientific interest in this report.
“Charts and Graphics.—An effort has been made to illustrate the most pertinent facts brought out in the statistical tables by some simple charts and graphics; it is hoped that the reader will get at a glance the gist of the tables so illustrated. In some instances, the charts have been used to supplement the information included in the tables accompanying them.
“Special Proceedings and Juvenile Delinquency Distinguished.—It will be noted that throughout the statistical tables distinction has been made between cases of children arraigned as juvenile delinquents and children arraigned in special proceedings. An explanation of these terms may help the reader. The general distinction, broadly stated, is the same distinction which is generally made between delinquent and dependent children. Special Proceedings, however, include beside improper guardianship cases, so-called, all cases of truancy, ungovernable and disorderly children, and cases of girls in danger of becoming morally depraved. While these latter are considered by the Court as being in need of the care and protection of the State, their offenses often show evidence of grave moral turpitude, and the Court finds them to be among the most difficult cases to handle.
“Whenever, in the case of a child brought before the Court on the charge of juvenile delinquency, it shall appear in the course of the trial that the child is without proper guardianship, or is in unfavorable environment, he or she may be adjudged to be in need of the care and protection of the State, and is then arraigned in Special Proceedings.
“Probation.—Within the last two years great advances have been made in probation in this Court. A complete and well-organized system of probation records has been installed, and the Court has the service of twenty-three probation officers who devote their entire time and energy to the assistance and reformation of children placed in their charge by the Court. The results of their investigations are invaluable to the judge in making his disposition of the cases, and their work in helping the boys and girls to become good citizens is a great service to the community. The only fault which we have to find with the present system is the fact that the period of probation in general is not long enough to allow the probation officer to do his best work with the children under his charge. Table XXX, and its accompanying chart, shows the length of the probation periods; it will be noted that one-quarter of the cases are on probation for a period of two months or under, while 80 per cent of them are for periods of less than six months. It is the opinion of experts that proper probationary treatment can be given only when the child is placed under the officer for sufficient length of time to allow the officer to do really constructive work with the child, so that it will be of lasting influence in his life. If the offense is not sufficiently serious to require a substantial probation period, then it is not of sufficient importance to have the probation officer spend his time with the case. In order to have longer probation periods a larger corps of probation officers will be necessary.
“Truancy.—The report shows that there were 62 cases of violation of the compulsory education law brought into the Court during the year. Investigations of cases by the probation officers have disclosed the appalling prevalence of truancy among juvenile delinquents. Hundreds of cases are on record in the probation rooms showing that children on probation have been habitual truants previous to being brought into the Court on delinquency charges.”
Under the group of cases defined as Special Proceedings is often found the neglected young girl of the accompanying study by Ruth S. True. The columns in the following tables dealing with girls’ cases will throw some light on the charges on which she sometimes gets into court.
TABLE ONE
(Table XVIII.—Residence by Districts of Children Arraigned during 1913.52 Report, pp. 72-73.)
Districts and territory in districts JUVENILE DELINQUENCY
Male Female Total
Number Per cent Number Per cent Number Per cent
I. Below 14th St., East of 4th Ave., Bowery and Catharine St. 1,002 21.0 23 25.2 1,025 21.1
II. Below 14th St., West of 4th Ave., Bowery and Catharine St. 604 12.7 9 9.9 613 12.6
III. East of 6th Ave., from 14th St. to 63d Sta 332 7.0 6 6.6 338 7.0
IV. West of 6th Ave., between 14th St. and 62d St. 499 10.5 10 11.0 509 10.5
V. East of 5th Ave., from 63d St. to 109th St.b 667 14.0 16 17.6 683 14.1
VI. West of Central Park and 8th Ave., from 62d St. to 126th St. 253 5.3 4 4.4 257 5.3
VII. In Manhattan, East of 8th Ave., North of 109th St.c 597 12.5 12 13.2 609 12.5
VIII. West of 8th Ave. between 126th St. and 155th St. 91 1.9 .. .. 91 1.9
IX. West of 8th Ave. and Harlem River North of 155th St. 32 .7 .. .. 32 .7
X. All of The Bronx 529 11.1 8 8.8 537 11.1
Brooklynd 113 2.4 .. .. 113 2.3
All others 29 .6 2 2.2 31 .6
Not stated 15 .3 1 1.1 16 .3
Total 4,763 100.0 91 100.0 4,854 100.0
Districts and territory in districts SPECIAL PROCEEDINGS
Male Female Total
Number Per cent Number Per cent Number Per cent
I. Below 14th St., East of 4th Ave., Bowery and Catharine St. 473 17.8 235 15.5 708 17.0
II. Below 14th St., West of 4th Ave., Bowery and Catharine St. 278 10.4 123 8.1 401 9.6
III. East of 6th Ave., from 14th St. to 63d St.a 192 7.2 152 10.0 344 8.3
IV. West of 6th Ave., between 14th St. and 62d St. 330 12.4 235 15.5 565 13.6
V. East of 5th Ave., from 63d St. to 109th St.b 306 11.6 186 12.3 492 11.8
VI. West of Central Park and 8th Ave., from 62d St. to 126th St. 98 3.7 70 4.7 168 4.0
VII. In Manhattan, East of 8th Ave., North of 109th St.c 257 9.7 161 10.6 418 10.0
VIII. West of 8th Ave. between 126th St. and 155th St. 46 1.8 20 1.3 66 1.6
IX. West of 8th Ave. and Harlem River North of 155th St. 22 .8 13 .9 35 .8
X. All of The Bronx 308 11.7 191 12.6 499 12.0
Brooklynd 36 1.3 13 .9 49 1.2
All others 145 5.5 37 2.4 182 4.4
Not stated 159 6.1 79 5.2 238 5.7
Total 2,650 100.0 1,515 100.0 4,165 100.0
Districts and territory in districts ALL CASES
Male Female Total
Number Per cent Number Per cent Number Per cent
I. Below 14th St., East of 4th Ave., Bowery and Catharine St. 1,475 19.9 258 16.0 1,733 19.2
II. Below 14th St., West of 4th Ave., Bowery and Catharine St. 8.1 401 9.6 882 11.9 132
III. East of 6th Ave., from 14th St. to 63d St.a 524 7.1 158 9.8 682 7.6
IV. West of 6th Ave., between 14th St. and 62d St. 829 11.2 245 15.4 1,074 11.9
V. East of 5th Ave., from 63d St. to 109th St.b 973 13.1 202 12.6 1,175 13.0
VI. West of Central Park and 8th Ave., from 62d St. to 126th St. 351 4.7 74 4.6 425 4.7
VII. In Manhattan, East of 8th Ave., North of 109th St.c 854 11.5 173 10.8 1,027 11.4
VIII. West of 8th Ave. between 126th St. and 155th St. 137 1.9 20 1.2 157 1.8
IX. West of 8th Ave. and Harlem River North of 155th St. 54 .7 13 .8 67 .7
X. All of The Bronx 837 11.3 199 12.4 1,036 11.5
Brooklynd 149 2.1 13 .8 162 1.8
All others 174 2.3 39 2.4 213 2.3
Not stated 174 2.3 80 5.0 254 2.8
Total 7,413 100.0 1,606 100.0 9,019 100.0
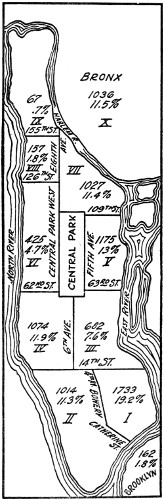
(Chart XIV.—Residence by Districts of Children Arraigned During 1913. Report, p. 74.)
TABLE TWO
(
TABLE IV.
—Nature of Charges.
53
Report, p. 52.)
Charges MALE FEMALE TOTAL
Number Per cent Number Per cent Number Per cent
1. Juvenile delinquency:a
a. Assault 236 5.0 10 11.0 246 5.1
b. Offenses against property 1,212 25.3 25 27.4 1,237 25.4
c. Major offenses against the peace 584 12.3 12 13.2 596 12.3
d. Minor offenses against the peace 2,253 47.3 14 15.4 2,267 46.7
e. Unlawfully employed 312 6.6 18 19.8 330 6.8
f. Violation of corporation ordinances not included above 54 1.1 4 4.4 58 1.2
g. Unclassified 112 2.4 8 8.8 120 2.5
h. Total 4,763 100.0 91 100.0 4,854 100.0
2. Special proceedings:b
a. Improper guardianship 2,199 82.9 1,271 83.9 3,470 83.3
b. Sex offenses 18 .7 135 8.9 153 3.7
c. Ungovernable and disorderly children 376 14.2 104 6.9 480 11.5
d. Truancy 57 2.2 5 .3 62 1.5
e. Total 2,650 100.0 1,515 100.0 4,165 100.0
3. Total, all cases:
a. Juvenile delinquency 4,763 64.3 91 5.7 4,854 53.8
b. Special proceedings 2,650 35.7 1,515 94.3 4,165 46.2
c. Grand total 7,413 100.0 1,606 100.0 9,019 100.0
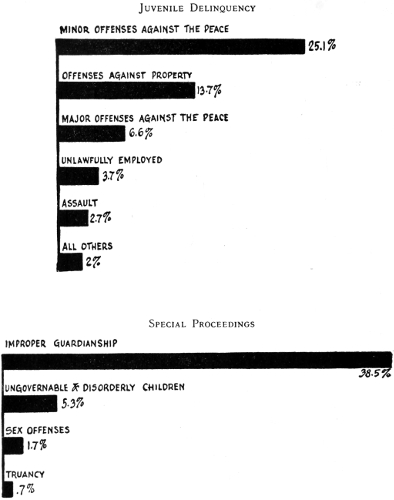
CHART II
(CHART II.—Nature of Charges. Report, p. 53.)
(Percentages shown are of the total number (9,019) of all cases arraigned.)
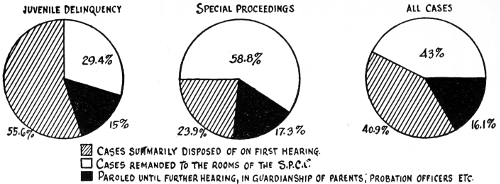
JUVENILE DELINQUENCY SPECIAL PROCEEDINGS ALL CASES
CHART III
(CHART V.—Disposition on First Hearing of all Cases Arraigned During the Year. Report, p. 57.)
TABLE THREE
(
Table IX.
—Disposition on First Hearing of all Cases Arraigned During the Year.
54
Report, p. 57.)
Disposition JUVENILE DELINQUENCY
Male Female Total
Number Per cent Number Per cent Number Per cent
1. Summarily disposed of 2,668 56.0 29 31.9 2,697 55.6
2. Remandeda 1,389 29.2 40 44.0 1,429 29.4
3. Paroledb 706 14.8 22 24.1 728 15.0
4. Total 4,763 100.0 91 100.0 4,854 100.0
Disposition SPECIAL PROCEEDINGS
Male Female Total
Number Per cent Number Per cent Number Per cent
1. Summarily disposed of 669 25.2 325 21.5 994 23.9
2. Remandeda 1,552 58.6 896 59.1 2,448 58.8
3. Paroledb 429 16.2 294 19.4 723 17.3
4. Total 2,650 100.0 1,515 100.0 4,165 100.0
Disposition ALL CASES
Male Female Total
Number Per cent Number Per cent Number Per cent
1. Summarily disposed of 3,337 45.0 354 22.0 3,691 40.9
2. Remandeda 2,941 39.7 936 58.3 3,877 43.0
3. Paroledb 1,135 15.3 316 19.7 1,451 16.1
4. Total 7,413 100.0 1,606 100.0 9,019 100.0
TABLE FOUR
(
Table XII.
—Disposition in Cases of Adjudged Juvenile Delinquents.
55
Report, p. 63.)
Disposition TOTAL
Male Female Total
Number Per cent Number Per cent Number Per cent
Sentence suspended 748 22.8 13 25.0 761 22.8
Placed on probation 1,440 44.2 31 59.6 1,480 44.4
Committed without probation 508 15.5 4 7.7 512 15.4
Fined 575 17.5 4 7.7 579 17.4
Total 3,280 100.0 52 100.0 3,332 100.0
TABLE FIVE
(
Table XIII.
—Disposition in all Cases of Special Proceedings where Complaint was Sustained. Report, p. 64.)
Disposition TOTAL IN ALL CASES
Male Female Total
Number Per cent Number Per cent Number Per cent
Committed to institutions 793 38.8 539 41.8 1,332 39.9
Placed in charge of probation officers 1,253 61.2 751 58.2 2,004 60.1
Total 2,046 100.0 1,290 100.0 3,336 100.0
TABLE SIX
(
Table XVI.
—Ages of all Children Arraigned During the Year.
56
Report, p. 68.)
Ages JUVENILE DELINQUENCY
Male Female Total
Number Per cent Number Per cent Number Per cent
7 years and under 16 .4 .. .. 16 .4
8 and 9 years 236 5.0 7 7.7 243 5.0
10 and 11 years 670 14.1 10 11.0 680 14.0
12 and 13 years 1,515 31.8 29 31.9 1,544 31.8
14 and 15 years 2,322 48.7 44 48.3 2,366 48.7
16 and over (Transferred to other courts) 4 .0 1 1.1 5 .1
Total 4,763 100.0 91 100.0 4,854 100.0
Ages SPECIAL PROCEEDINGS
Male Female Total
Number Per cent Number Per cent Number Per cent
7 years and under 581 21.9 484 32.0 1,065 25.6
8 and 9 years 319 12.0 161 10.6 480 11.5
10 and 11 years 433 16.4 191 12.6 624 15.0
12 and 13 years 625 23.6 265 17.5 890 21.4
14 and 15 years 692 26.1 414 27.3 1,106 26.5
16 and over (Transferred to other courts) .. .. .. .. .. ..
Total 2,650 100.0 1,515 100.0 4,165 100.0
Ages ALL CASES
Male Female Total
Number Per cent Number Per cent Number Per cent
7 years and under 597 8.1 484 30.2 1,081 12.0
8 and 9 years 555 7.5 168 10.5 723 8.1
10 and 11 years 1,103 14.9 201 12.5 1,304 14.5
12 and 13 years 2,140 28.9 294 18.3 2,434 26.9
14 and 15 years 3,014 40.6 458 28.5 3,472 38.5
16 and over (Transferred to other courts) 4 .0 1 .0 5 .0
Total 7,413 100.0 1,606 100.0 9,019 100.0
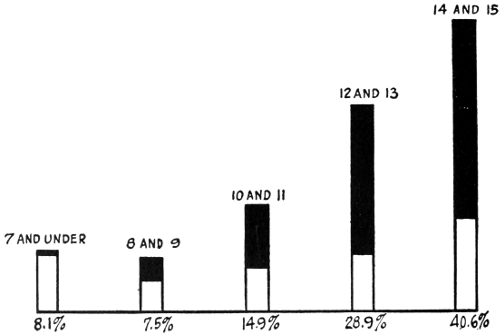
CHART IV
(Chart XI.—Showing Ages of Boys Arraigned During the Year. Report, p. 69.) Total number of boys, 7,413.
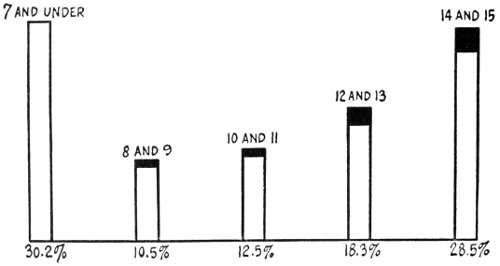
CHART V
(Chart XII.—Showing Ages of Girls Arraigned During the Year. Report, p. 69.) Total number of girls, 1,606.
(Black indicates Juvenile Delinquency. White indicates Special Proceedings.)
TABLE SEVEN
(
Table XIV.
—Single and Group Delinquency.
57
Report, p. 65.)
JUVENILE DELINQUENCY SPECIAL PROCEEDINGS TOTAL ALL CASES
Number Per cent Number Per cent Number Per cent
Number of cases where children were arraigned singly 2,169 44.7 1,937 46.5 4,106 45.5
Number of cases arraigned in groups of two 1,138 23.4 850 20.4 1,988 22.1
Number of cases arraigned in groups of three or more 1,547 31.9 1,378 33.1 2,925 32.4
Total 4,854 100.0 4,165 100.0 9,019 100.0
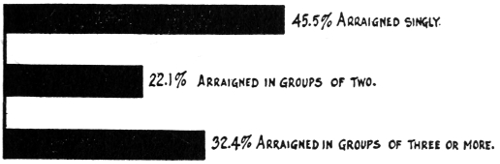
CHART VI
(Chart X.—Single and Group Delinquency. Report, p. 65.)
TABLE EIGHT
(
Table XX.
—Parental Condition of all Children Investigated.
58
Report, p. 78.)
Parental condition JUVENILE DELINQUENCY
Male Female Total
Number Per cent Number Per cent Number Per cent
Father dead 270 16.0 6 14.6 276 15.8
Mother dead 131 7.8 2 4.9 133 7.7
Both parents dead 28 1.6 1 2.4 29 1.8
Parents separated 14 .8 .. .. 14 .8
Deserted by father 44 2.6 2 4.9 46 2.6
Deserted by mother 7 .4 .. .. 7 .4
Deserted by both parents 5 .3 .. .. 5 .2
One or both parents in prison 2 .1 1 2.4 3 .1
One or both parents in other institutions 15 .9 .. .. 15 .9
Mother not in America 6 .3 .. .. 6 .3
Father not in America 3 .1 .. .. 3 .1
Neither parent in America .. .. .. .. .. ..
None of above conditions existing 1,162 68.5 29 70.8 1,191 68.7
Parental condition not reported 10 .6 .. .. 10 .6
Total 1,697 100.0 41 100.0 1,738 100.0
Parental condition SPECIAL PROCEEDINGS
Male Female Total
Number Per cent Number Per cent Number Per cent
Father dead 149 17.6 47 23.1 196 18.7
Mother dead 99 11.7 29 14.4 128 12.3
Both parents dead 19 2.3 8 4.0 27 2.5
Parents separated 17 2.0 .. .. 17 1.6
Deserted by father 25 3.0 2 1.0 27 2.5
Deserted by mother 5 .6 3 1.5 8 .7
Deserted by both parents .. .. 4 1.9 4 .4
One or both parents in prison 4 .5 .. .. 4 .4
One or both parents in other institutions 7 .8 1 .5 8 .7
Mother not in America 6 .7 .. .. 6 .6
Father not in America 1 .1 .. .. 1 .1
Neither parent in America 1 .1 .. .. 1 .1
None of above conditions existing 507 60.0 104 51.1 611 58.5
Parental condition not reported 5 .6 5 2.5 10 .9
Total 845 100.0 203 100.0 1,048 100.0
Parental condition ALL CASES
Male Female Total
Number Per cent Number Per cent Number Per cent
Father dead 419 16.5 53 21.8 472 16.9
Mother dead 230 9.0 31 12.8 261 9.5
Both parents dead 47 1.8 9 3.7 56 2.0
Parents separated 31 1.2 .. .. 31 1.1
Deserted by father 69 2.7 4 1.6 73 2.6
Deserted by mother 12 .5 3 1.2 15 .5
Deserted by both parents 5 .2 4 1.6 9 .3
One or both parents in prison 6 .2 1 .4 7 .3
One or both parents in other institutions 22 .9 1 .4 23 .8
Mother not in America 12 .5 .. .. 12 .4
Father not in America 4 .2 .. .. 4 .1
Neither parent in America 1 .. .. .. 1 ..
None of above conditions existing 1,669 65.7 133 54.5 1,802 64.7
Parental condition not reported 15 .6 5 2.0 20 .8
Total 2.542 100.0 244 100.0 2,786 100.0
Note.—In several cases two conditions are reported in one case.
TABLE NINE
(
Table XV.
—Previous Records.
59
Report, p. 67.)
JUVENILE DELINQUENCY
Male Female Total
Number Per cent Number Per cent Number Per cent
Number arraigned first time 3,528 74.1 90 98.9 3,618 74.5
Number arraigned who had previous court record 1,235 25.9 1 1.1 1,236 25.5
Total 4,763 100.0 91 100.0 4,854 100.0
SPECIAL PROCEEDINGS
Male Female Total
Number Per cent Number Per cent Number Per cent
Number arraigned first time 2,198 82.9 1,461 96.4 3,659 87.9
Number arraigned who had previous court record 452 17.1 54 3.6 506 12.1
Total 2,650 100.0 1,515 100.0 4,165 100.0
ALL CASES
Male Female Total
Number Per cent Number Per cent Number Per cent
Number arraigned first time 5,726 77.2 1,551 96.6 7,277 80.7
Number arraigned who had previous court record 1,687 22.8 55 3.4 1,742 19.3
Total 7,413 100.0 1,606 100.0 9,019 100.0
Note.—The number of children before the court who had previous records was probably slightly in excess of the number shown by the figures.
TABLE TEN
(
Table XVII.
—School and Employment Record of Children Investigated.
60
Report, p. 70.)
JUVENILE DELINQUENCY
Male Female Total
Number Per cent Number Per cent Number Per cent
Children in regular grades 1,124 66.9 26 63.4 1,150 66.8
Children in special classes 75 4.5 .. .. 75 4.4
Children in ungraded classes 19 1.1 .. .. 19 1.1
Children having working papers 339 20.2 6 14.6 345 20.0
Children not in school 98 5.8 9 22.0 107 6.2
Not reported 25 1.5 .. .. 25 1.5
Total 1,680 100.0 41 100.0 1,721 100.0
SPECIAL PROCEEDINGS
Male Female Total
Number Per cent Number Per cent Number Per cent
Children in regular grades 613 73.4 110 55.0 723 69.8
Children in special classes 41 4.9 7 3.5 48 4.6
Children in ungraded classes 11 1.3 2 1.0 13 1.3
Children having working papers 111 13.2 53 26.5 164 15.8
Children not in school 46 5.5 14 7.0 60 5.8
Not reported 14 1.7 14 7.0 28 2.7
Total 836 100.0 200 100.0 1,036 100.0
ALL CASES
Male Female Total
Number Per cent Number Per cent Number Per cent
Children in regular grades 1,737 69.0 136 56.4 1,873 67.9
Children in special classes 116 4.6 7 2.9 123 4.5
Children in ungraded classes 30 1.2 2 .8 32 1.2
Children having working papers 450 17.9 59 24.5 509 18.5
Children not in school 144 5.7 23 9.6 167 6.0
Not reported 39 1.6 14 5.8 53 1.9
Total 2,516 100.0 241 100.0 2,757 100.0
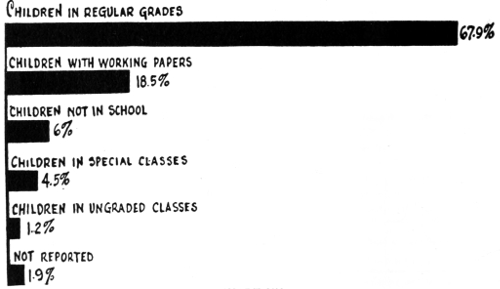
CHART VII
(Chart XIII.—School and Employment Record of Children Investigated. Report, p. 71.)
TABLE ELEVEN
(
Table XXVII.
—General Summary of Probation.
61
Report, p. 84.)
JUVENILE DELINQUENCY SPECIAL PROCEEDINGS ALL CASES
Male Female Total Male Female Total Male Female Total
Number pending on probation Jan. 1, 1913 391 40 431 .. .. .. 391 40 431
Number placed on probation during year 1,386 36 1,422 720 184 904 2,106 220 2,326
Number whose probation terminated during year 1,278 55 1,333 501 117 618 1,779 172 1,951
Number pending Dec. 31, 1913 499 21 520 219 67 286 718 88 806
TABLE TWELVE
(
Table XXVIII.
—Age of Children Placed on Probation during 1913.
62
Report, p. 85.)
Age JUVENILE DELINQUENCY
Male Female Total
Number Per cent Number Per cent Number Per cent
7 Years and under 4 .3 .. .. 4 .3
8 and 9 years 83 5.9 3 8.3 86 6.0
10 and 11 years 206 14.9 5 13.9 211 14.8
12 and 13 years 486 35.2 12 33.3 498 35.0
14 and 15 years 584 42.1 16 44.5 600 42.2
16 years and over 10 .7 .. .. 10 .8
Not stated 13 .9 .. .. 13 .9
Total 1,386 100.0 36 100.0 1,422 100.0
Age SPECIAL PROCEEDINGS
Male Female Total
Number Per cent Number Per cent Number Per cent
7 Years and under 9 1.2 2 1.1 11 1.2
8 and 9 years 58 8.1 6 3.3 64 7.1
10 and 11 years 142 19.7 9 4.8 151 16.7
12 and 13 years 234 32.5 39 21.2 273 30.1
14 and 15 years 269 37.3 126 68.5 395 43.8
16 years and over 1 .2 2 1.1 3 .3
Not stated 7 1.0 .. .. 7 .8
Total 720 100.0 184 100.0 904 100.0
Age ALL CASES
Male Female Total
Number Per cent Number Per cent Number Per cent
7 Years and under 13 .6 2 .9 15 .6
8 and 9 years 141 6.7 9 4.1 150 6.4
10 and 11 years 348 16.5 14 6.4 362 15.6
12 and 13 years 720 34.2 51 23.1 771 33.2
14 and 15 years 853 40.6 142 64.6 995 42.7
16 years and over 11 .5 2 .9 13 .6
Not stated 20 .9 .. .. 20 .9
Total 2,106 100.0 220 100.0 2,326 100.0
TABLE THIRTEEN
(
Table XXX.
—Duration of Probation, Cases Ended During 1913. Report, p. 88.)
Length of probation JUVENILE DELINQUENCY
Male Female Total
Number Per cent Number Per cent Number Per cent
2 months and under 312 25.4 8 33.3 320 25.5
3 months 220 18.0 5 21.0 225 18.0
4 months 288 23.4 8 33.3 296 23.6
5 months 100 15.4 2 8.3 192 15.3
6 months 97 7.9 1 4.1 98 7.8
7 months 43 3.5 .. .. 43 3.4
8 months 34 2.8 .. .. 34 2.7
9 months 19 1.5 .. .. 19 1.5
10 months 14 1.1 .. .. 14 1.1
11 months 5 .4 .. .. 5 .4
12 months and over 8 .6 .. .. 8 .7
Total 1,230 100.0 24 100.0 1,254 100.0
Length of probation SPECIAL PROCEEDINGS
Male Female Total
Number Per cent Number Per cent Number Per cent
2 months and under 169 26.2 38 25.3 207 26.0
3 months 138 21.4 28 18.6 166 20.9
4 months 137 21.2 26 17.3 163 20.5
5 months 64 9.8 10 6.7 74 9.3
6 months 59 9.2 16 10.7 75 9.4
7 months 31 4.8 11 7.4 42 5.3
8 months 15 2.4 5 3.3 20 2.5
9 months 10 1.6 5 3.3 15 1.9
10 months 6 .9 3 2.0 9 1.2
11 months 6 .9 6 4.0 12 1.5
12 months and over 10 1.6 2 1.4 12 1.5
Total 645 100.0 150 100.0 795 100.0
Length of probation ALL CASES
Male Female Total
Number Per cent Number Per cent Number Per cent
2 months and under 481 25.7 46 26.4 527 25.7
3 months 358 19.1 33 19.0 391 19.1
4 months 425 22.7 34 19.4 459 22.4
5 months 254 13.5 12 6.9 266 13.0
6 months 156 8.3 17 9.6 173 8.5
7 months 74 3.9 11 6.4 85 4.1
8 months 49 2.6 5 2.9 54 2.6
9 months 29 1.5 5 2.9 34 1.7
10 months 20 1.1 3 1.8 23 1.1
11 months 11 .6 6 3.5 17 .8
12 months and over 18 1.0 2 1.2 20 1.0
Total 1,875 100.0 174 100.0 2,049 100.0
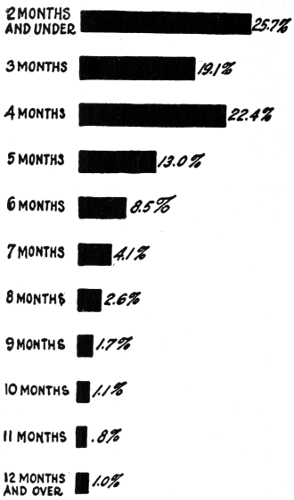
CHART VIII
(Chart XVII.—Duration of Probation. Report, p. 89.)
TABLE FOURTEEN
(
Table XXXI.
—Volume of Business Before Court During 1913. Report, p. 89.)
Month
Number Per cent Number Per cent Number Per cent
January 1,060 11.8 1,337 9.8 2,397 10.6
February 635 7.0 595 4.4 1,230 5.4
March 766 8.5 1,013 7.4 1,779 7.8
April 834 9.3 1,141 8.4 1,975 8.7
May 882 9.8 1,410 10.3 2,292 10.2
June 786 8.7 1,142 8.4 1,928 8.5
July 615 6.8 1,039 7.6 1,654 7.3
August 644 7.1 1,115 8.2 1,759 7.8
September 728 8.1 990 7.3 1,718 7.6
October 786 8.7 1,349 9.9 2,135 9.4
November 694 7.7 1,166 8.5 1,860 8.2
December 589 6.5 1,335 9.8 1,924 8.5
Total 9,019 100.0 13,632 100.0 22,651 100.0
Average number of cases per day .. .. .. .. 75 ..