TESTS OF CREOSOTED TIMBER.
Reading edition
By W. B. Gregory, M. Am. Soc. C. E.
During the last few years a quantity of literature has appeared in which the treatment of timber by preservatives has been discussed. The properties of timber, both treated and untreated, have been determined by the Forest Service, United States Department of Agriculture, and through its researches valuable knowledge has come to engineers who have to deal with the design of wooden structures. There is very little information, however, regarding the effect of time on creosoted timber, and for this reason the results given herewith may prove of interest.
The material tested consisted of southern pine stringers having a cross-section approximately 6 by 16 in. and a length of 30 ft. For the purpose of testing, each beam was cut into two parts, each about 15 ft. long. This material had been in use in a trestle of a railroad near New Orleans for 26 years. The stringers were chosen at random to determine the general condition of the trestle. The timber had been exposed to the weather and subjected to heavy train service from the time it was treated until it was tested. The annual rainfall at New Orleans is about 60 in., and the humidity of the air is high. In spite of these conditions, there was no appearance of decay on any of the specimens tested. The specifications under which the timber was treated were as follows:
Timber.
The timber for creosoting shall be long-leafed or southern pine. Sap surfaces on two or more sides are preferred.
Piles.—The piles shall be of long-leafed or southern pine, not less than 14 in. at the butt. They shall be free from defects impairing their strength, and shall be reasonably straight.
The piles shall be cleanly peeled, no inner skin being left on them. The oil used shall be so-called creosote oil, from London, England, and shall be of a heavy quality.
The treatment will vary according to the dimensions of the timbers and length of time they have been cut. Timbers of large and small dimensions shall not be treated in the same charge, neither shall timbers of differing stages of air seasoning, or the close-grained, be treated in the same charge with coarse or open-grained timbers.
The timbers shall be subjected first to live steam superheated to from 250 to 275° Fahr., and under a 30 to 40-lb. pressure. The live steam shall be admitted into the cylinders through perforated steam pipes, and the temperature shall be obtained by using superheated steam in closed pipes in the cylinders.
The length of time this steaming shall last will depend on the size of the timbers and the length of time they have been cut. In piles and large timbers freshly cut, as long a time as 12 hours may be required. After the steaming is accomplished, the live steam shall be shut off and the superheated steam shall be maintained at a temperature of 160° or more and a vacuum of from 20 to 25 in. shall be held for 4 hours or longer, if the discharge from the pumps indicates the necessity.
Oil Treatment.—The temperature being maintained at 160° Fahr., the cylinders shall be promptly filled with creosote oil at a temperature as high as practicable (about 100° Fahr.). The oil shall be maintained at a pressure ranging from 100 to 120 lb., as experience and measurements must determine the length of time the oil treatment shall continue, so that the required amount of oil may be injected.
After the required amount of oil is injected, the superheated steam shall be shut off, the oil let out, the cylinders promptly opened at each end, and the timber immediately removed from the cylinder.
In the erection of timbers the sap side must be turned up, and framing or cutting of timbers shall not be permitted, if avoidable. All cut surfaces of timbers shall be saturated with hot asphaltum, thinned with creosote oil. The heads of piles when cut shall be promptly coated with the hot asphaltum and oil, even though the cut-off be temporary.
Method of Testing.
The tests were made on a Riehlé 100,000-lb. machine in the Experimental Engineering Laboratory of Tulane University of Louisiana. The machine is provided with a cast-iron beam for cross-bending tests. The distance between supports was 12 ft. The method of support was as follows: Each end of the beam was provided with a steel roller which rested on the cast-iron beam of the testing machine, while above the roller, and, directly under the beam tested, there was a steel plate 6 by 8 in. in area and 1 in. thick. The area was sufficiently great to distribute the load and prevent the shearing of the fibers of the wood. The head of the Riehlé machine is 10 in. wide. A plate, 3/8 in. thick, 6 in. wide and 18 in. long, was placed between the head of the machine and the beam tested.
Fig. 1.—DEFLECTON CURVES BEAM I
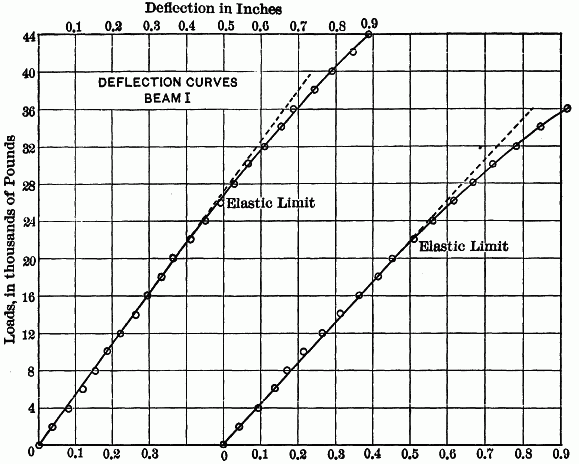
Fig. 2.—DEFLECTON CURVES BEAM II
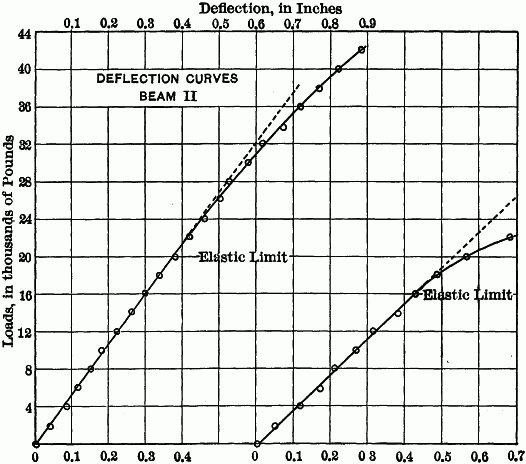
TABLE 1.—Summary of Results of Transverse Tests of Beams at Tulane University, February 10th to March 2d, 1909.
Number of beam. Top or butt of log. b h I Loads: S = Plc/4I d, Inches. E Weight, in pounds per cubic foot. Remarks.
Width, in inches. Height, in inches. I = bh3/12 Actual at elastic limit. Maximum. At elastic limit. Maximum. At elastic limit. E = Pl3/48dI
I B 6.28 15.94 2,120 22,000 45,900 2,975 6,200 0.41 1,575,000 50.2 Close-grained pine, long-leaf.
I T 6.00 15.69 1,934 20,000 38,000 2,915 5,540 0.465 1,383,000 47.5
II[A] T 6.37 15.81 2,098 20,000 43,450 2,722 5,918 0.380 1,562,000 40.5 Coarse loblolly, large knots.
II B 6.41 16.41 2,360 16,000 25,040 1,999 3,130 0.430 979,000 42.2
III T 5.88 15.68 1,871 24,000 45,130 3,608 6,785 0.535 1,489,000 40.4 Close-grained, long-leaf no knots.
III B 5.88 15.90 1,965 21,000 35,190 3,054 5,120 0.515 1,288,000 44.2
IV T 6.00 15.43 1,835 22,000 38,425 3,320 5,810 0.465 1,601,000 40.8 Loblolly, with knots.
IV B 6.12 15.87 2,032 22,000 35,500 3,090 4,983 0.660 1,017,000 41.5
V B 6.00 16.00 2,048 22,000 47,000 3,090 6,610 0.400 1,670,000 47.2 Long-leaf yellow pine.
V[A] T 6.00 15.87 1,999 14,000 22,050 1,998 3,145 0.315 1,382,000 42.1
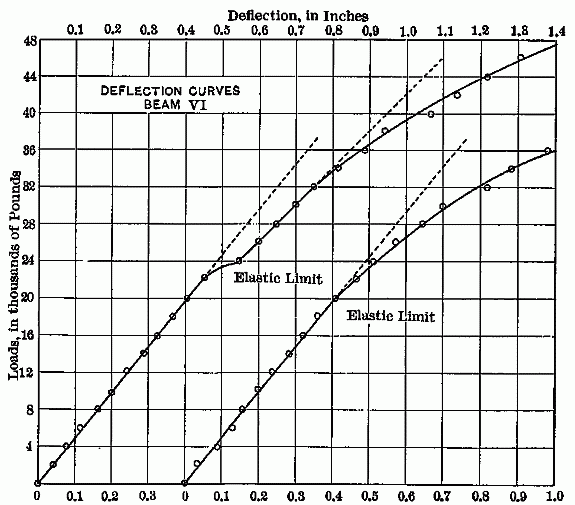
VI[A] B 5.50 15.75 1,790 22,000 51,330 3,484 8,925 0.450 1,695,000 50.2 Long-leaf yellow pine.
VI[A] T 5.87 15.62 1,865 20,000 44,000 3,013 6,627 0.410 1,625,000 45.2
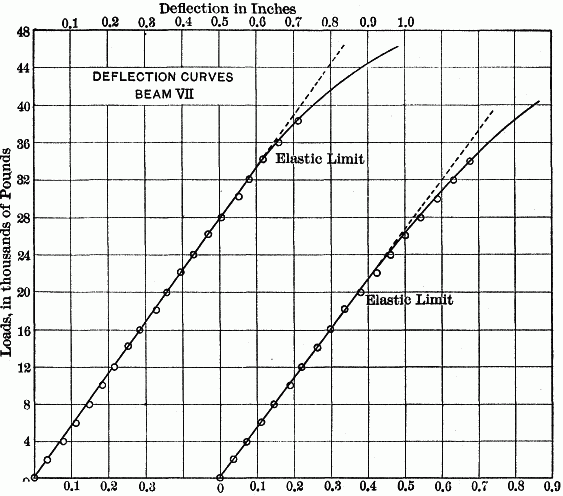
VII B 6.56 15.62 2,083 34,000 51,900 4,580 6,985 0.620 1,637,000 43.7 Long-leaf yellow pine.
VII[A] T 6.22 15.62 1,975 20,000 49,000 2,845 6,970 0.380 1,658,000 40.2
The deflection was measured on both sides of each beam by using silk threads stretched on each side from nails driven about 2 in. above the bottom of the beam and directly over the rollers which formed the supports. From a small piece of wood, tacked to the bottom of the beam at its center and projecting at the sides, the distance to these threads was measured. These measurements were taken to the nearest hundredth of an inch. The mean of the deflections was taken as the true deflection for any load.
Fig. 3.—DEFLECTON CURVES BEAM III
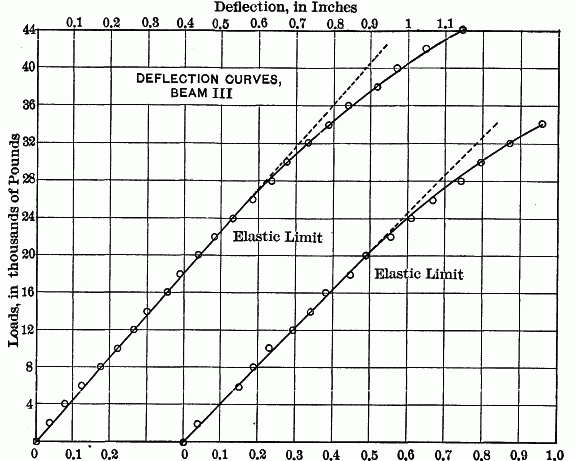
Fig. 4.—DEFLECTON CURVES BEAM IV
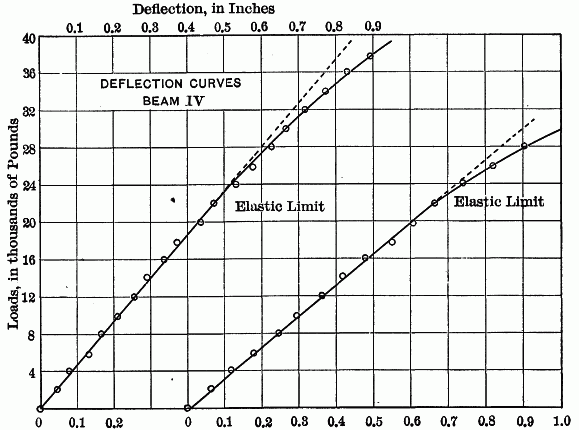
In computing the various quantities shown in Table 1, the summary of results, the load has been assumed as concentrated at the center of the beam. While it is true that the load was spread over a length of about 12 in., due to the width of the head of the machine and the plate between it and the beam tested, it is also true that there were irregularities, such as bolt-holes and, in some cases, abrasions due to wear, that could not well be taken into account. Hence, it was deemed sufficiently accurate to consider the load as concentrated. Besides the horizontal bolt-holes, shown in the photographs, there were vertical bolt-holes, at intervals in all the beams. The latter were 7/8 in. in diameter, and in every case they were sufficiently removed from the center of the length of the beam to allow the maximum moment at the reduced section to be relatively less than that at the center of the beam. For this reason, no correction was made for these holes. The broken beams often showed that rupture started at, or was influenced by, some of the holes, especially the horizontal ones.
While some of the heavy oils of a tarry consistency remained, they were only to be found in the sappy portions of the long-leaf pine and in the loblolly (Specimens II and IV). Exposure in a semi-tropical climate for 26 years had resulted in the removal of the more volatile portions of the creosote oil. The penetration of the oil into the sap wood seemed to be perfect, while in the loblolly it varied from a fraction of an inch to 1-1/2 in. In the heart wood there was very little penetration across the grain. The timber had been framed and the holes bored before treatment. The penetration of the creosote along the grain from the holes was often from 4 to 6 in.
Circular 39 of the Forest Service, U. S. Department of Agriculture, entitled "Experiments on the Strength of Treated Timber," gives the results of a great many tests of creosoted ties, principally loblolly pine, from which the following conclusions are quoted:
"(1) A high degree of steaming is injurious to wood. The degree of steaming at which pronounced harm results will depend upon the quality of the wood and its degree of seasoning, and upon the pressure (temperature) of steam and the duration of its application. For loblolly pine the limit of safety is certainly 30 pounds for 4 hours, or 20 pounds for 6 hours." [Tables 3, 6, and 7.]
"(2) The presence of zinc chlorid will not weaken wood under static loading, although the indications are that the wood becomes brittle under impact." [Tables 3 and 4.]
Fig. 5.—DEFLECTON CURVES BEAM V
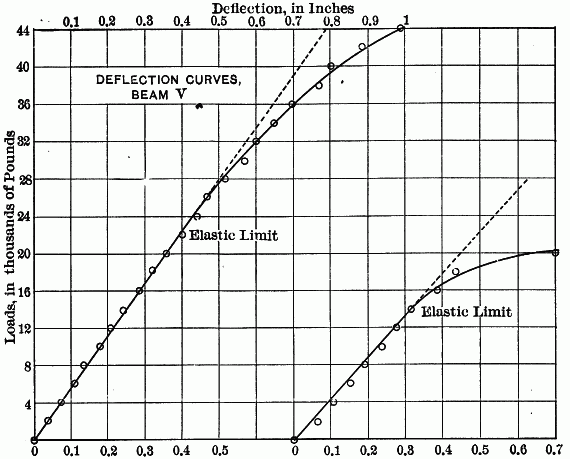
Fig. 6.—DEFLECTON CURVES BEAM VI
"(3) The presence of creosote will not weaken wood of itself. Since apparently it is present only in the openings of the cells, and does not get into the cell walls, its action can only be to retard the seasoning of the wood." [Tables 3, 4, 5, and 6.]
Fig. 7.—DEFLECTON CURVES BEAM VII
Comparisons.
A comparison of the results obtained with tests made on untreated timber is interesting, and to this end Tables 2 and 3, from Circular 115, Forest Service, U.S. Department of Agriculture, by W. Kendrick Hatt, Assoc. M. Am. Soc. C. E., are quoted. The tests made by the writer were from timber raised in Louisiana and Mississippi, while the tests quoted were from timber raised farther north. The number of tests was not sufficient to settle questions of average strength or other qualities. It will be seen, however, that the treated timber 26 years old compares favorably with the new untreated timber.
Plate I, Fig. 1.—Specimen in Testing Machine, Showing Method of Support.
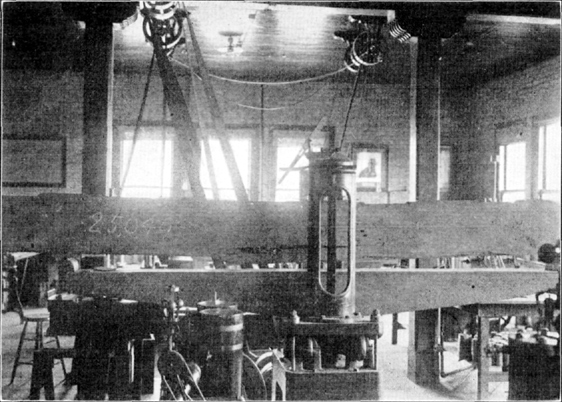
Plate I, Fig. 2.—End Views of Tested Timbers.
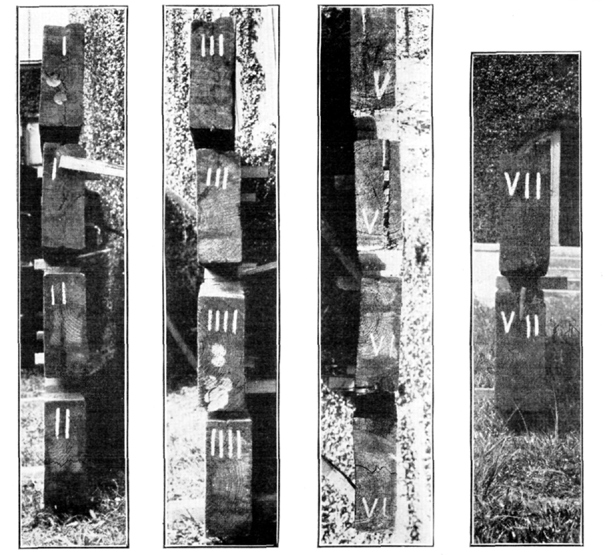
TABLE 2.—Bending Strength of Large Sticks.
Loblolly Pine.
Reference number. Locality of Growth. Dimensions. Grade. Condition of seasoning. Number of tests. Moisture, per cent. Rings per inch. Specific gravity, dry. Weight per Cubic Foot, in Pounds. Fiber stress at elastic limit, in pounds per square inch. Modulus of rupture, in pounds per square inch. Modulus of elasticity, in thousands of pounds per square inch. Elastic resilience, in inch pounds per cubic inch. Number failing by longi- tudinal shear. Remarks.
Section, in inches. Span, in feet As tested. Oven dry.
1 South Carolina. 6 by 7 6 by 10 4 by 12 6 by 16 8 by 14 8 by 16 10 to 15.5 Square edge Green Average 42 48.0 5.7 0.50 46.2 31.2 3,150 5,580 1,426 0.45 7 Moisture above saturation point in all cases.
Maximum 92.1 11.7 0.60 56.8 37.5 5,210 8,460 1,920 0.99
Minimum 30.2 2.3 0.40 35.6 25.0 1,675 3,120 905 0.07
2 South Carolina. 6 by 7 4 by 12 6 by 10 6 by 16 8 by 16 10 by 16 10 to 16 Square edge Partially air dry. Average 18 27.7 5.0 0.50 40.0 31.2 3,380 5,650 1,435 0.45 0 Moisture from 25 to 30 per cent.
Maximum 29.2 8.2 0.55 43.7 34.4 4,610 8,090 1,880 0.76
Minimum 25.5 2.5 0.45 35.6 28.1 2,115 3,600 1,152 0.20
3 South Carolina. 6 by 7 4 by 12 6 by 10 6 by 16 10 to 15 Square edge Partially air dry. Average 19 21.0 5.6 0.50 37.5 31.2 2,970 5,690 1,340 0.39 2 Moisture less than 25 per cent.
Maximum 24.9 17.2 0.58 45.6 36.2 4,850 8,100 2,040 0.69
Minimum 15.0 2.7 0.41 31.2 25.6 1,730 2,910 906 0.10
4 Virginia. 8 by 8 6 to 16 Square edge Partially air dry. Average 12 22.4 4.8 0.46 35.6 28.8 3,260 5,180 1,180 0.51 0
Maximum 27.7 8.8 0.58 43.1 36.2 5,300 8,950 1,728 1.05
Minimum 17.8 2.5 0.37 30.0 23.1 1,280 2,180 606 0.13
5 Virginia. 8 by 8 6 to 15.5 Square edge Green Average 17 64.0 3.0 0.43 43.7 26.9 1,935 3,490 744 0.31 0 Very rapid growth; poor quality.
Maximum 100.5 4.0 0.51 51.9 31.9 3,185 4,720 1,193 0.78
Minimum 38.8 2.5 0.35 35.0 21.9 956 2,180 357 0.12
Long-Leaf Pine.
6 South Carolina. 6 by 8 10 by 16 15 Merchantable Partially air dry Average 25.0 13.7 0.58 45.6 36.2 3,800 7,160 1,560 0.53 9
Maximum 22 40.3 25.4 0.76 60.0 47.5 4,970 10,020 2,010 0.78
Minimum 17.3 6.2 0.50 39.4 31.2 2,220 5,450 1,190 0.21
7 Georgia. 10 by 12 15 Merchantable Partially air dry. Average 27.3 18.0 0.69 54.7 42.9 5,581 8,384 1,820 6 Excellent merchantable grade.
Maximum 22 34.5 29.0 0.79 49.4 9,600 11,410 2,920
Minimum 20.0 11.0 0.50 31.4 3,547 4,836 1,167
TABLE 3.—Loblolly Pine.— Bending Tests on Beams Seasoned Under Different Conditions. (8 by 16-in. section; 13-1/2 to 15-ft. span.)
Number of tests. Fiber stress at elastic limit, in pounds per square inch. Modulus of rupture, in pounds per square inch. Longitudinal shear at maximum load, in pounds per square inch. Modulus of elasticity, in thousands of pounds per square inch. Percentage of moisture. Rings per inch. Weight per cubic foot, oven dry, in pounds. Condition of seasoning.
Average 4 3,580 5,480 3644 1,780 23.2 9.4 33.7 Air dry, 3-1/2 months in the open.
Maximum 4,070 6,600 440 1,987 24.3 11.5 34.5
Minimum 3,090 5,000 327 1,530 21.5 8.0 32.5
Average 5 4,512 5,060 3383 1,685 20 7.7 33.9 Kiln dry, 6 days.
Maximum 5,840 7,320 488 1,790 22 10.2 38.0
Minimum 3,180 2,150 143 1,410 18 4.7 27.7
Average 12 4,331 6,721 4939 1,688 7.7 Air dry, 21 months under shelter.
Maximum 4,990 8,560 620 2,002 9.5
Minimum 3,110 5,160 380 1,398 5.5
Note.—Figures written as subscripts to the figures for longitudinal shear indicate the number of sticks failing in that manner.
Plate II.—Side Views of Tested Timbers.
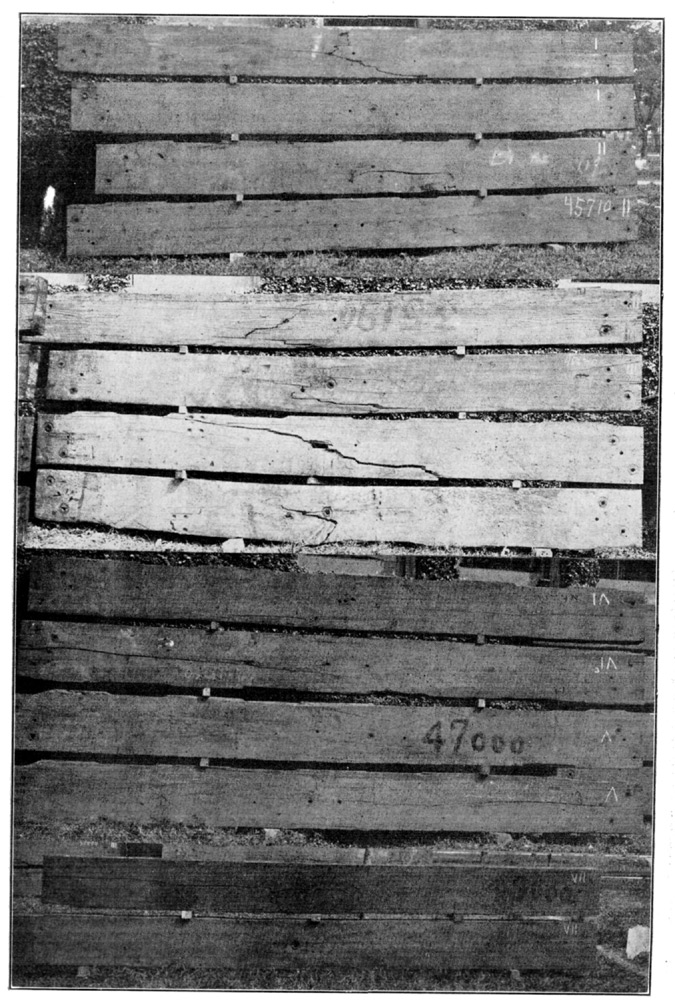
TABLE 4.—Load and Deflection Log. Beam I.
Date: February 26th, 1909. l = 12 ft.; b (mean) = 6-9/32 in.; h (mean) = 15-15/16 in.; c = 7.97 in. Time = 1 hour. Date: February 24th, 1909. l = 12 ft.; b (mean) = 6 in.; h (mean) = 15.69 in.; c = 7.84 in.
No. P Deflection, in Inches. P Deflection, in Inches.
Load, in pounds. Reading. Total deflection. Reading. Total deflection. Mean total deflection. Load, in pounds. Reading. Total deflection. Reading. Total deflection. Mean total deflection.
1 01.86 01.88 0 0 01.83 01.86 0 0
2 2,0001.920.051.900.020.035 2,0001.870.041.900.040.04
3 4,0001.960.101.940.060.080 4,0001.910.081.960.100.090
4 6,0001.990.131.980.100.115 6,0001.960.132.000.140.135
5 8,0002.030.172.020.140.155 8,0002.000.172.040.180.175
610,0002.050.192.060.180.18510,0002.040.212.080.220.215
712,0002.100.242.090.210.22512,0002.090.262.130.270.265
814,0002.130.272.130.250.26014,0002.140.312.180.320.315
916,0002.170.312.160.280.29516,0002.190.362.230.370.365
1018,0002.200.342.200.320.33018,0002.240.412.280.420.415
1120,0002.240.362.250.370.36520,0002.290.462.330.470.465
1222,0002.280.422.280.400.41022,0002.340.512.390.530.520
1324,0002.320.462.320.440.45024,0002.390.562.430.570.565
1426,0002.360.502.360.480.49026,0002.440.612.480.620.615
1528,0002.400.542.390.510.52528,0002.490.662.530.670.685
1630,0002.430.572.440.560.56530,0002.550.722.580.720.720
1732,0002.480.622.480.600.61032,0002.610.782.650.790.785
1834,0002.520.682.530.650.65534,000[B]2.680.852.700.840.845
1936,0002.560.702.560.680.69036,0002.740.912.780.920.915
2038,0002.610.752.620.740.74538,000 Broke.
2140,0002.650.792.670.790.790
2242,0002.700.842.730.850.845
2344,0002.750.892.770.890.890
37,500 lb., First Crack; 45,900 lb., Failed.
At Elastic Limit: Load, 22,000 lb.; deflection, 0.41 in.; S, 2,975 lb.At Elastic Limit: Load, 20,000 lb.; deflection, 0.465 in.; S, 2,975 lb.
Maximum: Load, 45,900 lb.; deflection,.....; S, 6,209 lb.Maximum: Load, 38,000 lb.; deflection,.....; S, 5,540 lb.
E = 1,575,000 lb.E = 1,383,000 lb.
TABLE 4.—(Continued.)—Load and Deflection Log. Beam II.
Date: February 20th, 1909. l = 12 ft.; b (mean) = 6.38 in.; h (mean) = 15.81 in.; c = 7.91 in. Time = 47.5 min Date: — l = 12 ft.; b (mean) = 6.41 in.; h (mean) = 16.41 in.; c = 8.20 in.
No. P Deflection, in Inches. P Deflection, in Inches.
Load, in pounds. Reading. Total deflection. Reading. Total deflection. Mean total deflection. Load, in pounds. Reading. Total deflection. Reading. Total deflection. Mean total deflection.
1 01.65 01.68 0 0 01.86 01.87 0 0
2 2,0001.690.041.720.040.040 2,0001.910.051.920.050.05
3 4,0001.730.081.770.090.085 4,0001.980.121.980.110.115
4 6,0001.760.111.800.120.115 6,0002.050.192.020.150.170
5 8,0001.800.151.830.150.150 8,0002.070.212.080.210.210
610,0001.830.181.860.180.18010,0002.130.272.130.260.265
712,0001.870.221.900.220.22012,0002.180.322.180.310.315
814,0001.910.261.940.260.26014,0002.250.392.240.370.380
916,0001.950.301.980.300.30016,0002.300.442.290.420.430
1018,0001.980.332.020.340.33518,000[C]2.350.492.350.480.485
1120,0002.030.382.060.380.38020,0002.440.582.420.550.565
1222,0002.070.422.100.420.42022,0002.540.682.540.670.675
1324,0002.110.462.140.460.46025,040 Failed
1426,0002.150.502.180.500.500
1528,0002.180.532.220.540.535
1630,0002.230.582.260.580.580
1732,0002.270.622.300.620.620
1834,0002.320.672.350.670.670
1936,0002.370.722.400.720.720
2038,0002.420.772.450.770.770
2140,0002.480.832.500.820.825
2242,0002.530.882.560.880.880
2343,450Fracture.
2445,710Failed.
At Elastic Limit: Load, 20,000 lb.; deflection, 0.38 in.; S, 2,722 lb.At Elastic Limit: Load, 16,000 lb.; deflection, 0.43 in.; S, 1,999 lb.
Maximum: Load, 43,450 lb.; deflection,.....; S, 5,918 lb.Maximum: Load, 25,040 lb.; deflection,.....; S, 3,130 lb.
E = 1,562,000 lb.E = 979,000 lb.
TABLE 4.—(Continued.)—Load and Deflection Log. Beam III.
Date: February 13th, 1909. l = 12 ft.; b (mean) = 5.88 in.; h (mean) = 15.63 in.; c = 7.82 in. Date: — l = 12 ft.; b (mean) = 5.88 in.; h (mean) = 15.9 in.; c = 7.95 in. Time = 45 min.
No. P Deflection, in Inches. P Deflection, in Inches.
Load, in pounds. Reading. Total deflection. Reading. Total deflection. Mean total deflection. Load, in pounds. Reading. Total deflection. Reading. Total deflection. Mean total deflection.
1 01.23 01.06 0 0 01.67 01.63 0 0
2 2,0001.27 .041.100.040.040 2,0001.700.031.680.050.040
3 4,0001.320.091.130.070.080 4,0001.720.051.720.090.070
4 6,0001.370.141.170.110.125 6,0001.820.151.780.150.150
5 8,0001.420.191.220.160.175 8,0001.860.191.820.190.190
610,0001.470.241.260.200.22010,0001.900.231.870.240.235
712,0001.510.281.310.250.26512,0001.970.301.920.290.295
814,0001.550.321.350.290.30514,0002.000.331.980.350.340
916,0001.600.371.400.340.35516,0002.030.362.040.410.385
1018,0001.640.411.440.380.39518,0002.100.432.090.460.445
1120,0001.680.451.490.430.44020,0002.130.462.140.510.485
1222,0001.720.491.540.480.48522,0002.200.532.200.570.550
1324,0001.780.551.580.520.53524,0002.260.592.260.630.610
1426,0001.820.591.640.580.58526,0002.310.642.320.690.665
1528,0001.880.651.680.620.63528,0002.380.712.400.770.740
1630,0001.920.691.730.670.68030,0002.420.752.470.840.795
1732,0001.970.741.790.730.73532,0002.490.822.550.920.870
1834,0002.020.791.850.790.79034,0002.580.912.620.990.950
1936,0002.070.841.900.840.840
2038,0002.130.901.970.910.915
2140,0002.200.972.030.970.970
2242,0002.271.042.111.051.045
2344,0002.371.142.211.151.145
39,100 lb. First Crack; 45,130 lb. Failed.22,000 lb. First Crack; 35,190 lb. Failed.
At Elastic Limit: Load, 24,000 lb.; deflection, 0.535 in.; S 3,608 lb.At Elastic Limit: Load, 21,000 lb.; deflection, 0.515 in.; S, 3,054 lb.
Maximum: Load, 45,130 lb.; deflection,.....; S 6,785 lb.Maximum: Load, 35,190 lb.; deflection,.....; S 5,120 lb.
E = 1,489,000 lb.E = 1,288,000 lb.
TABLE 4.—(Continued.)—Load and Deflection Log. Beam IV.
Date: February 16th, 1909. l = 12 ft.; b (mean) = 6.0 in.; h (mean) = 15.43 in.; c = 7.71 in. Date: February 10th, 1909. l = 12 ft.; b (mean) = 6.12 in.; h (mean) = 15.87 in.; c = 7.93 in. Time = 30 min.
No. P Deflection, in Inches. P Deflection, in Inches.
Load, in pounds. Reading. Total deflection. Reading. Total deflection. Mean total deflection. Load, in pounds. Reading. Total deflection. Reading. Total deflection. Mean total deflection.
1 02.28 02.05 0 0 01.44 01.58 0 0
2 2,0002.310.032.100.050.040 2,0001.500.061.640.060.06
3 4,0002,340.062.140.090.075 4,0001.550.111.700.120.115
4 6,0002.400.122.190.140.130 6,0001.620.181.760.180.180
5 8,0002.430.152.230.180.165 8,0001.680.241.820.240.240
610,0002.470.192.280.230.21010,0001.720.281.890.310.295
712,0002.510.232.320.270.25012,0001.800.361.940.360.360
814,0002.540.262.370.320.29014,0001.850.412.000.420.415
916,0002.590.312.410.360.33516,0001.900.462.060.480.470
1018,0002.620.342.450.400.37018,0001.980.542.130.550.545
1120,0002.680.402.500.450.42520,0002.030.592.190.610.600
1222,0002.720.442.540.490.46522,0002.090.652.250.670.660
1324,0002.780.502.600.550.52524,0002.150.712.330.750.730
1426,0002.820.542.650.600.57026,0002.230.792.420.840.815
1528,0002.870.592.690.640.61528,0002.320.882.490.910.895
1630,0002.910.632.740.690.66030,0002.420.982.621.041.010
1732,0002.970.692.780.730.71032,0002.561.122.741.161.140
1834,0003.010.732.850.800.76534,0002.671.232.871.291.265
1936,0003.070.792.900.850.820
2038,0003.140.862.980.930.895
34,000 lb. First Crack; 38,425 lb. Failed.28,360 lb. Cracked; 35,500 lb, Failed.
At Elastic Limit: Load, 22,000 lb.; deflection, 0.465 in.; S 3,320 lb.At Elastic Limit: Load, 22,000 lb.; deflection, 0.66 in.; S, 3,090 lb.
Maximum: Load, 38,425 lb.; deflection,.....; S 5,810 lb.Maximum: Load, 35,500 lb.; deflection,.....; S 4,983 lb.
E = 1,601,000 lb. E = 1,017,000 lb.
TABLE 4.—(Continued.)—Load and Deflection Log. Beam V.
Date: — l = 12 ft.; b (mean) = 6 in.; h (mean) = 16 in.; c = 8 in. Time = 40 min. Date: February 27th, 1909. l = 12 ft.; b (mean) = 6 in.; h (mean) = 15.87 in.; c = 7.94 in.
No. P Deflection, in Inches. P Deflection, in Inches.
Load, in pounds. Reading. Total deflection. Reading. Total deflection. Mean total deflection. Load, in pounds. Reading. Total deflection. Reading. Total deflection. Mean total deflection.
1 01.97 01.37 0 0 01.31 01.25 0 0
2 2,0002.010.041.400.030.035 2,0001.370.061.310.060.06
3 4,0002.060.091.430.060.075 4,0001.410.100.360.110.105
4 6,0002.080.111.470.100.105 6,0001.460.150.400.150.150
5 8,0002.110.141.500.130.135 8,0001.490.180.450.200.190
610,0002.160.191.540.170.18010,0001.540.231.490.240.235
712,0002.190.221.570.200.21012,0001.580.271.530.280.275
814,0002.220.251.610.240.24514,0001.620.311.570.320.315
916,0002.250.281.650.280.28016,0001.680.371.650.400.385
1018,0002.290.321,690.320.32018,0001.780.411.710.460.435
1120,0002.320.351.730.360.35520,0001.990.681.970.720.700
1222,0002.360.391.780.410.400
1324,0002.390.421.830.460.440
1426,0002.420.451.850.480.465
1528,0002.470.501.900.530.515
1630,0002.500.531.950.580.565
1732,0002.540.571.990.620.595
1834,0002.590.622.040.670.645
1936,0002.630.662.090.720.690
2038,0002.680.712.170.800.755
2140,0002.730.762.210.840.800
2242,0002.800.832.300.930.880
2344,0002.900.932.401.030.980
25,000 lb. Slight Crack; 47,000 lb. Failed.20,000 lb. First Crack; 22,050 lb. Failed.
At Elastic Limit: Load, 22,000 lb.; deflection, 0.40 in.; S, 3,090 lb.At Elastic Limit: Load, 14,000 lb.; deflection, 0.315 in.; S, 1,998 lb.
Maximum: Load, 47,000 lb.; deflection,.......; S, 6,610 lb.Maximum: Load, 22,050 lb.; deflection,.......; S, 3,145 lb.
E = 1,670,000 lb.E = 1,382,000 lb.
TABLE 4.—(Continued.)—Load and Deflection Log. Beam VI.
Date: February 12th, 1909. l = 12 ft.; b (mean) = 5.5 in.; h (mean) = 15.75 in.; c = 7.88 in. Time = 40 min. Date: February 13th, 1909. l = 12 ft.; b (mean) = 5.87 in.; h (mean) = 15.62 in.; c = 7.81 in.
No. P Deflection, in Inches. P Deflection, in Inches.
Load, in pounds. Reading. Total deflection. Reading. Total deflection. Mean total deflection. Load, in pounds. Reading. Total deflection. Reading. Total deflection. Mean total deflection.
1 01.22 01.30 0 0 01.28 01.30 0 0
2 2,0001.260.041.340.040.04 2,0001.300.021.350.050.035
3 4,0001.290.071.380.080.075 4,0001.360.081.390.090.085
4 6,0001.330.111.420.120.115 6,0001.400.121.440.140.130
5 8,0001.370.151.470.170.160 8,0001.430.151.470.170.160
610,0001.420.201.510.210.20510,0001.470.191.510.210.200
712,0001.450.231.550.250.24012,0001.510.231.560.260.245
814,0001.500.281.590.290.28514,0001.550.271.600.300.285
916,0001.540.321.630.330.32516,0001.590.311.640.340.325
1018,0001.580.361.680.380.37018,0001.620.341.690.390.365
1120,0001.610.391.720.420.40520,0001.660.381.740.440.410
1222,0001.660.441.760.460.45022,0001.710.431.800.500.465
1324,0001.810.591.810.510.55024,0001.770.491.840.540.515
1426,0001.860.641.860.560.60026,0001.830.551.900.600.575
1528,0001.910.691.910.610.65028,0001.900.621.970.670.645
1630,0001.960.741.960.660.70030,0001.970.692.020.720.705
1732,0002.000.782.020.720.75032,0002.120.842.100.800.820
1834,0002.040.822.110.810.81534,0002.200.922.160.860.885
1936,0002.100.882.200.900.89036,0002.291.012.240.940.975
2038,0002.160.942.250.950.94538,0002.391.112.321.021.065
2140,0002.281.062.381.081.070
2242,0002.381.162.421.121.140
2344,0002.441.222.521.221.220
2446,0002.531.312.601.301.305
2548,0002.661.442.711.411.425
2650,0002.781.562.871.571.565
33,000 lb., First Crack; 51,330 lb., Failed.24,000 lb., First Crack; 44,000 lb., Failed.
At Elastic Limit: Load, 22,000 lb.; deflection, 0.45 in.; S, 3,484 lb.At Elastic Limit: Load, 20,000 lb.; deflection, 0.41 in.; S, 3,018 lb.
Maximum: Load, 51,330 lb.; deflection,.....; S, 8,925 lb.Maximum: Load, 44,000 lb.; deflection,.....; S, 6,627 lb.
E = 1,695,000 lb.E = 1,625,000 lb.
TABLE 4.—(Continued.)—Load and Deflection Log. Beam VII.
Date: March 2d, 1909. l = 12 ft.; b (mean) = 6.56 in.; h (mean) = 15.62 in.; c = 7.81 in. Time = 1 hr. Date: February 20th, 1909. l = 12 ft.; b (mean) = 6.22 in.; h (mean) = 15.62 in.; c = 7.81 in. Time = 33 min.
No. P Deflection, in Inches. P Deflection, in Inches.
Load, in pounds. Reading. Total deflection. Reading. Total deflection. Mean total deflection. Load, in pounds. Reading. Total deflection. Reading. Total deflection. Mean total deflection.
1 01.84 01.71 0 0 01.69 01.73 0 0
2 2,0001.880.041.740.030.035 2,0001.720.031.770.040.035
3 4,0001.920.081.790.080.080 4,0001.760.071.800.070.070
4 6,0001.960.121.810.100.110 6,0001.800.111.840.110.110
5 8,0002.000.161.850.140.150 8,0001.840.151.870.140.145
610,0002.030.191.890.180.18510,0001.880.191.920.190.190
712,0002.060.221.930.220.22012,0001.910.221.950.220.220
814,0002.110.271.950.240.25514,0001.950.262.000.270.265
916,0002.140.301.990.280.29016,0001.990.302.030.300.300
1018,0002.180.342.030.320.33018,0002.030.342.060.330.335
1120,0002.220.382.050.340.36020,0002.070.382.110.380.380
1222,0002.250.412.100.390.40022,0002.110.422.160.430.425
1324,0002.290.452.130.420.43524,0002.150.462.200.470.465
1426,0002.320.482.170.460.47026,0002.190.502.240.510.505
1528,0002.360.522.210.500.51028,0002.230.542.280.550.545
1630,0002.400.562.250.540.55030,0002.270.582.330.600.590
1732,0002.430.592.290.580.58532,0002.320.632.370.640.635
1834,0002.470.632.320.610.62034,0002.360.672.420.690.680
1936,0002.510.672.370.660.66536,000
2038,0002.560.722.410.700.710
27,000 lb., First Crack; 51,900 lb., Failed.28,000 lb., First Crack; 49,000 lb., Failed.
At Elastic Limit: Load, 34,000 lb.; deflection, 0.62 in.; S, 4,580 lb.At Elastic Limit: Load, 20,000 lb.; deflection, 0.38 in.; S, 2,845 lb.
Maximum: Load, 51,900 lb.; deflection,.....; S, 6,985 lb.Maximum: Load, 49,000 lb.; deflection,.....; S, 6,970 lb.
E = 1,637,000 lb.E = 1,658,000 lb.