With Discussion by Messrs. C. D. Purdon, John C. Trautwine, Jr., and Beverly S. Randolph.
Reading edition
In the location of new railways and the improvement of lines already in operation, it is now well recognized that large economies can be effected by the careful study of train resistance due to grades and alignment, distributing this resistance so as to secure a minimum cost of operation with the means available for construction.
While engaged in such studies some years ago, the attention of the writer was attracted by the fact that the usual method of calculating the traction of a locomotive—by assuming from 20 to 25% of the weight on the drivers—was subject to no small modification in practice.
In order to obtain a working basis, for use in relation to this feature, he undertook the collection of data from the practical operation of various roads. Subsequent engagements in an entirely different direction caused this to be laid aside until the present time. The results are given in Table 1, from which it will be seen that the percentage of driver weight utilized in draft is a function of the length as well as the rate of grade encountered in the practical operation of railways.
In this table, performance will be found expressed as the percentage of the weight on the drivers which is utilized in draft. This is calculated on a basis of 6 lb. per ton of train resistance, for dates prior to 1880, this being the amount given by the late A. M. Wellington, M. Am. Soc. C.. E.,[A] and 4.7 lb. per ton for those of 1908-10, as obtained by A. C. Dennis, M. Am. Soc. C. E.,[B] assuming this difference to represent the advance in practice from 1880 to the present time. Most of the data have been obtained from the "Catalogue of the Baldwin Locomotive Works" for 1881, to which have been added some later figures from "Record No. 65" of the same establishment, and also some obtained by the writer directly from the roads concerned. Being taken thus at random, the results may be accepted as fairly representative of American practice.
Attention should be directed to the fact that the performance of the 10-34 E, Consolidation locomotive on the Lehigh Valley Railroad in 1871 is practically equal to that of the latest Mallet compounds on the Great Northern Railway. In other words, in the ratio between the ability to produce steam and the weight on the drivers there has been no change in the last forty years. This would indicate that the figures are not likely to be changed much as long as steam-driven locomotives are in use. What will obtain with the introduction of electric traction is "another story."
These results have also been platted, and are presented in Fig. 1, with the lengths of grade as abscissas and the percentages of weight utilized as ordinates. The curve sketched to represent a general average will show the conditions at a glance. The results may at first sight seem irregular, but the agreement is really remarkable when the variety of sources is considered; that in many cases the "reputed" rate of grade is doubtless given without actual measurement; that the results also include momentum, the ability to utilize which depends on the conditions of grade, alignment, and operating practice which obtain about the foot of each grade; and that the same amount of energy due to momentum will carry a train farther on a light grade than on a heavy one.
There are four items in Table 1 which vary materially from the general consensus. For Item 9, the authorities of the road particularly state that their loads are light, because, owing to the congested condition of their business, their trains must make fast time. Item 10 represents very old practice, certainly prior to 1882, and is "second-hand." The load consisted of empty coal cars, and the line was very tortuous, so that it is quite probable that the resistance assumed in the calculation is far below the actual. Items 15 and 17 are both high. To account for this, it is to be noted that this road has been recently completed, regardless of cost in the matter of both track and rolling stock, and doubtless represents the highest development of railroad practice. Its rolling stock is all new, and is probably in better condition to offer low resistance than it will ever be again, and there were no "foreign" cars in the trains considered. The train resistance, therefore, may be naturally assumed to be much less than that of roads hauling all classes of cars, many of which are barely good enough to pass inspection. As the grades are light in both cases, this feature of train resistance is larger than in items including heavier grades. Attention should be called to the fact that a line connecting the two points representing these items on Fig. 1 would make only a small angle with the sketched curve, and would be practically parallel to a similar line connecting the points represented by Items 13 and 16. There is, therefore, an agreement of ratios, which is all that needs consideration in this discussion.
Fig. 1.—DIAGRAM SHOWING PERCENTAGE OF WEIGHT ON DRIVERS WHICH IS UTILIZED IN TRACTION ON GRADES OF VARIOUS LENGTHS
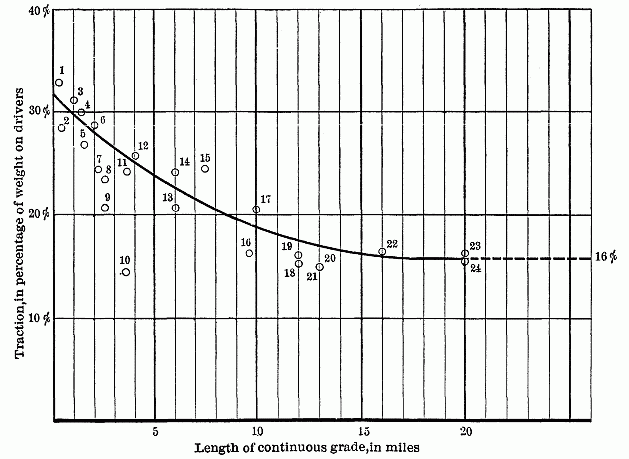
Wellington, in his monumental work on railway location, presents a table of this character. The percentages of weight on the drivers which is utilized in draft show the greatest irregularity. He does not give the length of the grades considered, so that it is impossible to say how far the introduction of this feature would have contributed to bring order out of the chaos. In his discussion of the table he admits the unsatisfactory character of the results, and finally decides on 25% as a rough average, "very approximately the safe operating load in regular service." He further states that a number of results, which he omits for want of space, exceeds 33 per cent. The highest shown in Table 1 will be found in Item 1 (0.06 mile, 0.066 grade), showing 33 per cent. There is no momentum effect here, as the grade is a short incline extending down to the river, and the start is necessarily a "dead" one. The reports of Item 3, which shows 31%, and Item 5, which shows 27%, state specifically that the locomotives will stop and start the loads given at any point on the grade.
The results of a series of experiments reported by Mr. A. C. Dennis in his paper, "Virtual Grades for Freight Trains," previously referred to, indicate a utilization of somewhat more than 23%, decreasing with the speed.
All this indicates that the general failure of locomotives to utilize more than from 16 to 18% on long grades, as shown by Table 1, can only be due to the failure of the boilers to supply the necessary steam. While the higher percentage shown for the shorter grades may be ascribed largely to momentum present when the foot of the grade is reached, the energy due to stored heat is responsible for a large portion of it.
When a locomotive has been standing still, or running with the steam consumption materially below the production, the pressure accumulates until it reaches the point at which the safety valve is "set." This means that the entire machine is heated to a temperature sufficient to maintain this pressure in the boiler. When the steam consumption begins to exceed the production, this temperature is reduced to a point where the consumption and production balance.
The heat represented by this difference in temperature has passed into the steam used, thus adding to the energy supplied by the combustion going on in the furnace. The engines, therefore, are able to do considerably more work during the time the pressure is falling than they can do after the fall has ceased.
The curve in Fig. 1 would indicate that the energy derived from the two sources just discussed is practically dissipated at 15 miles, though the position of the points representing Items 16, 18, 19, 20, and 21 would indicate that this takes place more frequently between 10 and 12 miles. From this point onward the performance depends on the efficiency of the steam production, which does not appear to be able to utilize more than 16% of the weight on the drivers. The diagrams presented by Mr. Dennis in his paper on virtual grades, and by John A. Fulton, M. Am. Soc. C. E., in his discussion of that paper, indicate that similar results would be shown were they extended to include the distance named.
From this it would appear that a locomotive is capable of hauling a larger train on grades less than 10 miles in length than on longer grades, and that, even when unexpectedly stopped, it is capable of starting again as soon as the steam pressure is sufficiently built up. Conversely, it should be practicable to use a higher rate of ascent on shorter grades on any given line without decreasing the load which can be hauled over it. In other words, what is known as the "ruling grade" is a function, strictly speaking, of the length as well as the rate of grade.
In any discussions of the practicability of using a higher rate on the short grades, which the writer has seen, the most valid objection has appeared to be the danger of stalling and consequent delay. As far as momentum is relied on, this objection is valid. Within the limits of the load which can be handled by the steam, it has small value, as it is only a question of waiting a few minutes until the pressure can be built up to the point at which the load can be handled. As this need only be an occasional occurrence, it is not to be balanced against any material saving in cost of construction.
The writer does not know of any experiments which will throw much light on the value of heat storage as separated from momentum, though the following discussion may prove suggestive:
A train moving at a rate of 60 ft. per sec., and reaching the foot of a grade, will have acquired a "velocity head" of 56.7 ft., equivalent to stored energy of 56.7 × 2,000 = 113,400 ft-lb. per ton. On a 0.002 grade (as in Item 15 of Table 1) the resistance would be, gravity 4 lb. + train 4.7 lb. = 8.7 lb., against which the energy above given would carry the train through 113,400 ÷ 8.7 = 13,034 ft., say, 2.5 miles, leaving 5 miles to be provided for by the steam production. Examining the items in the table having grades in excess of 10 miles, it will be noted that 16% is about all the weight on drivers which can be utilized by the current supply of steam. In Item 15 the energy derived from all sources is equivalent to 24.3%; hence the stored heat may be considered as responsible for an equivalent of 24.3% - 16% = 8.3% for a distance of 5 miles.
TABLE 1.
Item No. Length of grade, in miles. Rate of grade. Maximum curvature. Compen sation. Gross weight of load, in tons. Weight of tender, in tons. Weight of locomotive, in tons. Weight on drivers, in tons. Percentage of weight on drivers utilized in draft. Class. Maker. Railroad. Reporting Officer. Year. Source of Data. Remarks.
1 0.06 0.066 115 37.5 29 0.358 8-28-1/3 C Baldwin. Morgan's Louisiana & Texas Newell Tilton, Asst. Supt. 1880 Baldwin Catalogue, 1881, p. 134
2 0.33 0.0203 25°20' 242 25 35 23 0.285 8-28 C " Long Island S. Spencer, Gen. Supt. 1878 Baldwin Catalogue, 1881, p. 72 10 miles per hour.
3 1.0 0.06 16° 0.05 192 22 57.5 50 0.310 10-36 E " Atchison, Topeka & Santa Fe J. D. Burr, Asst. Engr. 1879 Baldwin Catalogue, 1881, p. 115 8 miles per hour. Stops and starts on grade.
4 1.3 0.0127 600 16 40 32.5 0.300 Mogul. " Chillan & Talcahuana J. E. Martin, Local Supt. 1879 Baldwin Catalogue, 1881, p. 100
5 1.4 0.0128 3°12' 750 15 51 44 0.270 10-34 E " Chicago, Burlington & Quincy H. B. Stone 1880 Baldwin Catalogue, 1881, p. 116 Stops and starts at any point on grade.
6 2.0 0.01 1,000 15 51 44 0.291 10-34 E " Chicago, Burlington & Quincy " 1880 Baldwin Catalogue, 1881, p. 116
7 2.2 0.013 3° 725 15 51 44 0.245 10-34 E " Chicago, Burlington & Quincy " 1880 Baldwin Catalogue, 1881, p. 116
8 2.5 0.0144 6° 400 27 42 32 0.237 10-32 E " St. Louis & San Francisco C. W. Rogers, Gen. Mgr. 1879 Baldwin Catalogue, 1881, p. 87
9 2.5 0.004 2,700 70 96.7 85.8 0.207 H 6 - A Pa. R.R Cumberland Valley. 1910
10 3.5 0.033 14° 100 25 35 35 0.160 1910 Trautwine's Pocket Book, Ed. 1882, p. 412 Empty cars; many curves and reversions.
11 3.6 0.035 10° 0.05 236 22 57.5 50 0.245 10-36 E Baldwin. Atchison, Topeka & Santa Fe J. D. Burr, Asst. Engr. 1879 Baldwin Catalogue, 1881, p. 114
12 4.0 0.0085 4° 1,020 30 51 44 0.256 10-34 E " Missouri Pacific John Hewitt, Supt. M. P. 1880 Baldwin Catalogue, 1881, p. 112
13 6.0 0.0145 308 25 38 28 0.207 10-28 D " Western Maryland D. Holtz, M. of Mach'y. 1878 Baldwin Catalogue, 1881, p. 86 12 miles per hour.
14 6.0 0.020 10° 0.05 460 32 57.5 50 0.242 10-34 E " Atchison, Topeka & Santa Fe J. D. Burr, Asst. Engr. 1879 Baldwin Catalogue, 1881, p. 114 8 miles per hour.
15 7.5 0.002 C 6,152 86 134.5 109.5 0.243 Mallet. " Virginian Ry. 1910 Engineering News, Jan. 13, 1910.
16 9.75 0.018 200 18 29 29 0.170 Pennsylvania 1910 Trautwine's Pocket Book, Ed. 1882, p. 412
17 10.0 0.006 C 6,173 86 299 265 0.203 Mallet. Baldwin. Virginian Ry. 1910 Engineering News, Jan. 13, 1910. Road locomotive and helper.
18 12.0 0.018 10° 280 30 51 44 0.160 10-34 E " Lehigh Valley, Wyoming Div. A. Mitchell, Div. Supt. 1871 Baldwin Catalogue, 1881, p. 112
19 12.0 0.022 850 74 175 156 0.166 D-D 16 " Great Northern Grafton Greenough. 1908 Baldwin Loco. Wks. Record, No. 65, p. 29
20 13.0 0.022 800 74 177 158 0.153 D-D 1 " Great Northern Grafton Greenough. 1908 Baldwin Loco. Wks. Record, No. 65, p. 29
21 13.0 0.022 14° 415 50 91 83 0.154 Consol. " Baltimore & Ohio F. E. Blaser, Div. Supt. 1910 Very crooked line. Uncompensated.
22 16.0 0.0044 950 30 51 44 0.164 10-34 E " Central of N. J. W. W. Stearns, Asst.Gen.Supt. 1880 Baldwin Catalogue, 1881, p. 113
23 20.0 0.022 500 62 97.5 90 0.170 F 8, Consol. " Great Northern Grafton Greenough. 1908 Baldwin Loco. Wks. Record, No. 65, p. 29
24 20.0 0.022 800 74 177 158 0.159 L-1, Mallet. " Great Northern Grafton Greenough. 1906 Baldwin Loco. Wks. Record, No. 65, p. 29
In proportioning grade resistance for any line, therefore, a locomotive may be counted on to utilize 24.3% of the weight on the drivers for a distance of 5 miles on a 0.002 grade without any assistance from momentum, and, in the event of an unexpected stop, should be able, as soon as a full head of steam is built up, to start the train and carry it over the grade. This is probably a maximum, considering the condition of the equipment of this Virginian Railway, as previously mentioned.
Treating Item 14 in the same way, a distance of 2,310 ft. is accounted for by momentum, leaving, say, 5.5 miles for the steam, or the length of a 0.02 grade on which a locomotive may be loaded on a basis of tractive power equal to 24.2% of the weight on the drivers.
From these figures it may be concluded that on lines having grades from 12 to 15 or more miles in length, grades of 3 to 5 miles in length may be inserted having rates 50% in excess of that of the long grades, without decreasing the capacity of the line. This statement, of course, is general in its bearings, each case being subject to its especial limitations, and subject to detailed calculations.
It may be noted that the velocity of 60 ft. per sec., assumed at the foot of the grade, is probably higher than should be expected in practice; it insures, on the other hand, that quite enough has been allowed for momentum, and that the results are conservative.
Arguments like the foregoing are always more or less treacherous; being based on statistics, they are naturally subject to material modifications in the presence of a larger array of data, therefore, material assistance in reaching practical conclusions can be given by the presentation of additional data.