APPENDIX
Reading edition
TABLE I
ANNUAL IMMIGRATION 1820-1913
Year ending Sept. 30
18208,385
18219,127
18226,911
18236,354
18247,912
182510,199
182610,837
Year ending Sept. 30
182718,875
182827,382
182922,520
183023,322
183122,633
15 months ending Dec. 31
183260,482
Year ending Dec. 31
183358,640
183465,365
183545,374
183676,242
183779,340
183838,914
183968,069
184084,066
184180,289
1842104,565
9 months ending Sept. 30
184352,496
Year ending Sept. 30
184478,615
1845114,371
1846154,416
1847234,968
1848226,527
1849297,024
1850310,004
3 months ending Dec. 31
185059,976
Year ending Dec. 31
1851379,466
1852371,603
1853368,645
1854427,833
1855200,877
1856200,436
1857251,306
1858123,126
1859121,282
1860153,640
186191,918
186291,985
1863176,282
1864193,418
1865248,120
1866318,568
1867315,722
6 months ending June 30
1868138,840
Year ending June 30
1869352,768
1870387,203
1871321,350
1872404,806
1873459,803
1874313,339
1875227,498
1876169,986
1877141,857
1878138,469
1879177,826
1880457,257
1881669,431
1882788,992
1883603,322
1884518,592
1885395,346
1886334,203
1887490,109
1888546,889
1889444,427
1890455,302
1891560,319
1892623,084
1893439,730
1894285,631
1895258,536
1896343,267
1897230,832
1898229,299
1899311,715
1900448,572
1901487,918
1902648,743
1903857,046
1904812,870
19051,026,499
19061,100,735
19071,285,349
1908782,870
1909751,786
19101,041,570
1911878,587
1912838,172
19131,197,892
1914 (11 months)1,254,548
TABLE II
TOTAL NUMBER OF IMMIGRANTS, BY DECADES
1821-1830 143,439
1831-1840 599,125
1841-1850 1,713,251
1851-1860 2,598,214
1861-1870 2,314,824
1871-1880 2,812,191
1881-1890 5,246,613
1891-1900 3,687,564
1901-1910 8,795,386
TABLE III
INCREASE OF FOREIGN-BORN IN POPULATION BY DECADES
Population.Increase.Increase.
Census Year.Foreign-Born Percentage
1850 2,244,602
1860 4,138,697 1,894,09584.4
1870 5,567,229 1,428,53234.5
1880 6,679,943 1,112,71420.0
1890 9,249,560 2,569,61738.5
1900 10,341,276 1,091,71611.8
1910 13,343,583 3,129,76630.6
TABLE IV
FOREIGN-BORN IN UNITED STATES IN 1910
Per cent
Country of Birth.Number.of total.
Total foreign born.13,515,886100.0
Europe11,791,84187.2
Northwestern Europe6,740,40049.9
Great Britain1,221,2839.0
England877,7196.5
Scotland261,0761.9
Wales82,4880.6
Ireland1,352,25110.0
Germany2,501,33318.5
Scandinavian countries1,250,7339.3
Norway403,8773.0
Sweden665,2071.9
Denmark181,6491.3
Netherlands (Holland), Belgium,
and Luxemburg172,5341.3
Netherlands120,0630.9
Belgium49,4000.4
Luxemburg3,071
France117,4180.9
Switzerland124,8480.9
Southern and Eastern Europe5,048,58337.4
Portugal59,3600.4
Spain22,1080.2
Italy1,343,1259.9
Russia and Finland1,732,46212.8
Russia1,602,78211.9
Finland129,6801.0
Austria-Hungary1,670,58212.4
Austria1,174,9738.7
Hungary495,6093.7
Balkan peninsula220,9461.6
Roumania65,9230.5
Bulgaria11,4980.1
Servia4,639
Montenegro5,374
Greece101,2820.7
Turkey in Europe32,2300.2
Country not specified2,858
Asia191,4841.4
China56,7560.4
Japan67,7440.5
India4,664
Turkey in Asia59,7290.4
All other countries2,591
America1,489,23111.0
Canada and Newfoundland1,209,7179.0
Canada—French385,0832.8
Canada—Other819,5546.1
Newfoundland5,080
West Indies47,6350.4
Mexico221,9151.6
Central and South America9,9640.1
All other43,3300.3
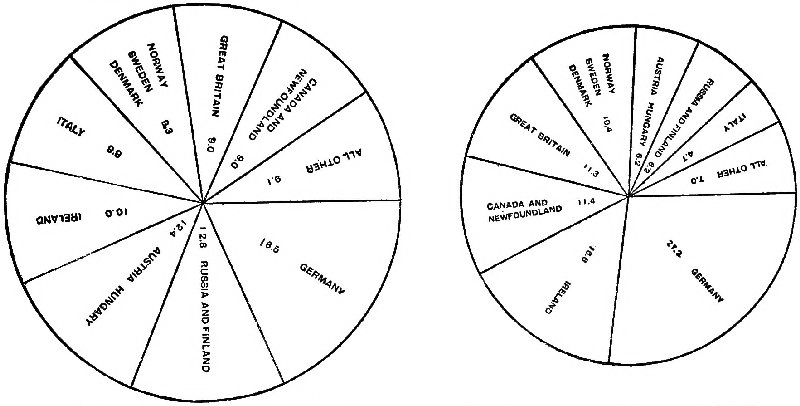
TOTAL FOREIGN BORN, 1910: 13,515,886 TOTAL FOREIGN BORN, 1900: 10,341,276 COUNTRY OF ORIGIN FOREIGN-BORN POPULATION, BY PRINCIPAL COUNTRIES OF BIRTH: 1910 AND 1900
TABLE V
PER CENT. OF IMMIGRANTS FROM NORTHERN AND WESTERN EUROPE AND FROM SOUTHERN AND EASTERN EUROPE, 1820 TO 1910
NorthernSouthernTotalOther
andandfromspecified
Period.Western.Eastern.Europe.countries.
1820-183087.02.989.910.1
1831-184092.51.193.76.3
1841-185095.9.396.23.8
1851-186094.6.895.54.5
1861-187088.51.589.910.1
1871-188073.77.180.819.2
1881-189072.018.390.39.7
1891-190044.852.897.52.5
1901-191021.871.993.76.3
TABLE VI
OLD AND NEW IMMIGRATION COMPARED WITH RESPECT TO ABILITY OF THE FOREIGN-BORN TO READ, BY RACE[1] (STUDY OF EMPLOYEES)
Per cent.
able to
Old Immigration.read.
Canadian, French88.1
Canadian, other98.9
Dutch97.6
English98.8
German98.0
Irish95.8
Scotch99.5
Swedish99.8
Welsh98.1
New Immigration.
Bulgarian78.1
Croatian70.9
Greek80.5
Hebrew, Russian93.1
Hebrew, other92.5
Italian, North83.3
Italian, South67.5
Lithuanian77.3
Magyar91.0
Polish79.9
Portuguese47.5
Roumanian82.6
Russian74.5
Ruthenian65.8
Servian71.3
Slovak84.4
Slovenian87.5
Spanish98.1
Syrian63.6
TABLE VII
OLD AND NEW IMMIGRATION COMPARED WITH RESPECT TO FOREIGN-BORN HUSBANDS REPORTING WIFE ABROAD, BY RACE.[2] (STUDY OF EMPLOYEES)
Per cent
Reporting
Wife
Old Immigration.Abroad.
Canadian, French1.5
Dutch3.8
English3.4
German4.3
Irish1.2
Scotch3.2
Swedish2.9
Welsh1.4
New Immigration.
Bulgarian90.0
Croatian59.3
Greek74.7
Hebrew, Russian12.5
Italian, North31.6
Italian, South36.9
Lithuanian23.3
Magyar43.3
Polish23.0
Portuguese15.9
Roumanian73.9
Russian45.5
Servian64.5
Slovak34.2
Slovenian33.7
TABLE VIII
OLD AND NEW IMMIGRATION COMPARED WITH RESPECT TO ABILITY TO SPEAK ENGLISH.[3] (STUDY OF EMPLOYEES)
Old Immigration.
Nationality.Per cent.
Danish96.5
Dutch86.1
French68.6
German87.5
Norwegian96.9
Swedish94.7
Average82.2
New Immigration.
Bulgarian20.3
Croatian50.9
Greek33.5
South Italian48.7
Lithuanian51.3
Macedonian21.1
Magyar46.4
Montenegrin38.0
Polish43.5
Roumanian33.3
Ruthenian36.8
Russian43.6
Servian41.2
Slovak55.6
Slovenian51.7
Syrian54.6
Turkish22.5
Average40.8
TABLE IX
FOREIGN-BORN IN URBAN AND RURAL COMMUNITIES, 1910
Old Immigration.
PerPer
CountryCentCent
of Birth.Urban.Rural.
Belgium59.640.4
Denmark48.351.7
England72.627.4
France69.930.1
Germany66.733.3
Holland54.945.1
Ireland84.715.3
Norway42.257.8
Scotland72.427.6
Sweden60.639.4
Switzerland53.946.1
New Immigration.
Austria72.427.6
Balkan States50.949.1
Finland50.50.
Greece71.428.6
Hungary77.322.7
Italy78.121.9
Portugal69.630.4
Roumania91.98.1
Russia87.13.
Turkey, in Asia86.713.3
Turkey, in Europe79.520.5
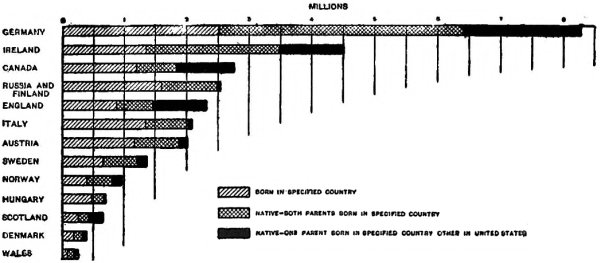
FOREIGN WHITE STOCK, BY PRINCIPAL COUNTRIES OF ORIGIN: 1910.