Chapter III
Reading edition
Declining Birth-rate.
Decline of birth-rates rapid and persistent.—Food cost in New Zealand.—Relation of birth-rate to prosperity before and after 1877.—Neo-Malthusian propaganda.—Marriage rates and fecundity of marriage.—Statistics of Hearts of Oak Friendly Society.—Deliberate desire of parents to limit family increase.
It is not the purpose of this work to follow any further the population problem so far as it relates to deaths and emigration. Attention will be concentrated on births, and the influences which control their rates.
A rapid and continuous decline in the birth-rate of Northern and Western Europe, in contravention of all known biological and economic laws, has filled demographists with amazement.
A table attached here shows the decline very clearly. According to Parkes ("Practical Hygiene," p. 516), the usual food of the soldier may be expressed as follows:—
Articles.Daily quantity in
oz. av.
Meat12.0
Bread24.0
Potatoes16.0
Other vegetables8.0
Milk3.25
Sugar1.33
Salt0.25
Coffee0.33
Tea0.16
——————
Total65.32
Butter2.4—(Moleschott.)
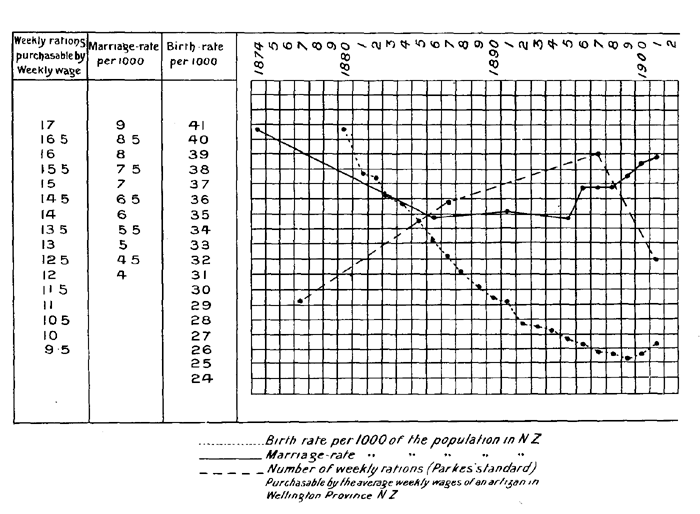
The New Zealand Official Year Book gives the following as the average prices of food for the years mentioned:—
1877188718971901
s. d.s. d.s. d.s. d.
Breadper lb. 0 2¼ 0 1¾ 0 1½ 0 1½
Beefper lb. 0 5¼ 0 3½ 0 3 0 5
Muttonper lb. 0 4 0 2¾ 0 2 0 4½
Sugarper lb. 0 5¾ 0 3 0 2½ 0 2¾
Teaper lb. 3 0 2 3 2 0 110
Butter (fresh)per lb. 1 3 1 0 0 8 011
Cheese (col'n'l)per lb. 010 0 5¾ 0 6 0 6
Milkper qt. 0 4½ 0 3 0 3 0 3½
The official returns give the average daily wage for artisans for the years 1877, 1887, 1897, and 1901 as 11s., 10s. 6d., 9s. 9d., and 10s. 3d., respectively.
The weekly rations (the standard food supply for soldiers—Parkes's) purchaseable by the weekly wages for these years respectively are 11.1, 14.3, 16, and 12.4; i.e., the average weekly wage of an artisan in constant employment in 1877 would purchase rations for 11.1 persons, in 1887 for 14.3 persons, in 1897 for 16 persons, and in 1901 for 12.4 persons.
Up to the year 1877, the birth-rate in England and Wales conformed to the law of Malthus, and kept pace with increasing prosperity; but, after that year, and right up to the present time, the nation's prosperity has gone on advancing at a phenomenal rate pari passu with an equally phenomenal decline in the number of births per 1000 of the population.
Now, it is a remarkable coincidence that in this very year, 1877, the Neo-Malthusians began to make their influence felt, and spread amongst all classes of the people a knowledge of preventive checks to conception.
People were encouraged to believe that large families were an evil. A great many, no doubt, had already come to this conclusion; for there is no more common belief amongst the working classes, at least, than that large families are a cause of poverty and hardship. And this is even more true than it was in the days of the Neo-Malthusians, for then child and women labour was a source of gain to the family, and a poor man's earnings were often considerably augmented thereby.
The uniform decrease of the birth-rate is a matter of statistics, and admits of no dispute. It has been least rapid in the German Empire, and most rapid in New Zealand.
With the declining birth-rate the marriage-rate must be considered.
Malthus would have expected a declining birth-rate to be the natural result of a declining marriage-rate, and a declining marriage-rate to be due to the practice of moral restraint, rendered imperative because of hard times, and a difficulty in obtaining work, wages, and food.
Given the purchasing power of a people, Malthus would have estimated, according to his laws, the marriage-rate, and, given the marriage-rate, he would have estimated the birth-rate.
But anticipations in this direction, based on Malthus's laws, have not been realised. The purchasing power of the people we know has enormously increased; the marriage-rate has not increased, it has, in fact, slightly decreased; but the birth-rate per marriage, or the fecundity of marriage, has decreased in a remarkable degree.
In "Industrial Democracy," by Sydney and Beatrice Webb (p. 637), the following occurs:—"The Hearts of Oak Friendly Society is the largest centralised Benefit Society in this country, having now over two hundred thousand adult male members. No one is admitted who is not of good character, and in receipt of wages of twenty-four shillings a week or upwards. The membership consists, therefore, of the artisan and skilled operative class, with some intermixture of the small shopkeeper, to the exclusion of the mere labourer. Among its provisions, is the "Lying-in Benefit," a payment of thirty shillings for each confinement of a member's wife.
From 1866 to 1880 the proportion of lying-in claims to membership slowly rose from 21.76 to 24.78 per 100. From 1880 to the present time it has continuously declined, until now it is only between 14 and 15 per 100.
The following table (from the annual reports of the Committee of Management of the Hearts of Oak Friendly Society, and those of the Registrar-General) shows, for each year from 1866 to 1895 inclusive, the number of members in the Hearts of Oak Friendly Society at the beginning of the year, the number of those who received Lying-in Benefit during the year, the percentage of these to the membership at the beginning of the year, and the birth-rate per thousand of the whole population of England and Wales.
HEARTS OF OAK FRIENDLY SOCIETY.
Year. Number of Members at the beginning of each year. Number of Cases of lying-in Benefit paid during year. Percentage of cases paid to total Membership at beginning of year. England and Wales: births per 1000 of the total population.
1866 10,571 2,30021.7635.2
1867 12,051 2,85323.6835.4
1868 13,568 3,07522.6635.8
1869 15,903 3,50922.0734.8
1870 18,369 4,17322.7235.2
1871 21,484 4,68521.8135.0
1872 26,510 6,15623.2235.6
1873 32,837 7,38622.4935.4
1874 40,740 9,60323.5736.0
1875 51,14413,10323.6635.4
1876 64,42115,47324.0236.3
1877 76,36918,42324.1136.0
1878 84,47120,40924.1635.5
1879 90,60322,05724.3434.7
1880 91,98622,74024.7234.2
1881 93,61521,95023.4533.9
1882 96,00621,86022.7733.8
1883 98,87321,57721.8233.5
1884104,33921,37520.5133.6
1885105,62221,27720.1432.9
1886109,07421,85620.0432.8
1887111,93720,59018.3931.9
1888115,80320,24417.4831.2
1889123,22320,50316.6431.1
1890131,05720,40215.5730.2
1891141,26922,50015.9331.4
1892153,59523,47115.2830.5
1893169,34425,43015.0230.8
1894184,62927,00014.0829.6
1895201,07529,26314.5530.4
1896206,67330,31314.67...
In this remarkable table the percentage of births to total membership gradually rose from 21.76, in 1866, to 24.72, in 1880, and then gradually declined to 14.67 in 1896.
This is a striking instance of the fact that the decrease in the total birth-rate is due more to a decrease in the fecundity of marriage, than to a decrease of the marriage-rate.
Mr. Webb adds:—"The well-known actuary, Mr. R.P. Hardy, watching the statistics year by year, and knowing intimately all the circumstances of the organisation, attributes this startling reduction in the number of births of children to these specially prosperous and specially thrifty artisans entirely to their deliberate desire to limit the size of their families."
The marriage-rate in England and Wales commenced to decline about three years before the sudden change in the birth-rate of 1877, and continued to fall till about 1880, but has maintained a fairly uniform standard since then, rising slightly in fact, the birth-rate, meanwhile, descending rapidly.