VII The Question of Dividends
Reading edition
It is a certainty that the short seller of dividend-paying stocks suffers a drawback from dividends, except in the rare cases where interest is allowed on short stocks. If we sell short a 6% stock at par and at the end of a year find the stock still selling at par, we have lost 6% without adverse market action. This onus cannot be escaped by short-time commitments; it is merely a matter of degree. The chronic short seller is swimming constantly against the current.
There is one point about dividends which is widely misunderstood by ordinary traders. It appears impossible to make a great many individuals understand that short sales may be as intelligently made the day before a stock sells “ex-dividend” as at any other time. Even when good reasons for a decline exist, traders fight shy of “swallowing the dividend,” or retire commitments just before dividend payment for no other reason than that such distribution is to be made, which is, in fact, no reason at all.
The disadvantage to the seller of stocks through the earning capacity or increment is the same on the day or the week preceding a disbursement as at any other time. The earnings of the company are a steady day to day affair, and are, as they accrue, constantly considered in the price of the stock. In other words, the prices of listed shares are at all times “flat.” At a point midway between two dividend days, the stock reflects in its current price half the amount of the undistributed dividend, or other increment. For example, if a certain stock sells normally at par and pays 6% per annum (3 per cent. in January and 3 per cent. in July) the price of the stock in March, eliminating speculative influences, would be 101½ and in July 103. When on July 1st, the 3 per cent. is distributed, the amount is simply taken away from the company and from the price of the stock also. It now returns to its normal price, 100, and whether it will go up or down from that point is a question for speculation. The factor which made the price 103 has been eliminated and it remains for the corporation in question to again earn 3% available for distribution before the next dividend day.
Perhaps this point may be made clearer by assuming that a certain stock is not handled on the “flat” basis, but is dealt in “and interest” after the method sometimes employed in bond transactions. Let us again eliminate speculation and take for example a stock selling at 100 and paying 6%. Assuming that a dividend had been paid on this stock on January 1st, the purchaser of the stock on February 1st would pay 100 for his shares, and would also pay to the seller the accrued dividend for one month, or ½ of 1% which is exactly the same proposition as if the stock had been quoted flat on the Stock Exchange at 100½. On March 1st, the purchaser would pay 100 for his shares and 1% accrued dividend or 101, etc.
It appears, therefore, that the widespread idea that it is dangerous to sell a stock just before a dividend day is not sound. In fact, the whole matter may be dismissed by saying that if there was any good or logical reason for expecting a premature recovery of the price of dividend-paying shares, or an advance founded on any reason in connection with dividends other than the gradual accumulation from one date of disbursement to the next, the whole problem of making profits in Wall Street would be solved. The rule must necessarily work both ways, and if it is dangerous to sell at certain periods, it must be, in inverse ratio, safe to purchase. All we would need to do therefore, would be to await the dates on which shares sold “ex-dividend” and make purchases. Here then, is exploited a patent way of getting the best of the market without study or effort. In truth, there is nothing whatever in the theory any more than there would be in buying Government bonds for a rise just after the interest had been paid on them. If good reasons exist for sales, they may be made as confidently at one time as another. The disadvantage of being short of dividend-paying stocks is always present, and it cannot be escaped, but the operation is a day to day affair not a matter of certain dates.
Basing Railroad Values.
“The problem of railway valuation is comparatively simple, and beyond the reach of but few. A railway is primarily a carrier, a carter, a drayman. Obviously then, in considering an investment, we shall ask, What sort of a road has it? What sort of vans, and what sort of horses? What sort of trade? A teamster doing business on a fine level macadamized road, with big, heavy vans, and heavy draft horse, can work at a profit and underbid a carrier with old vans and poor horses, working on roads of heavy grade. So, for example, a railroad, other things being equal, with a water grade like the New York Central, has a tremendous advantage over an up and down grade like that of the Erie. The Illinois Central can do business much more cheaply than the Missouri Pacific. A road with a magnificent equipment like the Lake Shore can undercut a poorly equipped road like the Nickel Plate.
“The initial facts that we wish to know of a railway then are, What sort of a road has it, what is its traffic, does it get good rates? When we know what business it does, what its earnings are, then we shall ask, how is it capitalized, what are the fixed charges these earnings have to bear, what is there left, and what is the amount of stock which has to share the surplus? We shall ask if its earnings are stable, if the maintenance is adequate, if the policy of the road is conservative, if its management is good or bad. When we have done all this, then we shall go into the market, ask the prevalent rate of money, and by a simple rule of thumb, we shall know, in a broad way, whether the stock is cheap or dear.”—From “American Railways as Investments,” by Carl Snyder.
The Effects of Business Depression on Rails and Industrials.
“There is apparently a popular belief that the general market always moves together in a considerable swing, and that any advance in one set of stocks would be accompanied by a corresponding advance in others. So far as the general tone of a day’s market is concerned this is true; but, nevertheless, individual stocks or groups of stocks can easily and gradually change their selling basis in a brief period of time. In 1901, for example, the industrial stocks reached their high levels, and suffered a considerable decline in 1902. Meanwhile the rails were advancing. To illustrate and confirm this statement the highest prices of both Rails and Industrials in July, 1901, and July, 1902, are set forth in the following tables. There can be no unfairness in choosing this particular period. What is to be demonstrated is that it is possible for the groups to cross each other in price in a given time. The ten most active stocks have been chosen in each group as fairly representative of the entire market:
RAILROAD STOCKS.
Stock High in July, 1901 High in July, 1902
Atchison 89⅜ 95¾
B. & O. 108¾ 112⅛
Can. Pac. 108¼ 139¾
St. Paul 177¼ 189⅜
Erie 43⅝ 39½
L. & N. 111 145⅞
Mo. Pac. 121⅞ 119½
Penna 151¾ 161¾
Reading 47 69⅞
Union Pacific 110⅞ 110⅝
Average price 102.97 118.41
INDUSTRIAL STOCKS.
Stock High in July, 1901 High in July, 1902
Amalgamated 124¼ 68¾
American Smelting 58 47½
American Sugar 145⅝ 134½
Anaconda 48⅞ 27
Col. Fuel & Iron. 116⅛ 102¼
National Lead 23 22¼
Tenn. Coal & Iron 72½ 69½
Rubber 21¼ 17
U. S. Steel 48⅞ 41
U. S. Steel, Pfd. 99½ 92⅛
Average price 75.80 62.18
“These tables show that during the fiscal year used, railroad stocks advanced an average of over 15 points, while industrials declined almost 14 points. In other words, the spread was 29 points. The man who bought rails and sold industrials would have made on the average 29 points. This exhibit entirely overthrows any argument that the market moves one way or the other homogeneously.
“There was a reason for the spread illustrated above. There always is a reason. We had big crops in 1902, which helped the railroads. The industrials, on the other hand, were busily discounting the business depression of 1903.
“Precedent shows that in a period of general depression Industrial stocks suffer about 33% more than rails. That is to say, in the high and low prices covering a long period, industrial securities should show a distinctly greater pro-rata of decline. Let me illustrate, using the stocks employed in the former table and covering the period of our last great cycle, 1901-02-03. As most of the high prices in rails were made in 1902, the highest prices of both 1901 and 1902 will be used, and the lowest of 1903:
RAILROAD STOCKS.
Stock High in 1901-1902 Low in 1903
Atchison 96⅝ 54
B. & O 118½ 71⅝
Can. Pac. 145¼ 115⅝
St. Paul 198¾ 133¼
Erie 45½ 23
L. & N. 159½ 95
Mo. Pac. 125½ 85¾
Penna 170 110¾
Reading 78½ 37½
Union Pac. 133 65¾
Average price 127.11 79.22
INDUSTRIAL STOCKS.
Stock High in 1901-1902 Low in 1903
Amalgamated 130 33⅝
Am. Smelter 69 36¾
Am. Sugar 153 107⅛
Anaconda 54¼ 25½
Col. F. & I. 136½ 24
Nat’l Lead 32 10½
Tenn. Coal & I. 76⅝ 25⅞
U. S. Rubber 34 7
U. S. Steel 55 10
U. S. Steel, Pfd. 101⅞ 49¾
Average price 84.22 33.01
“It will be observed from the above table that Industrials declined about 51 points while rails declined about 48 points. But the decline cannot be figured in points. The higher range of railroad shares must be considered. A decline of two points in a stock selling at 100 is only equivalent to a decline of one point in a stock selling at 50. Therefore, in order to get a correct view of the matter, we must reduce the decline to percentages. On this basis, railroad stocks lost about 38% of their value, and industrial stocks lost about 60% of their value.”—From Thomas Gibson’s Market Letter, May 4th, 1907.
Undigested Securities.
“The new methods and the new projects are going through the test of fire today, and some of them are being consumed. The tests which weeded out the badly organized and incompetent of the early stock companies, which drove to the wall the “wildcat” banks of ante-bellum days, and which wiped out dividends and stock rights in badly managed railways, are now being applied to the new forms of organization which have been the growth of the past decade. But the stronger and better organized of these new corporations are likely to meet these trials without disaster, or to modify their methods to conform to the teachings of experience, until there remains to the financial world a valuable residuum of new methods for giving flexibility to capital and promoting its transfer promptly and efficiently from the industries where it is not needed to those where it will render its highest service.”—From “Wall Street and the Country,” by Chas. A. Conant.
How to Compute the Value of Rights.
“Inasmuch as the method of computing the value of rights is slightly complicated, an illustration may be given. Let us take the instance of St. Paul again, where the stockholders were allowed to subscribe to 23% of their holdings to new stock at par. The common stock was at that time selling a little below $200 per share. Let us take the round figure, and the operation is as follows:
One hundred shares at $200 per share equals $20,000
Twenty-three shares at $100 equals 2,300
Total cost of 123 shares $22,300
“Average cost, $181 per share.
“Deducting $181 from the market quotation leaves $19, the value of the rights on each share of St. Paul stock. As a matter of fact, the selling price was a little below $200, and the highest price of the rights fell a little below $19 per share.
“In other words the process is simply to take the number of new shares per hundred shares of the original holding to be subscribed for, and add the value of these new shares at the subscription price to the cost of one hundred shares at the market price; then divide the total cost of both old and new shares by the total number of shares, and deduct the average price from the market quotations. This gives the selling value of the rights.”—From “American Railways as Investments,” by Carl Snyder.
Barometer of Averages.
“In order to facilitate the examination of properties and their comparative condition, the following table has been prepared. The figures were arrived at by averaging the operating expenses, fixed charges, margin of safety, and dividends of principal properties for the last fiscal year. The stock prices are based upon the closing figures of June 6, 1907. The margin of safety shown, is the margin over common dividends. Results were as follows:
Average operating expenses 69.01%
Average fixed charges 54.70%
Average margin of safety 5.28%
Average dividend common 6.03%
Average price of stock 1.09⅝
“As in all computations of this kind the figures are comparative and not basic. The fact that one stock is in a much better position than others does not necessarily mark that stock as a purchase, for allstocks may be too high, and underlying conditions may not warrant purchases in any quarter. Again, we must always consider the fact that important elements which cannot be tabulated in figures may be present. However, the table possesses value as a rough barometer, and after it has been broadly applied, specific influences may be given due consideration. If, for example, we find a common stock selling well below 109⅝, with operating expenses below 69.01; fixed charges below 54.70; margin of safety above 5.28 and the dividend rate above 6%, we have a remarkable combination of facts favoring the shares and investigation will be stimulated. The figures vary widely at times in different corporations and cannot always be considered either bullish or bearish, as the good or bad features may be already discounted in the current price of the shares. It may also be found that one property is going backward gradually while another is improving its position.—From Thomas Gibson’s Market Letter, June 8th, 1907.
The Best Method of Trading.
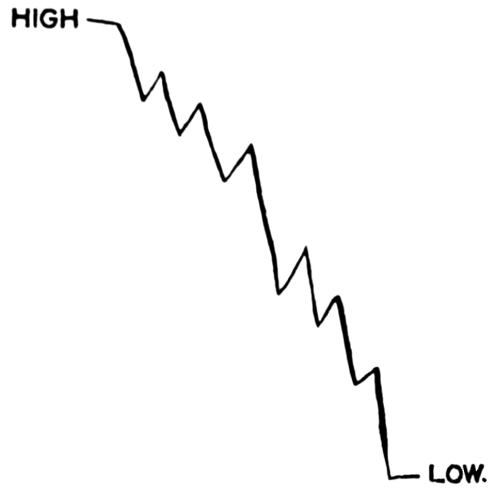
“It may appear that if the market is to sway back and forth, sales on advances, and purchases on declines would offer the maximum of opportunity to the shrewd trader. But not so. To illustrate this, a market movement from high to low prices as shown by a chart is presented on the following page.
“As simple as this illustration may appear, it is worthy of most earnest consideration. True, the upward and downward movements show opportunities on both sides, but if the purchaser makes a mistake, as all speculators will, he is hopelessly involved. If he buys at the wrong point he will never see daylight during the progress of the movement. Look at the other side of the matter. The seller cannot make a mistake. No matter at what point he sells a profit lies before him. A little reflection will show what a tremendous difference exists here.”—From Thomas Gibson’s Market Letter, Feb. 2nd, 1907.
Indications of Crises.
“Preceding Indications.—This preceding period is characterized by well-defined indications, some of which develop contemporaneously, but which, so far as they are distinct in time, occur in approximately the following order:
“1—An increase in prices, first, of special commodities, then, in a less degree, of commodities generally, and later of real estate, both improved and unimproved.
“2—Increased activity of established enterprises, and the formation of many new ones, especially those which provide for increased production or improved methods, such as factories and furnaces, railways and ships, all requiring the change of circulating to fixed capital.
“3—An active demand for loans at slightly higher rates of interest.
“4—The general employment of labor at increasing or well-sustained wages.
“5—Increasing extravagance in private and public expenditure.
“6—The development of a mania for speculation, attended by dishonest methods in business and the gullibility of many investors.
“7—Lastly, a great expansion of discounts and loans, and a resulting rise in the rate of interest; also a material increase in wages, attended by frequent strikes and by difficulty in obtaining a sufficient number of laborers to meet the demand.”—From “Crises and Depression,” by Theodore Burton.
The Ordinary Swing of Prices During a Cycle of Speculation.
UPWARD SWING.
EXTREME A long period of backing
HIGHEST. and filling; public buying,
100 and inside liquidation.
90 Excitement and inflation
75% of general buying done here.
80 Good buying all around.
Public interested.
NORMAL Opinions mixed. Public beginning
VALUE. to buy, but professionals
65 rather bearish.
45 Insiders still bidding prices up.
Professionals bearish.
30 Insiders bidding for stocks,
public skeptical.
20 A dull market. Insiders
EXTREME accept all offerings.
LOWEST.
DOWNWARD SWING.
EXTREME A long period of backing
HIGHEST. and filling; public getting
100 tired and insiders selling.
90 Insiders selling. Much bull
talk, dividend increases, etc.
Some averaging by people
who loaded up at the top.
80 More bull talk. More averaging.
Insiders still selling.
NORMAL Many weak accounts forced out.
VALUE. A temporary halt and probably
65 a big rally.
45 Insiders pretty well out.
The wise speculative element
consider this the bottom and
load up.
30 General blueness and pessimism.
20 A dull market. Insiders
EXTREME accept all offerings.
LOWEST.
—From Thomas Gibson’s Market Letter, May 11th, 1907.
The Factor of Safety.
“There remains but one point to which, in view of the conditions roughly sketched above, the writer would call especial attention. That is, that the investor should look well, always, to the factor of safety. Before he puts his money into any road, no matter if it be on the recommendation of the greatest banker in the United States, let him consider how far that company is prepared to weather a storm. Few roads ever prospered under receivership, no matter how honest or how able. The receivership itself is a handicap. No matter how high the yield, no investor whose primary regard should be the safety of his money will put it into a road whose fixed charges, after ample charges for maintenance, consume much more than 50% of the total net income available for interest, dividends and improvements—that is, save in exceptional cases like the New York Central—and until he has satisfied himself thoroughly that the property is sound.
“For the convenience of those not well acquainted, the following list of the principal roads is given, with the percentage of total net income consumed by fixed charges in the highly prosperous fiscal year of 1905:
TABLE OF FIXED CHARGES.
Atch., Top. & S. Fe 42% Chi. & East. Illinois 68%
Atlantic Coast Line 57% Chi. & N’western 39%
Baltimore & Ohio 39% Chi., Bur. & Quincy 45%
Boston & Maine 78% Chicago Gt. Western 67%
Canadian Pacific 33% Chi., Mil. & St. Paul 32%
Central of Georgia 47% C., St. P., M. & O. 42%
Cen. R. R. of N. J. 50% C., C., C. & St. Louis 69%
Chesapeake & Ohio 53% Col. & Southern 55%
Chicago & Alton 73% Delaware & Hudson 40%
Del., Lack. & West 38% N. Y., Chi. & St. L. 41%
Denver & Rio Grande 52% N. Y., N. H. & H. 48%
Det., Tol. & Ironton 87% N. Y., O. & Western 53%
Du., S. S. & Atlantic 115% Norfolk & Western 37%
Erie 66% Northern Central 28%
Gr. Rap. & Indiana 76% Northern Pacific 29%
Grand Trunk 65% Pennsylvania 38%
Great Northern 26% Pitts. & Lake Erie 11%
Hocking Valley 31% P., C., C. & St. L. 54%
Illinois Central 47% Reading 45%
Iowa Central 79% Rock Island 83%
Kansas City South’n 54% Rutland 69%
L. Erie & Western 69% St. L. & S. Fran. 82%
Lehigh Valley 46% St. L. & S’western 76%
Long Island 101% Seaboard Air Line 78%
L. S. & M. S. 38% Sou. Pacific 49%
Louis. & Nash. 54% Southern 69%
Maine Central 46% Texas & Pacific 40%
Michigan Central 57% Tol., St. L. & S’w’n 61%
Minn. & St. Louis 77% Union Pacific 31%
M., St. P. & S. S. M. 44% Vandalia 54%
M., K. & T. 75% Wabash 80%
Missouri Pacific 60% Wheel. & Lake Erie 90%
N. Y. C. & H. R. 64% Wisconsin Central 69%
Importance of Fixed Charges to the Investor.
“The high degree of stability imparted to interest payments and dividends by a low percentage of fixed charges, and the high degree of instability imparted by a large percentage, is so elementary that it would seem to need no emphasis. And yet this item is habitually disregarded by perhaps 90% of bond and stock buyers. On this account it may be worth while to illustrate by simple comparison the effect of a 20% decline in gross or net earnings. We will compare the conditions of two roads whose fixed charges are respectively 75% and 25% of the total net income. The operation would be as follows:
Suppose a 20% Decline
Say Earnings $1,000,000 $800,000
Exp. (70%) 700,000 560,000
Net $300,000 $240,000
If F. C. 75% = 225,000 225,000
Surplus for div. $75,000 $15,000 (Case I)
Decrease 80%
If F. C. 25% = 75,000 75,000
Surplus $225,000 $165,000
Decrease 26% (Case II)
“It will be seen from the above that a 20% decline in the net earnings would, in the first instance, mean a decrease of 80% in the surplus; while in the second case, the same decline would mean a decrease of only 26% in the surplus—figures which sufficiently indicate what a high percentage of fixed charges means.
“In this connection it may be further noted that in the large holding companies, like the Pennsylvania, the New York Central, the Union Pacific, and others, the factor of safety and the surplus shown tends to be relatively more stable than in companies largely or exclusively dependent upon the earnings of their own roads. This is due to the general custom of American Railways of paying out in dividends only a part of the actual surplus earned. From this it results that dividends are much more stable than earnings, and that the income of the holding companies from this source will correspondingly show smaller fluctuations than earnings. When, therefore, as in the case of some of the large holding companies named, the income from investments represents a considerable portion of the total net income shown, the surplus, other things being equal, will be much more stable than in other companies.
“It is needless to add that this stability is still further heightened when, as in the case of the Pennsylvania, Union Pacific and some other roads, the percentage of fixed charges is at the same time low.”—From “American Railways as Investments,” by Carl Snyder.
Borrowing and Lending Stocks.
“When a speculator sells stock which he does not possess (when he sells it short) he (or what is the same thing, the broker who acts for him) has to borrow the stock to make delivery to the purchaser. The one who possesses stock (who is long of it) is, in ordinary circumstances, as anxious to lend it as the one who has sold it short is anxious to borrow it.
“The lender of stock receives from the borrower the market value of it in money, but except when the stock is lending flat (without interest) or at a premium, the lender of the stock pays to the borrower of it interest on the money paid for the stock by the borrower. The rate of interest is determined by bid and offer.
“On the New York Stock Exchange, brokers who have stocks to borrow and brokers who have stocks to lend assemble immediately after the close of business on the exchange and those who need stocks borrow amounts necessary to make deliveries the next day. Those who neglect to borrow at this time must do so the next morning, or some time in the day before the delivery hour, 2.15 p. m. There is no loan crowd in the morning, but borrowers seek lenders at the posts on the floor of the exchange around which the particular stocks that they require are dealt in.
“The same rules govern the receipt and delivery of stocks borrowed and loaned as govern stocks bought and sold. In returning borrowed stock the borrower must notify the lender before 1 o’clock on the day of delivery; the lender in calling or demanding the return of stock must do likewise.
“When a stock is loaned flat, the owner is relieved from the cost of carrying the stock. If loaned at a premium he is still better off, for the premium is so much gain. When a stock is loaned at a premium, the premium applies in the absence of a renewal of the loan only to the day on which the stock is loaned.
“If a stock that has been borrowed advances in market price the lender may require the borrower to pay to him the difference between the price at which the stock was loaned and the new higher price. On the other hand, if the stock declines in price the borrower may require the lender of the stock to return to him the difference between the price at which the stock was borrowed and the new lower price. These differences are called market differences.
“When a corner is being worked up in a stock it is the practice of those engineering it freely to loan the stock in order to encourage the creation of a short interest in it. When this short interest has become large enough, or in other words, when the stock has become sufficiently oversold, a demand for the return of the stock brings the corner to a culmination.
“An apparent borrowing demand for stocks is sometimes created by the efforts of money lenders to obtain higher interest on their money than is obtainable in lending it in the money market. If the lending rate for a particular stock is, say, 6 per cent. when money is lending at 4½ per cent. in the money market the money lenders will borrow the stock in order to obtain the extra interest.
“When a seller of long stock (stock actually owned) desires to create the impression that he is selling short stock (stock not owned or possessed) he has his broker borrow stock for delivery to purchasers. Then when he has completed his sales he delivers his own stock to the ones from whom his broker borrowed.
“Also, when a seller of stock desires to conceal his identity, he has his stock transferred or made out in the name of his broker, or a clerk, or some other person previous to its delivery to purchasers.
“Arbitrage dealers often sell stock held abroad which will not be received for some time. They borrow for delivery to purchasers and when their own stock arrives they make returns to the ones from whom they borrowed.
“Corporations intending to issue new stock have been known to sell the stock in advance of its issuance and to borrow to make delivery to purchasers. Then when the new stock was issued it was used to make return to the ones from whom stock had been borrowed.”—From Smith’s Financial Dictionary, by Howard Irving Smith.
Scalping.
“There are many different methods and degrees of scalping. The word is supposed to express all the forms of trading between the “Chaser of eighths” and the man who operates for a profit of several points.
“Scalping operations are more common than any other form of trading. There are several reasons for this. Many people consider the market a machine, and base operations on pictures of the past, i. e., charts. These misused and mischievous instruments show so many opportunities of profit in movements both ways, that the unsophisticated trader sees what was possible, while the probable is overlooked.
“Again, the desire to scalp is helped by impatience and greed. The small trader will grow disgusted if there is the slightest delay. Dullness is unbearable to him. Also, he will frequently close good commitments merely for the sake of ‘seeing the money.’ I have seen many traders ‘clean up,’ receive a check which was of absolutely no present use to them, gloat over it for a while, and pay another commission to replace the trades. Ridiculous, but true.
“I may say, as a general principle, that I consider scalping the poorest form of trading. It involves the continued multiplication of commissions, and constant personal attention. I know of but two men who have made any considerable amount of money by scalping methods. They are exceptionally fitted for this form of trading, and have the ability to take a small loss quickly. This is a trait which is very rare among public traders. A man will usually accept a small profit for no other reason than that it is a profit, and will sit stubbornly on a loss for no other reason than that it is a loss.
“The man who has reason to believe that a stock will advance or decline ten points, will, in nine cases out of ten, realize more profit by merely making his trade in the stock and going about his business until he considers it wise to terminate the contract. I will say decidedly that more traders will do better, make more money, and suffer less loss of time, and less annoyance by abandoning scalping tactics altogether.
“This view will no doubt cause my friends in the brokerage business much wrath and indignation. They naturally prefer to have ten commissions rather than one, and I fear that in many cases they recommend scalping tactics for no better reason than the one mentioned.
“That constant and repeated operations are disastrous, is pretty well shown by the remark of a successful ‘Bucket-Shop’ man: ‘I don’t care what they do, or what the market does, if I can only keep them coming up to the order windows every few hours,’ said this gentleman. And he was right; for the ordinary scalper is no more than a gambler, basing his operations on possible variations, and paying a great percentage.
“But if one will insist on scalping, it may be well to examine the subject from the other side and see how the least of the evils may be chosen. Without recommending the practice, or qualifying the views expressed above, I will therefore give my idea of the safest methods of scalping.
“The man who attempts to operate on both sides of the market during the same period, is the most deluded individual in the speculative world. I have already stated, that I have only seen two traders out of thousands I have observed, who could do this with any degree of success. These hybrid Bull-bears are certainly not working on any definitely formed opinion of the future. They are worse off than even the traders who are unchangeably and constitutionally wedded to one side of the market the year round. These latter prejudiced and inflexible individuals will occasionally have a turn in their direction, whatever their position may be, but the Bull-bear will go from one month to another, never seeing anything more than a temporary gain.
“It is important, therefore, that the active trader should form his ideas, base his views on something, and, if he wishes to entertain himself with repeated operations, map out a plan of campaign which shall be, at least, intelligent in its original conception.
“Just how successfully the plan suggested will result, depends largely upon the alertness and understanding of the individual who engineers it. If the active participant is easily moved from his position by changes of a point or two against him; if he is easily frightened by wild rumors and inspired talk; if he expects to gain thousands in a few days by venturing hundreds; or if he believes that he can operate in stocks so shrewdly as to guess high or low points within a dollar or two a share, he will meet with disappointment and loss. If he can overcome these drawbacks, he may do very well as an active trader, but I wish to reiterate my views that the man who takes a position on the market and retains it, will make more money than the scalper.
“As a test question, let me put this inquiry to the active traders who read this letter:
“When you have been correct on a certain movement of say ten points, and have made repeated operations, did you make any more money, or as much, as you would have realized on a single trade showing a ten point profit?”—From Thomas Gibson’s Market Letter, February 14th, 1907.
Crop Damage.
As to the crops, we find many over-optimistic people trying to belittle positive crop damage. It cannot be belittled. It is dangerous and foolish to evade an issue instead of facing it. The argument that our surplus from last year will carry us through a shortage is puerile. That surplus has already been considered. Wheat in the bin is money; some of that money has already been spent and all of it has been given due consideration in the basing of our wealth. A number of writers attempt to make a probable crop of 2,500,000,000 bushels of corn a “bumper crop.” Their methods of arriving at this conclusion are not sound. It is certain that we should, in the natural course of events, raise more and more wheat and corn each year as the population of the world, and the uses of the cereals increase. To compare one year with another will not do. Particularly in Corn and Cotton must we steadily increase in acreage and production, for we supply the world with those commodities. To illustrate this point, let us go back a few years and see what has occurred.
COTTON AND CORN PRODUCTION OF THE UNITED STATES FOR TWENTY-FIVE YEARS.
Year Bushels Corn Bales Cotton
1880 1,717,434,543 5,789,329
1885 1,936,176,000 6,550,215
1890 1,568,874,000 8,655,000
1895 2,151,139,000 7,157,340
1900 2,105,102,516 10,383,422
1905 2,707,993,542 11,345,988
1906 2,927,416,091 13,000,000
The time is very near at hand, when anything less than 3,000,000,000 bushels of corn will be a crop failure; and high prices cannot be considered a great compensation in lean years. Short crops mean decreased demand for labor and loss of purchasing power by the common people, who are after all the best spenders.—From Thomas Gibson’s Market Letter, July 13th, 1907.
The Selection of Securities.
When so many seductive baits are offered, so many nets and traps contrived and constructed by clever brains and cunning fingers are spread for the capture of those having money, is it surprising that the careless and credulous are victimized, and even that the sagacious and prudent should sometimes be taken in? Nevertheless, for the losses they have sustained, investors, as a rule, have themselves chiefly to blame. The mistakes made, in nine cases out of ten, have been the purchase of “cheap” securities. The hope of realizing a little more than ordinary interest, by buying paper at a discount, has proved to be the rock on which unnumbered capitalists have split. In addition to their money’s worth, they have endeavored to get something for nothing, with the result of most generally getting nothing for something. It is remarkable how blind are people, ordinarily sagacious enough to make money, to the fact that property cannot pay a revenue beyond its producing capacity. For instance, how can a trolley company, whose line is wholly or mainly built from the proceeds of mortgage bonds, sell them at a heavy discount, besides allowing large commissions for the selling, and then pay both this interest and dividends on a large issue of watered stocks? Or how can a poor agriculturist, occupying a half improved farm out on the frontier, with a family to support and grain selling barely above the cost of production, pay ten or twelve per cent. upon the capital with which he does business?—From “The Art of Wall Street Investing,” by John Moody.
The Bank Statement.
“A statement or exhibit of the condition of banks.
“In New York the Bank Statement is issued from the clearing house on Saturday. The consolidated statement (or as it is officially designated, the “summary of the weekly statement of the associated banks”) is the collective showing by the banks belonging to the clearing house—the showing when the returns of the individual banks have been consolidated (put together).
“The consolidated bank statement shows the average deposits, loans, specie, legal tenders, circulation, reserve and surplus reserve of the banks for the week ending with and including Friday.
“The term deposits includes the net deposits (credit balances) of persons and concerns (designated as individual deposits), balances to the credit of other banks and all money and credits subject to withdrawal. Loans include money loaned and likewise paper (promissory notes, drafts, etc.) bought. Specie includes not only gold and silver coins, but also gold certificates, which are redeemable in gold or silver, as the case may be. Legal tenders as the term is used in the bank statement, means, United States notes (greenbacks) and Treasury notes (notes issued for silver bullion purchased under the so-called Sherman act).
“Note.—As defined by the statutes, legal tenders include United States notes, Treasury notes, gold and silver coins and minor coins, but not gold certificates, nor silver certificates.
“Circulation means the notes issued by national banks, to secure the redemption of which Government bonds have to be purchased by the banks and deposited with the Treasurer of the United States. A bank cannot count circulation in its reserve; whether it is its own circulation or the circulation of some other bank, makes no difference. Reserve means the total amount of specie and legal tenders held. Surplus reserve means the total amount held in excess of legal requirement. A national bank (in New York City) must, by law, maintain a reserve equal to 25 per cent. of its deposits; a state bank must, by law, maintain a reserve of 15 per cent. In compiling the bank statement a reserve of 25 per cent. is allowed or figured for state banks as well as for national banks.
“The consolidated statement formerly was issued from the clearing house in the following form, the changes (increases and decreases) resulting from comparison with the preceding statement (the statement issued the week before):
Loans $874,647,900 $2,344,000 Increase
Specie 152,338,200 1,068,300 Increase
Legal Tenders 67,274,300 1,319,000 Decrease
Deposits 872,340,600 164,600 Increase
Circulation 36,072,500 411,600 Increase
Decrease of reserve, $291,850
“The (final) item reserve in the statement as issued from the clearing house, meant surplus reserve, although not specifically so stated.
“In the newspapers the statement appeared as follows; being elucidated so as to show the reserve held (that is, specie and legal tenders which are generally referred to as cash holdings), the reserve required and the surplus reserve with the changes in these items:
Current Week Preceding Week Changes
Loans $874,647,900 $872,303,700 In. $2,344,200
Deposits 872,340,600 872,176,000 In. 164,600
Circulation 36,072,500 35,660,900 In. 411,400
Legal Tends. 67,274,300 68,593,300 De. 1,319,000
Specie 152,338,200 151,269,900 In. 1,068,300
Reserve held $219,612,500 $219,863,200 De. $250,700
Res. req’r’d 218,085,150 218,044,000 In. 41,150
Surplus $1,527,350 $1,819,200 De. $291,850
“In 1902 the Secretary of the Treasury (Leslie M. Shaw) suspended the requirement to keep a reserve against government funds on deposit in national banks upon the ground that these funds were special deposits which were fully secured by pledge of bonds with the Treasurer of the United States. This action by the Secretary of the Treasury caused a change in the make-up of the bank statement by the addition to it of figures showing the average amount of government funds on deposit. The consolidated statement was thereafter issued from the clearing house in the following form:
Loans $874,647,900 $2,344,200 Increase
Specie 152,338,200 1,068,300 Increase
Legal Tenders 67,274,300 1,319,000 Decrease
[3]Deposits 872,340,600 164,600 Increase
Circulation 36,072,500 411,600 Increase
Reserve on all deposits 291,850 Decrease
Reserve on all deposits other than United States 325,825 Decrease
“In the newspapers the statement was made up in both the old and the new forms as follows:
Current Week Preceding Week Changes
Loans $874,674,900 $872,303,700 In. $2,344,200
Deposits 872,340,600 872,176,000 In. 164,600
Circulation 36,072,500 35,660,900 In. 411,400
Legal Tends. 67,274,300 68,593,300 De. 1,319,000
Specie 152,338,200 151,269,900 In. 1,068,300
Reserve held $219,612,500 $219,863,200 De. $250,700
Res. req’r’d 218,085,150 218,044,000 In. 41,150
Surplus $1,527,350 $1,819,200 De. $291,850
Deducting the United States deposits held by the banks from the aggregate deposits the bank statement compares as follows:
Current Week Preceding Week Changes
Tot. deposits $872,340,600 $872,176,000 In. $164,600
U.S. deposits 40,633,400 40,769,300 De. 135,900
Dep’s 25% $831,707,200 $831,406,700 In. $300,500
Reserve held 219,612,500 219,863,200 De. 250,700
Res. req’r’d 207,926,800 207,851,675 In. 75,125
Surplus $11,685,700 $12,011,525 De. $325,825
“The detailed bank statement, which is issued simultaneously with the consolidated statement, contains first the number of each bank (each bank has a number by which it is known at the clearing house) and then the name of the bank, after which follow the amounts of its capital, net profits (surplus and undivided profits), specie, legal tenders, deposits and circulation.
“The bank statement is said to have been made up on rising averages when the items in it have been increasing in amount during the week, or the statement is said to have been made up on falling averages when the items in it have been decreasing in amount during the week.
“Generally speaking, the bank statement is favorable or good when it shows that the position of the banks has been strengthened, as by an increase in the surplus reserve through, or by means of an increase in their cash holdings rather than by a decrease in their deposits, which often is effected by the calling of loans—by demanding and obtaining the payment of money loaned on call. As money loaned is credited to borrowers on their deposit accounts and increases the total deposits of the bank, so the payment of loans by borrowers takes from and decreases deposits. As will be seen, the calling and consequent payment of loans does not increase cash holdings but merely changes balances in individual accounts. A reduction in deposits reduces the amount of cash required to be held as a legal reserve and correspondingly expands (increases) the surplus reserve. Generally speaking, also, the bank statement is unfavorable or, if particularly unfavorable, is bad when the position of the banks has been weakened, as by a decrease in the surplus reserve through a decrease in their cash holdings rather than by an increase in their deposits, which often is effected by an expansion in (increase in amount of) their loans, which correspondingly expands (increases) their deposits and correspondingly increases the amount of cash required to be held as a legal reserve. This additional amount is deducted from and correspondingly reduces the surplus reserve.
“The bank statement may be said to be favorable or good, however, if an increase in loans is reported when the banks are surfeited with money: also the bank statement may be said to be unfavorable or rather not good (but hardly bad) when it shows that money is accumulating in idleness in the banks—when deposits are increasing, not as a result of increasing loans, but in the absence of a borrowing demand for money.
“There are other circumstances which make the bank statement favorable or unfavorable as disclosed in the circumstances themselves.
“There is also a non-member bank statement, which is a statement of the conditions of banks which are not members of the clearing house but clear through members. This statement is issued from the clearing house on Monday and shows the average condition of the banks for the week ending with and including the preceding Friday.
“The non-member bank statement contains the name of each bank, followed by its capital, net profits, average amount of loans and discounts and investments, average amount of specie, average amount of legal tender notes and (national) bank notes, average amount on deposit with its clearing house agent (the bank through which it clears at the clearing house), average amount on deposit with other New York City banks and trust companies, average amount of net deposits and average amount of circulation.”—From Smith’s Financial Dictionary.
The Cycles of Stock Speculation.[4]
All speculators, and most investors, possess a general idea of the range and trend of prices for a considerable period. This knowledge is more frequently based upon impressions gained during their own years of activity in the speculative world than upon research. The knowledge gained by active participation is certainly the most forcible and lasting, but is frequently productive of erroneous ideas, as will be set forth hereafter.
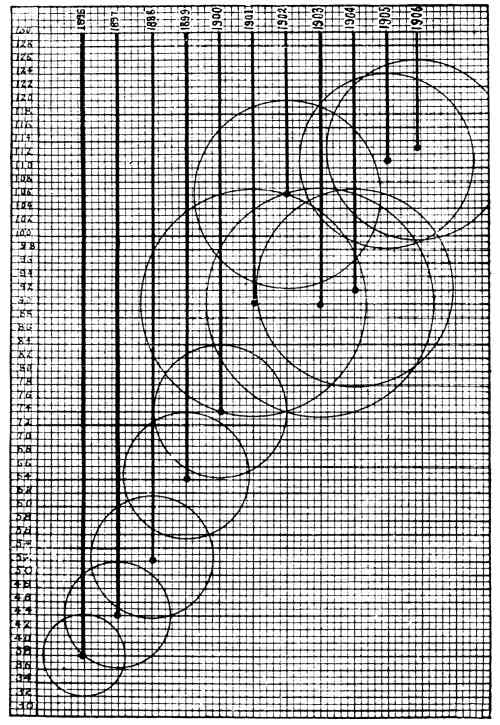
For the purpose of giving a clear idea of the movements in stocks during recent years, the accompanying chart has been arranged. The use of circles in lieu of the customary straight lines was hit upon as presenting more clearly to the eye the comparative extent of each year’s movement, and more plainly distinguishing one year from another. These advantages are gained without obscuring from view the general trend of prices for the period considered.
For the purpose of establishing a single hypothetical stock whose movements should be representative of the course of all other active securities, the fluctuations of twenty stocks were welded together. That is to say, the high points of these stocks for the year 1896 were added and divided by 20. The same course was followed with the low points, and each year considered was treated in like manner. By drawing a circle upon a numbered chart with the upper rim resting upon the figures representing the high point, and the lower rim upon those representing the low point, an average price for the year is necessarily established at the axis.
The size of the circles shows the actual and comparative extent of the movements, and the position of consecutive years on the diagram shows the general trend of prices.
In selecting the twenty stocks to be used in forming a composite security, care was taken to eliminate the shares of such corporations as have undergone radical changes during the period considered, 1896 to 1905, inclusive. The Rock Island Company, for example, is in itself an important system, but owing to the conversion of $75,000,000 Common stock into $200,000,000 of mixed securities in 1902, the tracing of its subsequent movements would involve unnecessary computations and explanations. It may be added that experimental tests show that the hypothetical stock, call it “Composite Common” for the sake of convenient reference, was faithfully representative of almost all movements from 1896 to 1906, and that the selection of other stocks would have made only insignificant variations in the general result. The original intention was to extend the investigation for a longer period than ten years, but so many readjustments, assessments, and other changes occurred in listed securities prior to 1896 as to make a clear showing difficult.
Common stocks of railroads only were considered. Few Industrials have reached their tenth birthday, and aside from this, their introduction would make a false showing by increasing the dividend rate with no corresponding increase in the selling price of the stock.
The twenty stocks chosen for amalgamation were as follows:
Atchison, Topeka & Santa Fe, Baltimore and Ohio, Canadian Pacific, Canada Southern, Chesapeake & Ohio, Chicago & Great Western, Chicago, Milwaukee & St. Paul, Chicago & Northwestern, Chicago, St. Paul, Minneapolis & Omaha, Erie, Illinois Central, Louisville & Nashville, Missouri Pacific, New York Central & Hudson River RR., Pennsylvania, Reading, Southern Pacific, Southern Railway, Union Pacific, and Wabash RR.
PRICES OF COMPOSITE BY YEARS FROM 1896 TO 1906, INCLUSIVE.
Year High Average Low Fluctuation
1896 44 37½ 31 13
1897 53¼ 43⅞ 34½ 18¾
1898 62½ 53¼ 44 18½
1899 72½ 64¼ 56 16½
1900 80½ 70½ 60⅜ 20⅛
1901 106½ 89⅞ 73¼ 33¼
1902 119¼ 105½ 91⅝ 27⅝
1903 106½ 89⅞ 73¼ 33¼
1904 105½ 91 76½ 29
1905 122¾ 109⅝ 96½ 26¼
1906 125¾ 111⅞ 98⅛ 27⅝
Fractions were necessarily omitted from the totals employed in charting the movements. They are, however, unimportant. Dividends on Composite Common were as follows:
1896 1⅖ %
1897 1½ %
1898 1⅝ %
1899 1⁹/₁₀ %
1900 2½ %
1901 3 %
1902 3½ %
1903 3⅜ %
1904 3⁷/₁₀ %
1905 3⅞ %
1906 4¾ %
FLUCTUATIONS OF STOCKS FOR TEN YEARS.
(The rims of the circles touch the average high and low points of 20 railroad stocks, each year for 10 years.)
Reproduced, by permission, from Moody’s Magazine of August, 1906.
It has been the frequent contention of the writer that a chart as a basis for speculative ventures is ridiculous, but a diagram framed for the purpose of pointing out certain facts, or inciting the student of speculative affairs to investigation of causes is a different matter. No interested person can look at the accompanying chart without being struck at once with the decline of 1903 following the steady advance of the preceding years. If this observation incites intelligent investigations as to the reasons for the reversal, much good may result. On the other hand, the fallacy of operating on mere mechanical records of the past is shown by the same diagram. If the chart had been handed to one of the mechanical traders in 1902 he would have argued that the average price of each year marked the approximate low point of each succeeding year. It certainly does look convincing, but what follows? The infallible system not only fails to work, but reverses itself, and the average price of 1902 becomes the approximate high price of 1903 and 1904. At about the time the system player has gathered enough figures to go on, a change occurs. No intrinsic merit attaches to any kind of diagram, they being merely convenient forms for tabulating history.
Some interesting coincidences occur in the chart; most remarkable is the exactly similar size and position of the circles representing the years 1901 and 1903. In no instance did the high or low points of any integral stock correspond in these years, but the total footings were identical in each case.
The speculator may extract some value from the diagram by observing that opportunities for profits of forty or fifty points did not occur during the entire period. The extreme possibilities in any one year were 33 points, and much less on the average. If the trader had purchased or sold Composite at an average price, his possibilities of profit would have been limited to about 15 points in any one year. This does not accord with accepted theories. The ordinary speculator who pursues his operations for ten or fifteen points successfully is almost certain to believe that much more profit lies before him, that he is only getting started. There is a reason for this; the public trader takes for his barometer some security which has been conspicuous for its extended fluctuations; he naturally notices and remembers it to the exclusion of the rank and file of stocks. For example, every active participant in speculative affairs knows that Copper had a range of 75 points in a single year, 1901. He bases possibilities too much on this sort of knowledge without reflecting that Copper was a cardinal exception, and that in order to participate in such movements he must throw caution to the winds, and deal in stocks which offer no degree of safety.
Another point established is the lapse of time required in a readjustment of values. It took Composite Common seven years to advance from an average price of 37 to an average price of 105, 68 points. This again falls short of the speculator’s ideas. He expects to buy a stock at 50 today, and sell it at par six months hence, an operation which is shown by the movements of a representative stock to require a period of six years. Again his expectations are founded on exceptions. The same line of reasoning applies to one case as to the other. The speculator unconsciously magnifies everything connected with speculation.
In reviewing the movements of prices from 1896 to 1905, the most important question is, what caused the reversal of form in 1903? A complete answer to this question would be highly educational. There was no panic, nothing faintly resembling one; business suffered some stagnation, it is true; there was a falling off in the iron and steel business, but crops were good, and wheat, corn, oats, and cotton brought good prices in both 1903 and 1904. Serious business depression was more in anticipation than in realization, but 1904 witnessed no material recovery in prices. These causes do not fully explain so radical a change. If conditions had been such as to cause a reduction of dividends, or a scarcity of money in 1903, the decline would be explained, but money was plentiful enough, and dividends were unchanged. The ratio of dividends as compared with prices was also fairly maintained from 1896 to 1902, and it would appear that prices should merely stop advancing when dividends became stationary; but prices did not merely stand still, they went materially backward.
Without pretending to enter into a full discussion of the causes for the change, one or two points may assist in forming a conclusion. The steady advance in prices from 1896 to 1902 represented two things—a recovery from the great depression of 1893, and the natural advances of property values in a prosperous and growing country. The latter point is the more important, and as there has been no cessation of the growth of population or prosperity, other causes for the reversion must be sought. It is not sufficient to merely say that the recovery over-leaped itself, for such an event would have plainly mirrored itself in a reduction in the rate of dividend returns.
Capitalization of railroads in 1903 increased about 14% as compared with an average increase of 6% in the preceding seven years. Add to this the tremendous increase in the capitalization of industrial corporations, and an over-supply of stocks appears as one of the contributary causes—undigested securities.
Dividend rates were maintained, but were not increased. This particularly affects the simon pure speculator. Nothing will drive him into a panic quicker than a decreased dividend, and nothing makes him so sanguine of higher prices as an increase in the rate of payment. He is always basing his operations on rumors of higher dividends, and when one of these rumors fails of verification, it is almost as bad as a decrease.
And dividends did decrease in one important quarter; United States Steel, the speculative favorite, capitalized more heavily than a dozen ordinary corporations, cut its rate from 4 to 3½%, with every promise of a further reduction. This had a far reaching effect, both on speculators and small investors.
It is certain that fundamental conditions have more to do in shaping prices than has speculation, but the speculator helps, and in 1903 he was particularly potent because of the excesses engendered by the unusual speculative advances of 1901 and 1902. He helped to make the prices and he helped to break them, so he may be considered a factor in the reversal.
The small investor helped. He, too, is a dividend man; he seldom looks at earnings, improvements, or extensions—he wants dividends. United States Steel was a body blow to him; it not only affected his purse, but it frightened him.
And it is probable that an army of small investors sold their holdings for another reason—they discovered that they could make a higher rate of income in other channels. So long as both dividends and prices advanced they were satisfied. They were speculating, not investing, but you cannot convince the ordinary man that buying a stock outright, in the hope of an advance in price, is speculation pure and simple.
Much of the money diverted from the stock market in 1903 by the class last mentioned, has never returned to Wall Street. This bears out the theory that higher rates of interest are being found elsewhere. Never before has the public refused to enter the stock market during a period of great prosperity. They are absent now, and furthermore, they show no intention of returning. Possibly they are wrong. The same influences which are operating to give them better returns may be operating to greatly enhance the value of the shares they ignore,—but the small investors want dividends. Their failure to enter the stock market would seem to be strong evidence that they are finding other investment-speculations more attractive than listed shares. If this is the case, the influences leading to higher interest rates are already at work, although not clearly discernible. Diversification of investments would tend to obscure the truth for a time.
But whatever the causes for the stock market relapse of 1903 may have been, the recovery has been complete. The average prices of 1906 were the highest on record.
Cycles of Grain Speculation.[5]
In examining the price movements of wheat and corn for the last ten years, a gradually advancing trend is apparent. That such would be the case was a foregone conclusion; we naturally expect to find wheat and corn in the foremost ranks of a universal movement towards higher prices. The underlying causes for this general appreciation have already been extensively and clearly discussed in Moody’s Magazine.
All Prices Advancing.
The price appreciation of wheat and corn is merely confirmatory of the theory that all prices are advancing, and that they will continue to advance until the balance between gold and other commodities is readjusted.
But there is something else written between the lines of the statistics of price changes in wheat and corn. The relative advance of the two cereals is all out of proportion.
This fact leads us to seek for some specific cause operating either to depress one cereal or enhance the other, irrespective of the influence already named.
The figures for the last ten years are as follows:
WHEAT.
Year High Average Low
1896 94⅜ 73¹¹/₁₆ 53
1897 109 86⁹/₁₆ 64⅛
1898 185 123½ 62
1899 79½ 71¾ 64
1900 87½ 74½ 61½
1901 79½ 71⁵/₁₆ 63⅛
1902 95 81¼ 67½
1903 93 81¾ 70¼
1904 122 101¹⁰/₁₆ 81¼
1905 124 100¹⁵/₁₆ 77⅞
1906 94¾ 81⅞ 69⅛
CORN.
Year High Average Low
1896 30⅝ 25¹/₁₆ 19½
1897 32⅝ 27³/₁₆ 21¾
1898 38 32 26
1899 38⅛ 34¹/₁₆ 30
1900 49½ 40 30½
1901 67½ 51¾ 36
1902 88 65⅞ 43¾
1903 53 47 41
1904 58⅛ 50⁷/₁₆ 42¾
1905 64½ 53¼ 42
1906 54¾ 46¾ 39
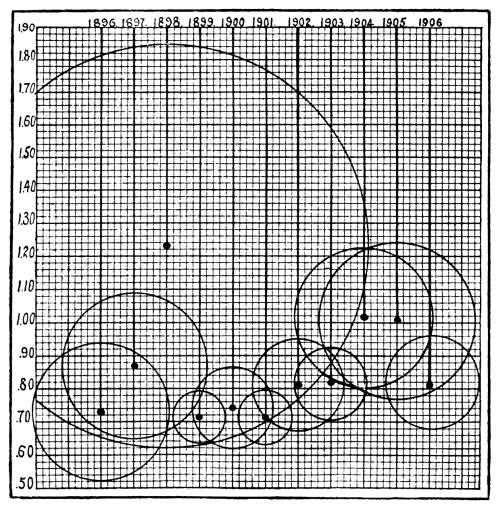
The average price of wheat in the first year (1896) was 73 ¹¹/₁₆ in standard format, in the two following years very high prices were established, and the average may be considered abnormal, as the years 1897 and 1898 cover the rise and fall of Joseph Leiter.
FLUCTUATIONS OF WHEAT PRICES FOR TEN YEARS.
(The rims of the circles touch the high and low prices of wheat each year for 10 years.)
Reproduced, by permission, from Moody’s Magazine of August, 1906.
To digress for a moment, it may be interesting to note that efforts to carry prices beyond reasonable limits almost invariably result in disaster to the promoters, no matter how far they may be successful in establishing black-board quotations. With the exception of “Old Hutch” wheat corner in 1888, all the numerous attempts to speculate successfully on wholly artificial prices in commodities, have failed. The Sully cotton campaign, the Leiter wheat deal, the Phillips corn deal, the Coster-Martin corn deal, all ended in ruin for their sponsors.
From 1899 to 1901 inclusive, the average price of wheat was a little above 70 cents, in 1902 and 1903 it rose to 80 cents, and in 1904 and 1905 to $1.00.
In the latter years, allowance must again be made for unusual influences, the Russo-Japanese war naturally helping wheat prices; making due allowance for this, it may be fairly considered that wheat has in the last ten years increased its average selling price from about 70 cents to 90 cents, or approximately 30%.
Why Corn Has Risen More Than Wheat.
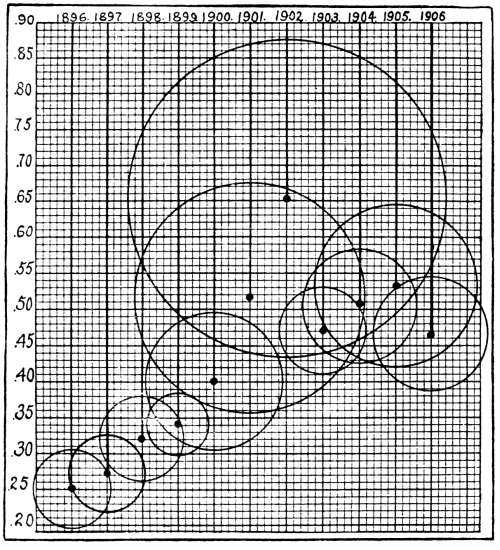
Corn prices in the same period have advanced 100%; the comparatively large number of uses to which corn is put may partly account for the disproportionate enhancement of its price, but the discrepancy is too great to be entirely explained away on this account. It is necessary to seek some additional and more powerful reason.
FLUCTUATIONS OF CORN PRICES FOR TEN YEARS.
(The rims of the circles touch the high and low prices of corn each year for 10 years.)
Reproduced, by permission, from Moody’s Magazine of May, 1906.
The following statistical facts will make it clear that corn and wheat are in wholly different positions.
The United States raised, in 1905, 693,000,000 bushels of wheat. The world’s wheat crop in the same year was 3,275,200,000 bushels. Therefore, we raised approximately 21% of the world’s wheat crop. The year 1905 is fairly indicative of the proportions for the last ten years.
The acreage of wheat in the United States in 1896 was 43,618,646; in 1905 it was 47,854,079, an increase of 38%.
The world’s wheat acreage as indicated by production, is increasing at about the same rate as is the acreage of the United States.
The United States raised, in 1905, 2,708,000,000 bushels of corn. The world’s corn crop was 3,396,800,000; therefore, we raised 80% of the world’s corn.
The corn acreage of the United States in 1896 was 81,027,156; in 1905 it was 94,011,369, an increase of 16%. The world’s corn acreage, as shown by production, did not keep pace with our own ratio of increase, but remained almost stationary.
These figures show that the world is depending on the United States for only 21% of its wheat, and that wheat acreage the world over has increased about 38% in ten years; but the world is depending on the United States for 80% of its corn, and the world’s corn acreage has increased less than 16%.
In order to grasp the full significance of these figures, our practical monopoly of corn production must be appreciated. Even if we admit an equal ratio of increase in corn acreage the world over, it remains for the United States to provide 80% of the increase.
Corn Area Limited.
The probability of any considerable area of new corn land being exploited, either at home or abroad, is very small. A recent circular letter by a man prominent in the cash corn trade, states that there is not an uncultivated acre of available corn land in the United States. This is a radical statement, and does not allow for the fact that with a sufficient price stimulus, considerable wheat, or even cotton land, would be diverted to corn. But whatever allowances are made for an increased corn production, it must be admitted that the possibilities are largely confined to the United States.
Wheat acreage is not thus circumscribed; in fact, the case is practically reversed; almost 80% of the natural increase in wheat production will come from outside our boundaries. Of the principal wheat producing countries,—France, Germany, Russia, Poland and Caucasus, Italy, Hungary, Spain, Roumania and Argentine Republic—the two first named alone fail to keep pace with the United States in ratio of increased production, and others have made up the deficit of these two laggards.
In a nutshell, the difference between the relative positions of wheat and corn is this: The world’s supply of wheat will be furnished by the world, while the world’s supply of corn must be furnished by the United States.
It appears, therefore, that while wheat and corn may both be expected to gradually seek a higher average price in sympathy with the general upward trend, corn is affected by a specific influence, the effects of which must be added to the homogeneous advance.
It is not possible that the supply of corn should increase as rapidly as the demand, under the circumscribed conditions herein set forth. As has already been suggested, the price of corn may become attractive enough to cause the diversion of wheat and cotton lands to corn growing. The possibilities of such a course, however, are not only limited by nature, but such action would stop itself at a certain point by decreasing the supply of wheat or cotton, and again restoring them to favor with the planter.
The speculator may, therefore, reasonably believe that corn is destined, eventually, to reach much higher prices. He must, of course, allow for the temporary influences of large and small crops, and the numerous other actual and technical conditions which cause intermediate fluctuations, and must furthermore bear steadily in mind the fact that there is a limit beyond which the price of corn can never be sustained.
When a given commodity goes beyond a price where it can be replaced by another commodity, it has gone too far; and when necessities become luxuries, they take their places as such, and demand slackens.
FLUCTUATIONS OF COTTON PRICES FOR TEN YEARS.
(The rims of the circles touch the average high and low price of cotton each year for 10 years.)
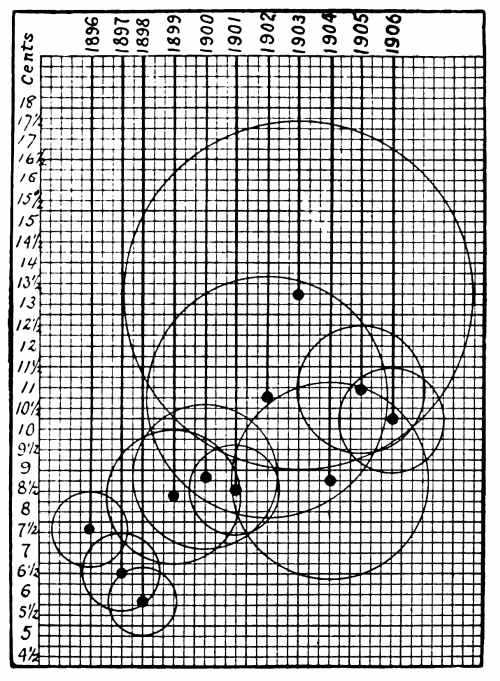
Reproduced, by permission, from Moody’s Magazine of June, 1906.
Cycles of Cotton Speculation.[6]
The accompanying chart, formed on the same plan as the diagram illustrating the movements of stocks in Moody’s Magazine for May, develops some interesting features in the movements of Cotton for the last ten years.
For the benefit of those readers who did not follow the stock chart, it may be said that each circle represents the fluctuations for a single year. The bottom rim of the circle rests on the lowest price during the period, and the top rim on the highest price. The average price is, of course, established at the axis.
The chart illustrates speculative extremes in cotton, the figures on which it is based are not the prices of Spot cotton, but extreme high or low prices for all options. The result, however, would have been only slightly changed had Spot cotton prices been employed.
The diagram is based on fluctuations of 25 points, or ¼ cent per pound; the prices shown, therefore, are not exact, but they serve to illustrate comparative movements with sufficient accuracy. The high and low figures are not those of a calendar year, but of a fiscal, or crop year, ending August 31 of the years named; thus the prices for 1896 represent the fluctuations of the season 1896-1897. As production is necessarily a vital factor in making prices, this method was adopted to prevent confusion in examining the price effects of lean or abundant production. The range of prices for the period considered (1896 to 1906 inclusive), was as follows:
Season High Average Low Fluctuation
1896-97 8.50 7.59 6.69 1.81
1897-98 7.50 6.50 5.62 1.88
1898-99 6.73 5.84 4.96 1.77
1899-00 10.00 8.38 6.76 3.24
1900-01 10.60 8.80 7.01 3.59
1901-02 9.67 8.51 7.35 2.32
1902-03 13.75 10.81 7.87 5.88
1903-04 17.46 13.23 9.01 8.45
1904-05 11.15 8.77 6.39 4.76
1905-06 12.54 10.93 9.32 3.22
1906-07 11.30 9.95 8.60 2.70
In the first three years considered we find low prices, and naturally restricted speculation. The speculative price range for the entire three year period is only a shade more than 3½ cents per pound. This was occasioned by two things; first, the general depression following the panic of 1893, and second, over-production. An examination of the prices of staples shows that unusually low figures prevailed in 1898 and 1899. Corn, for example, averaged 27 cents in 1897, and 31½ cents in 1898. Wheat shows high average prices, but the showing is a result of fictitious speculative figures established by the Leiter deal, and cannot be considered a fair criterion. It may be added, however, that wheat sold as low as 64 cents in 1897, and 62 cents in 1898.
The question of over-production will be made apparent by reference to the following table:
Season Crops in Bales
1896-97 8,714,000
1897-98 11,180,000
1898-99 11,235,000
1899-00 9,439,000
1900-01 10,425,000
1901-02 10,701,000
1902-03 10,758,000
1903-04 10,123,000
1904-05 13,556,000
1905-06 10,697,000
1906-07 13,000,000
Prior to 1897 no crop of over 10,000,000 bales had ever been made; the two bumper crops, 1897-98 and 1898-99 coming together, naturally brought about very low prices, particularly as they occurred in a period of general depression.
In the season next following, 1899-1900, there is a marked falling off in production, which is again reflected in a higher average price. But from that time on, we do not find prices and production in such perfect accord.
It is generally considered now that 10,500,000 bales is a fair crop. In the four seasons from 1900-01 to 1903-04 inclusive, we raised normal crops, while prices advanced. It would be manifestly unfair to consider the year 1903-04 as reflecting with any degree of accuracy the normal price of cotton, for in that period occurred the disastrous Sully campaign. Making due allowance for this, however, it may be assumed that prices would have advanced if no such deal had occurred. This statement is supported by the fact that the bursting of the bubble did not put prices below 9 cents at any time.
Now the most important part of the period is reached, the seasons of 1904-05 and 1905-06.
In 1904-05, in the face of an unprecedented crop of 13,600,000 bales, and in spite of the depressing influence of a speculative debauch in the previous year, the average price of cotton was 8¾ cents.
Still later, in 1905-06, a crop only a little below normal was raised and sold at an average price of 10.93.
Eliminating speculative extremes, and the temporary effects of large or small crops, it appears that the price of cotton is steadily advancing. This is the principal fact for the speculator to consider.
No one pretends to dispute the fact that the prices of all staple-food stuffs, metals and other commodities, as well as labor, have advanced materially in the last ten years. Yet the ordinary speculator ignores this broad general principle, and seeks specific causes for the readjustment in cotton prices. And even this research is seldom conducted intelligently. The investigator attempts to explain higher cotton prices by pointing to reduction of acreage, diversification of crops and organizations formed for the purpose of withholding supplies from the market. He disregards the fact that while these influences play some small part in the matter, cotton is also seeking a higher level in common with every commodity that is bought and sold.
The contention is frequently heard that 10,500,000 bales, or even 11,000,000 bales of cotton can no longer be considered an average crop; that the supply should steadily increase in order to keep pace with consumptive demand, and that the crop of 1904-05 was therefore small, and the crop of 1903-04 not so large as it would appear. As this is the most common of the numerous explanations offered as to the recent high prices of cotton, it will be briefly discussed.
In order to arrive at a clear view of the ratio of increase in production, a considerable period must be consulted. The statistics of crops from year to year, or even from two or three years, will not do. Let us cover a long period, jumping ten years at a time.
Season Crops in Bales
1860-61 3,849,469
1870-71 4,352,317
1880-81 6,605,750
1890-91 8,652,597
1900-01 10,383,432
This exhibit shows that if a sufficiently long period is consulted, a steady increase in production is shown; the average production is also well maintained in the five years from 1901-02 to 1905-06, if the bumper crop of 1904-05 is distributed over the entire period.
The contention is all right, but its formulators do not take the pains to ascertain that what they claim should occur, is exactly what has occurred.
The gist of the whole matter is this: regardless of all temporary or artificial influences, some powerful force, not related to supply and demand, is shouldering prices steadily upward.
To the speculator this fact recognized, analyzed, and properly applied should be of incalculable benefit. If he understands why prices have been advancing, he will be able to determine with facility how long the influence will probably endure. Instead of being misled, or rendered over-cautious by obsolete records of the past, he will be able to calculate from these obsolete records the reasonable expectations of the future. Temporary changes will, of course, be brought about by temporary causes. Fundamental values will still be influenced by supply and demand, but if an independent and submerged force is also at work, due allowance must be made for its operation.
That such a force is at work is written large between the lines of compiled statistics; to ignore its existence is an error rank with mischief. The speculator who does not consult this influence may easily make the mistake of selling at low prices because they are high by comparison with prices which obtained a few years ago.
On the other hand, a clear understanding of the matter will enable the trader to decide with more or less accuracy what now constitutes a low price for cotton, and what will be the probable price for the future.
Conclusion.
The questions most frequently asked by inexperienced people are as follows:
1—What margins are necessary to reasonable safety?
2—Is it better to study the entire list or make a specialty of one stock?
3—What class of securities is the safest?
4—What may be considered a fair rally or reaction in stock prices under ordinary circumstances?
5—What is the best general method of trading?
Some of these questions have been answered in the preceding chapters, but they will be taken up here in turn and the writer’s views submitted on each head.
1—What margins are necessary to reasonable safety?
There is no unqualified answer to this question. The price of the shares operated in must be considered. All other things being equal, a stock selling at $50 would require only half the margin employed in operating in a security selling at $100. If the $50 stock declines 25 points, it has suffered a quoted loss of half its value. The $100 stock, however, must decline 50 points to suffer an equal loss. This percentage of advance or decline is established with remarkable fidelity in every considerable movement.
If the scale order is employed as a method of accumulating shares, extraordinary marginal provisions must be made, for even as the line acquired increases, the original margin dwindles. The scale order is, or should be, based on the assumption that a temporary decline below the first purchase price is desirable and is necessary to the best results. This fact, however, should never be contorted in such a manner as to instigate purchases at high prices. If the operator who employs the scale order will try to make the first purchase at what he considers a bargain price, or in other words at what he calculates to be the very bottom of a movement, he will surely find that in nine cases out of ten, his own errors or the velocity which frequently carries prices to ridiculously low or high points will enable him to accumulate his line to advantage. The scale order should never be used on its mechanical merits alone, but merely as a method of averaging.
It goes without saying that marginal necessities will be principally gauged by the correctness of the speculator’s general views. It is the writer’s opinion, that if care and intelligence is used in judging values, conditions, and the stages of the market, a margin of 20% will be sufficient in almost all cases. That is to say, 20 points on a stock selling at par and 10 points on a stock selling at 50. It must be distinctly understood, however, that this opinion contemplates purchases at low prices after a decline has occurred; and when both the technical and general conditions warrant purchases.
The late Charles H. Dow fixed the sum of $2,500 as the minimum amount necessary to safe operating in ten share lots, but this sum, or any other for that matter, is an arbitrary estimate. Mr. Dow’s figure was founded on the necessity of averaging and also upon a most laudable caution and conservatism which, however, might at times result in unnecessary restriction of operations at a most favorable period. There are times when $500 might be safely made the basis of trading in certain stocks; there are other times and other stocks where $2,500 would be wholly insufficient.
While no rule of thumb is possible in this regard, it is the writer’s opinion that there is no necessity for being out in calculations more than 20%, provided always that due care has been exercised in basing such calculations.
2—Is it better to study the entire list or make a specialty of one security?
It is better to examine the conditions and prices of all the leading securities. This is the only method by which comparative values may be arrived at. It is frequently the case, particularly after a comprehensive decline or a panic, that certain excellent shares have suffered almost as much as the more questionable securities. At such times, what we want is not only a good bargain but the best bargain obtainable, and this may be secured more readily by a careful comparison of prices, values and income return than by any other method.
Again, in an upward movement stocks generally advance, not homogeneously, but one at a time or in closely related groups. Certain shares may have a reasonable advance while others hang fire. If we have good reason to believe we are on the eve of a great bull movement, the best results may be attained by a process of rotation in trading.
3—What class of securities is the safest?
Railroad stocks are the soundest securities. The danger of competition is not so great; the assets are more tangible and when once the specific influences which are now working against them have been cured or eliminated, as they certainly will be in time, these shares will show a steady improvement both in value and price. At times the very best stock will suffer severely and much pessimistic talk will be heard of receiverships, etc. That is the time to buy. Lord Rothschild once advised a friend to buy French rentes. “But the streets of Paris are running with blood,” replied the recipient of the advice. “That,” responded Rothschild, “is the reason you can buy rentes so cheaply.” The man who purchases the shares of railroads when they are greatly depressed may rest serenely in the consciousness that the future of American railroads is assured and that measures seeking to obstruct progress or prevent fair returns on investments, either in the way of income on money or the natural accretion of values cannot possibly endure.
4—What may be considered a fair rally or reaction in stock prices?
Here again the question of ruling prices of a certain stock are to be considered. Low-priced stocks always move in a narrower range than do higher priced ones. The extent of a probable comparative movement may be gauged by percentages with a fair degree of accuracy. This method of measuring a comparative advance or decline, however, will be frequently disturbed by specific influences bearing on a certain stock or group of stocks.
It is useless to undertake to establish even a rough rule for ordinary movements by a system of averages culled from history. We find that in the course of ten years the rallies and reactions which appeared were so varied in character both as to the extent in points and the duration in days, that a barometrical average founded on such investigation would be empirical. However, the results of this inductive reasoning will be given for what they are worth.
The principal movements for ten years have been as follows:
1.—The Bull Market of 1897 to 1899.
This advance began in April, 1897, and terminated in April, 1899—two years of advancing prices. The average advance in Industrial shares was 38.79 points, or about 100%. Railroads advanced 38.92 points, or about 80%.
The intermediate reactions were as follows:
Date of Reaction Extent in Industrials Points Extent in Rails Points Duration Days
Sept. 10 to Nov. 8, ’97 10.17 9.78 59
Jan. 7 to Mar. 25, ’98 8.67 10.43 78
Jun. 10 to Jun. 16, ’98 2.84 2.93 7
Aug. 26 to Oct. 19, ’98 9.41 4.41 54
Jan. 30 to Feb. 7, ’99 3.07 3.38 8
2.—The Bear Market of 1899-1900.
This decline began May 1st, 1899, and culminated Sept. 24, 1900—17 months. The average gross decline in Industrial shares was 24.32 points, or about 32%, and in Rails, 13.27 points, or about 18%.
Intermediate rallies were as follows:
Date of Rally Extent in Industrials Points Extent in Rails Points Duration Days
May 31 to Sep. 5, ’99 10.10 8.17 97
Dec. 18, ’99, to Jan. 2, ’00 9.86 6.38 16
Jan. 11 to Feb. 5, ’00 5.09 4.56 26
Mar. 9 to Apr. 6, ’00 5.04 5.22 29
May 15 to June 1, ’00 2.76 3.42 17
June 23 to July 23, ’00 5.34 4.56 31
July 31 to Aug. 15 2.10 2.31 16
3.—The Bull Market of 1901.
The advance began Oct. 1, 1900, and culminated Aug. 26, 1901, 11 months. The average advance in Industrial shares was 20.87 points, or about 39%. The average advance in Rails was 37.92 points, or about 51%.
Intermediate reactions were as follows:
Date of Reaction Extent in Industrials Points Extent in Rails Points Duration Days
Nov. 20 to Dec. 8, ’00 5.09 1.67 19
Dec. 27, ’00, to Jan. 19, ’01 6.29 4.39 24
May 1 to May 9 7.55 14.49 9
June 17 to July 15 8.80 11.30 29
July 29 to Aug 6 3.89 6.64 9
4.—The Movement of 1902.
The year 1902 is particularly interesting, as it shows what occurred in the market the year prior to a period of industrial relaxation. This year cannot be called either a bull or bear year, as while railroad stocks advanced and closed the year with net gains, the Industrial stocks suffered material declines. As the declines in Industrial stocks was greater than the advance in Rails, we will arbitrarily designate the year as a bear period and examine the homogeneous movement for rallies, instead of reactions.
From Dec. 12, 1901, to Dec. 15, 1902, Industrial shares declined 5.74 points and rails advanced 3 points.
Intermediate rallies were as follows:
Date of Rally Extent in Industrials Points Extent in Rails Points Duration Days
Feb. 20 to Mar. 21, ’02 2.84 3.45 30
Apr. 10 to Apr. 24 2.49 4.91 15
May 19 to May 24 2.09 3.99 6
June 24 to July 28 3.61 7.44 35
Aug. 21 to Sept. 19 2.44 4.05 30
Sept. 29 to Oct. 3 2.51 4.37 5
Oct. 11 to Oct. 17 2.73 4.96 7
Nov. 14 to Nov. 21 2.32 4.80 8
5.—The Bear Market of 1903.
This decline began Jan. 8, 1903, and culminated Nov. 9th, of the year, 10 months. The average gross decline in Industrial shares was 24.18 points, or about 36½%. The decline in Rails was 32.48 points, or about 27%.
The intermediate rallies were as follows:
Date of Rally Extent in Industrials Points Extent in Rails Points Duration Days
Jan. 20 to Feb. 16, ’03 3.51 1.38 28
Mar. 10 to Mar. 20 1.85 3.11 11
Apr. 13 to Apr. 30 3.77 5.07 9
June 10 to June 12 2.60 4.48 3
Aug. 8 to Aug. 17 6.50 8.14 10
6.—The Bull Market of 1904 and 1905.
The advance began Jan. 6, 1904, and culminated Jan. 22, 1906—a little over two years. The average advance in Industrial shares was 55.93 points, or about 119%. The average advance in Rails was 49.56 points, or about 55%.
The intermediate reactions were as follows:
Date of Reaction Extent in Industrials Points Extent in Rails Points Duration Days
Jan. 27 to Feb. 24, ’04 3.79 4.17 29
Apr. 7 to May 18 2.55 4.03 42
Dec. 5 to Dec. 12 7.46 5.93 8
Apr. 14, ’05, to May 8, ’05 9.23 9.81 25
May 12 to May 22 6.68 5.50 11
Aug. 23 to Sept. 7 4.22 4.82 16
Nov. 1 to Nov. 13 3.31 4.74 13
The year 1906 was a neutral year. Prices for Industrials declined only slightly during the year and average prices of railroad stocks were the same in December as in January. Money could have been made throughout the period, either by sales on rallies, or purchases on declines. As a consideration of a neutral year would add little to this exhibit, it will be omitted.
5.—What is the best general method of trading?
The writer’s reply to this question consists principally of a summing up of points already covered in other portions of this work. It is necessary to study and understand the subject thoroughly, to know values, general conditions, the technical position of shares, and above all things to consult future probabilities rather than past performances. Study of the past has its educational value and this is also true of the present, but the future is the all-important thing. Retrospective speculation is one of the commonest and most flagrant of the numerous errors made by public participators. Get whatever of experience and information you can from history, but speculate on the future.
The man who enters the market with insufficient capital, who expects to get rich quick or who allows success to lead him into excesses and over-speculation will lose. It is as certain as death. He may succeed for a time but not for long.
Operations based on “tips” or “charts” will lead to final disaster. This thing of trying to attribute habits to a market is, in the writer’s opinion, ridiculous. The movements of prices are caused by events. We know that in periods of financial stringency or business depression prices fall, and in periods of inflation and good times prices rise. It is possible to formulate a system founded on repetitions applicable to every game of chance, and laid out on paper, that system will appear infallible. You can find the exponents of machine-made riches in every pool-room and gambling house in the country. They all eventually lose and there is nothing to show that the advocates of charts as a basis for stock trading ever fared any better. Imagine James R. Keene, or J. P. Morgan poring over a chart and operating thereon. Even if the market did have habits, as soon as these habits were recognized and followed by a sufficient number of people, the technical position would be rendered so rotten that the charts would fail from that influence alone. Charts, employed as a convenient method of picturing the past, may have a certain value, but used as a basis for trading they are an evidence of laziness or incapacity, or both. It requires hard work to be successful in any line. Thinking is hard work, study is hard work, research is hard work; and it is infinitely easier to bet on repetitions all nicely laid out in crooked lines on a sheet of paper than to laboriously erect sound deductions; but the difference in the two methods is that one will succeed and the other will fail.
We may also resort to the ultimatum employed by those eminent citizens who punch each other’s noses in a prize-ring, i.e., tell the chart-players to “go and get a reputation.” When they can show even one instance of a fortune accumulated by this method their cause will be greatly strengthened.
In the exception taken to Mr. Dow’s theory of $2,500 being the minimum amount necessary for operations in small lots, nothing could be further from the present writer’s intentions than to recommend transactions on insufficient margin. What is sought is merely the truth. The contention that it is wise to stimulate extreme conservatism will not hold. If the naming of a certain sum far in excess of real needs is praiseworthy, we may expand the matter indefinitely and name $5,000 or even $10,000, as the limit.
But on the other hand, errors on the side of prudence are vastly preferable to errors on the side of rashness. In this as in all other things, the golden mean is the really desirable factor.
As to the best side of the market for operations, it is thought that the long side offers the greatest opportunities. The long side is healthier, it is constructive, and almost all the great fortunes made in the market have been founded on discreet and well-timed purchases. To adhere to this plan, however, frequently requires long periods of non-participation, and speculators are not, as a class, very patient. The man who can so school himself as to await opportunities to purchase good securities at low prices has by far the best of the bargain. Few men can do it.
It is fully realized that a work which defends stock speculation in any degree, will meet with much criticism. Nevertheless, people will speculate and if you are one of those who will—do it right.
It is submitted in concluding this work that if the advice here given is heeded, i. e., to know what you are buying and why; to buy only good properties when prices are depressed; to exercise patience and provide sufficient capital; to eliminate first and forever the idea that correct deductions mean sudden riches; to use brains instead of charts, and common-sense instead of tips; in short, to apply to speculative ventures the same degree of business foresight and understanding as would be employed in any other business, the evils and losses which have always been a part of speculative history, would be diminished if not eliminated.