APPENDIX A
Reading edition
(a) Kinetic Energy of α-particles
1 gram of radium in equilibrium with emanation, Ra. A B and C generates heat at the rate of 132 calories per hour (85% due to α-particles).
e = charge on α-particle = 9·3 × 10⁻¹⁰ E.S. units.
= 3·1 x 10⁻²⁰ E.M. ”
m = mass of α-particle see Table below.
v = velocity of α-particle
N = number of α-particles liberated from
1 gram of radium
= 3·4 × 10¹⁰ per second.
Energy E transformed per second is given by—
E = ½ ∑ Nmv² × e
e
= Ne ∑ mv²
2 e
Element. v Cms. per sec. mv²/e E.M. Units.
Radium 1·56 × 10⁹ 4·78 × 10¹⁴
Ra. emanation 1·70 × 10⁹ 5·65 × 10¹⁴
Ra. A 1·77 × 10⁹ 6·12 × 10¹⁴
Ra. C 2·06 × 10⁹ 8·37 × 10¹⁴
Substituting these values, we have— Ne = 3·4 × 10¹⁰ × 3·1 × 10⁻²⁰ = 10·5 × 10⁻¹⁰ E.M. units.
∑ mv² = 10¹⁴(4·78 + 5·65 + 6·12 + 8·37)
e
= 24·9 × 10¹⁴ E.M. units;
whence E = 4·73 × 10⁹ ergs per hour.
Now 4·19 × 10⁷ ergs = 1 gram-calorie.
∴ E = 113 calories per hour.
(b) Production of helium from Uranium and Thorium in equilibrium with all their disintegration products.
Uranium—
N = number of helium atoms liberated from 1 gram of radium alone = 3·4 × 10¹⁰ per second.(Rutherford and Geiger, 1908).
The equilibrium ratio of radium to uranium is 3·4 × 10⁻⁷. Hence for each gram of uranium in equilibrium the number of atoms produced amounts to—
3·4 × 10¹⁰ × 3·4 × 10⁻⁷ × 8 per second
= 29·1 × 10¹¹ per year.
Now the number of helium molecules, and therefore of atoms, in 1 cc. of the gas at N.P.T. is 2·72 × 10¹⁹.
The annual production of helium must consequently be
29·1 × 10¹¹
2·72 × 10¹⁹
i.e. 10·7 × 10⁻⁸ ccs., or 1·88 × 10⁻¹¹ grs. per gram of uranium.
An experimental determination gave 10·6 × 10⁻⁸ ccs. (Strutt, 1910).
Thorium—
The ionising power, or the energy of the α-particles from 1 gram of thorium, is 0·325 of that from 1 gram of uranium, each element being in complete equilibrium.
Average range of α-particles from thorium and its products = 5·4 cms.
Average range of α-particles from uranium and its products = 4·3 cms.
The average thorium α-particle is therefore 1·25 times as energetic as the average uranium α-particle.
Hence the actual production of α-particles or helium atoms from thorium is only 0·325/1·25 = 0·26 of that of uranium. Experimental determinations 0·23 (Strutt, 1910), 0·27 (Rutherford and Geiger, 1910).
(c) Half-life Period of Radium.
(1) The number of α-particles emitted from 1 gram of radium per second (n = 3·4 × 10¹⁰) is equal to the number of atoms disintegrating per second.
If N is the number of atoms in 1 gr. radium, then λ, the fraction which transforms per second, is given by—
λ = n
N
The number of atoms in 1 gr. hydrogen is
6·24 × 10²³,
and as the atomic weight of radium is 226 times that of hydrogen,
N = 2·76 × 10²¹.
∴ λ = 1·25 × 10⁻¹¹ gr. per sec.
= 3·94 × 10⁻⁴ gr. per year.
Half-Life period = 0·69315 = 1760 years.
λ
(2) 1 gr. of radium is in radioactive equilibrium with 0·58 cubic millimetre, or 5·7 × 10⁻⁶ grs. of emanation (atomic wt. = 222).
If λ₁ = 2·085 × 10⁻⁶ is the fraction of emanation transforming per second, we have—
λ = 5·7 × 10⁻⁶ × λ₁
= 1·19 × 10¹¹ gr. per sec.;
whence—Half-Life period = 1850 years.
The earlier values given for the half-life period were 1760 and 2000 years, but the lower figure seems most accurate, with 1850 years as a probable value.
The half-life of uranium would then be—
1850 = 5400 million years.
3·4 × 10⁻⁷
(d) Time-Average of Uranium
Uₜ = Quantity of uranium remaining after a time t.
Uₒ = Quantity of uranium originally present (t = o).
Uₘ = Time-average of uranium during time t.
λ = Disintegration constant of uranium.
Pbₜ = Lead accumulated during time t.
Heₜ = Helium ” ”time t.
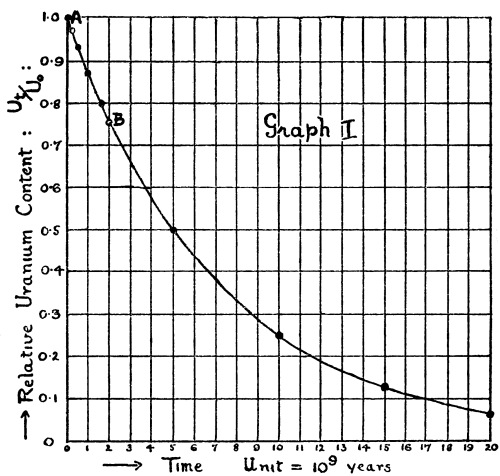
Graph I represents the rate of decay of uranium—according to the exponential law—
Uₜ = Uₒ e-λₜ.
There is one rate of decay which, if it remained constant throughout the time t, would have a total effect equivalent to that produced by the actual slowly decreasing rate of decay. This average rate is represented by some point on the curve, and the corresponding quantity of uranium, Uₘ, is the time-average. Equating the amount of uranium transformed in each case, we have—
Uₒ - Uₗ = λUₘt
whence Uₘ = Uₒ - Uₜ (a).
λt
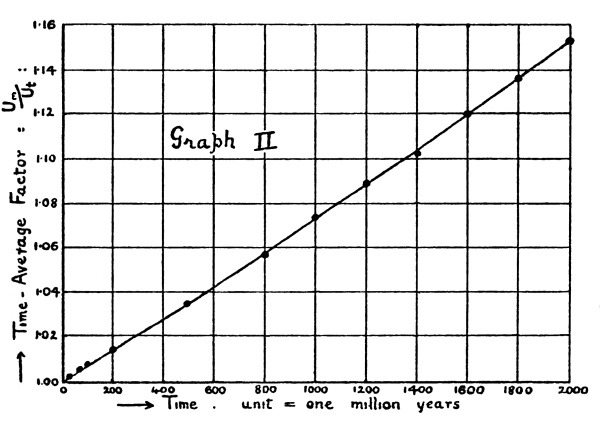
For periods less than 2000 million years, the time-average is nearly equal to the arithmetic mean of Uₒ and Uₗ.
Uₘ = Uₒ + Uₗ (b).
2
The value of Uₘ for 2000 million years is,
according to equation (a), equal to 0·874 Uₒ
and ” ” ” (b) ” ” 0·879 Uₒ.
The ages of minerals rarely exceed 1500 million years, and therefore the error involved by using equation (a) in preference to (b) is quite negligible.
In Graph II the ratio Uₘ/Uₜ, i.e. the factor by which the present uranium content of a mineral must be multiplied in order to obtain the true time-average, is plotted against time.
An approximation to the age, t, of a mineral is afforded by the ratio Pbₜ/Uₜ. From the graph the factor corresponding to this time can be obtained, and thence the time-average. This in turn can be utilised to give the more correct age represented by Pbₜ/Uₘ.
A more straightforward method of correction is as follows:
Uₒ can be determined from known quantities according to the following equation:
Uₘ = Uₜ + Pbₜ + Heₜ
= Uₜ + 1·15 Pbₜ;
whence, Uₘ = Uₗ + 0·575 Pbₜ.
The age of the mineral is then given by the ratio Pbₜ/Uₘ, or directly from Graph II.
(e) Analyses made by the Author of Radium in Igneous Rocks
(cited on p. 130)
Acid Rocks— Ra. per gram of rock
Granite, Mozambique 5·84 × 10⁻¹² grs.
” ” 2·61 ”
” ” 1·77 ”
” N. Nigeria 3·09 ”
” Rhodesia 2·43 ”
” Transvaal 2·12 ”
” South Africa 1·81 ”
” ”” 2·73 ”
Basic Rocks—
Basalt, Mozambique 0·94 × 10⁻¹² grs.
Dolerite ” 0·85 ”
Gabbro ” 1·07 ”
Norite ” 0·54 ”
Ultrabasic Rocks—
Composite analysis of 10 specimens from Scotland,
New Zealand, Africa, and Canada 0·51 × 10⁻¹² grs.