APPENDIX OF TABLES ILLUSTRATING THE SANITARY CONDITION OF THE CITY OF LONDON.
Reading edition
I. Area and Population of the several Districts and Sub-districts of the City.
II. Quinquennial Synopsis of City Mortality, from Michaelmas 1848 to Michaelmas 1853; with Death-Rates calculated for this period, on the Population enumerated in 1851, for each District and Sub-District of the City.
III. First annual enumeration of Deaths, relating to the fifty-two weeks dating from October 1st, 1848, to September 29th, 1849.
IV. Second annual enumeration of Deaths, relating to the fifty-two weeks, dating from September 30th, 1840, to September 28th, 1850.
V. Third annual enumeration of Deaths, relating to the fifty-two weeks, dating from September 29th, 1850, to September 27th, 1851.
VI. Fourth annual enumeration of Deaths, relating to the fifty-two weeks, dating from September 28th, 1851, to September 25th, 1852.
VII. Fifth annual enumeration of Deaths, relating to the fifty-two weeks, dating from September 26th, 1852, to September 24th, 1853.
VIII. Quinquennial Mortality, classified by Age; first, for the entire City; next, for the Three Unions severally.
IX. Number of Deaths occasioned, during the last five years, by certain Acute Diseases, chiefly epidemic, infectious, and endemic.
X. Comparative Mortality in different seasons of the year: namely, in the Autumn-Quarters (October, November, December), in the Winter-Quarters (January, February, March), in the Spring-Quarters (April, May, June), and in the Summer-Quarters (July, August, September), of the five years from Michaelmas 1848 to Michaelmas 1853.
XI. Autumn Mortality.
XII. Winter Mortality.
XIII. Spring Mortality.
XIV. Summer Mortality.
No. I. Area and Population of the several Districts and Sub-districts of the City of London.
Sub-district. Census of 1841. Census of 1851. Decennial increase (+) or decrease. (-) Area of Land in Acres.
East London. - St. Botolph 20,197 23,435 + 3238 85
Cripplegate 19,161 20,582 + 1421 68
Workhouses[88] 454 576 + 122
Total 39,812 44,593 + 4781 153
West London. - North 12,138 12,350 + 212 47
South 16,460 15,844 - 616 77
Workhouse[89] 387 409 + 22
Total 28,985 28,603 - 382 124
City of London. - South-West 8839 9204 + 365 49
North-West 12,427 11,847 - 580 72
South 11,954 11,461 - 493 82
South-East 10,597 10,594 - 3 84
North-East 12,103 12,826 + 723 92
Workhouse[90] 920 794 - 126
Total 56,840 56,726 - 114 379
Entire Population of the City of London 125,637 129,922 + 4285 656
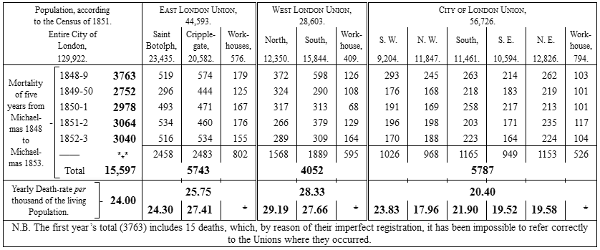
No. II.—Quinquennial Synopsis of City Mortality, with Death-rates calculated per Thousand on the Population of 1851.
Population, according to the Census of 1851. East London Union, 44,593. West London Union, 28,603. City of London Union, 56,726.
Entire City of London, Saint Botolph, Cripple- gate, Work- houses, North, South, Work- house, S. W. N. W. South, S. E. N. E. Work- house,
129,922. 23,435. 20,582. 576. 12,350. 15,844. 409. 9,204. 11,847. 11,461. 10,594. 12,826. 794.
Mortality of five years from Michael- mas 1848 to Michael- mas 1853. - 1848-9 3763 519 574 179 372 598 126 293 245 263 214 262 103
1849-50 2752 296 444 125 324 290 108 176 168 218 183 219 101
1850-1 2978 493 471 167 317 313 68 191 169 258 217 213 101
1851-2 3064 534 460 176 266 379 129 196 198 203 171 235 117
1852-3 3040 516 534 155 289 309 164 170 188 223 164 224 104
—— *** 2458 2483 802 1568 1889 595 1026 968 1165 949 1153 526
Total 15,597 5743 4052 5787
Yearly Death-rate per thousand of the living Population. - 24.00 25.75 28.33 20.40
24.30 27.41 * 29.19 27.66 * 23.83 17.96 21.90 19.52 19.58 *
N.B. The first year’s total (3763) includes 15 deaths, which, by reason of their imperfect registration, it has been impossible to refer correctly to the Unions where they occurred.
NOTE TO TABLE No. II.
In calculating the Death-Rates given in the last lines of this Table, I have proceeded as follows:—
First, I have counted all Workhouse-Population and Workhouse-Deaths as forming part of the aggregate population and aggregate mortality of that Union to which the particular workhouse legally belongs.
Next, I have distributed among the several sub-districts the population and the mortality of their Union Workhouses, in the ratio of the general sub-district population; so as to prevent the high Workhouse-Mortality from telling unjustly against that sub-district in which the Workhouse happens to have been erected.
Thus, for instance, the East London Union has its male Workhouse placed in the territory of the West London Union; but I have reckoned it as belonging to the East London Union, in respect both of its population and its deaths. Similarly, the City of London Union has its Workhouse situate at Bow; but, not the less, I have considered its 794 inmates and 526 deaths as belonging to the population and the mortality of our central Union.
Thus again for the sub-district death-rates—for instance, in the two sub-districts of the East London Union: reckoning the Workhouse-Population not as exclusively due either to Cripplegate or to St. Botolph, but as furnished by these sub-districts jointly, in the ratio of their populations, I have distributed 576 between them in the proportion, 23,435 : 20,582. The Workhouse-Deaths of the period (802) have been similarly distributed; and the rates, given in the last line of the table, are finally deduced from a comparison of these sums, viz:—
23,435 + 306.66 : 2458 + 426.991 :: 1000 : 121.515, which divided by 5 (to show an annual, instead of a quinquennial, result) gives 24.30 as the annual death-rate for St. Botolph; and, in like manner, 20,582 + 269.33 : 2483 + 375.008 gives 137.065 as the quinquennial, and 27.41 as the annual death-rate per thousand for the sub-district of Cripplegate.
Hospital Deaths have been distributed, as far as possible, according to the previous residence of the patients. Thus the north sub-district of the West London Union, in which St. Bartholomew’s Hospital is situated, is made to retain only its just proportion of deaths. On the same principle I have reckoned to the death-lists of other sub-districts those cases in which I could ascertain that the residents of such sub-districts had gone to die either in St. Bartholomew’s, or in other Metropolitan Hospitals.
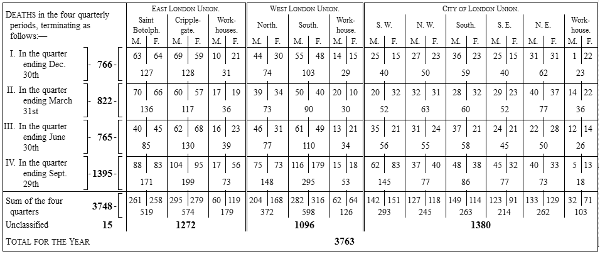
No. III.—First Annual Enumeration of Deaths, relating to the Fifty-two Weeks dating from October 1st, 1848, to September 29th, 1849.
Deaths in the four quarterly periods, terminating as follows:— East London Union. West London Union. City of London Union.
Saint Botolph. Cripple- gate. Work- houses. North. South. Work- house. S. W. N. W. South. S. E. N. E. Work- house.
M. F. M. F. M. F. M. F. M. F. M. F. M. F. M. F. M. F. M. F. M. F. M. F.
I. In the quarter ending Dec. 30th - 766 - 63 64 69 59 10 21 44 30 55 48 14 15 25 15 27 23 36 23 25 15 31 31 1 22
127 128 31 74 103 29 40 50 59 40 62 23
II. In the quarter ending March 31st - 822 - 70 66 60 57 17 19 39 34 50 40 20 10 20 32 32 31 28 32 29 23 40 37 14 22
136 117 36 73 90 30 52 63 60 52 77 36
III. In the quarter ending June 30th - 765 - 40 45 62 68 16 23 46 31 61 49 13 21 35 21 31 24 37 21 24 21 22 28 12 14
85 130 39 77 110 34 56 55 58 45 50 26
IV. In the quarter ending Sept. 29th - 1395 - 88 83 104 95 17 56 75 73 116 179 15 18 62 83 37 40 48 38 45 32 40 33 5 13
171 199 73 148 295 53 145 77 86 77 73 18
Sum of the four quarters 3748 - 261 258 295 279 60 119 204 168 282 316 62 64 142 151 127 118 149 114 123 91 133 129 32 71
519 574 179 372 598 126 293 245 263 214 262 103
Unclassified 15 1272 1096 1380
Total for the Year 3763
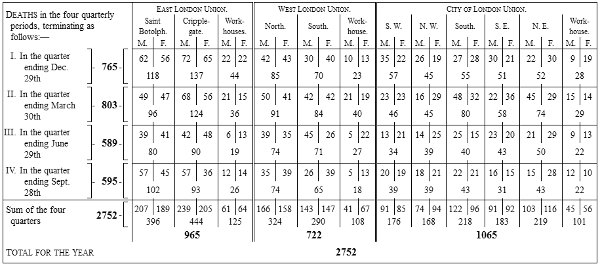
No. IV.—Second Annual Enumeration of Deaths, relating to the Fifty-two Weeks dating from September 30th, 1849, to September 28th, 1850.
Deaths in the four quarterly periods, terminating as follows:— East London Union. West London Union. City of London Union.
Saint Botolph. Cripple- gate. Work- houses. North. South. Work- house. S. W. N. W. South. S. E. N. E. Work- house.
M. F. M. F. M. F. M. F. M. F. M. F. M. F. M. F. M. F. M. F. M. F. M. F.
I. In the quarter ending Dec. 29th - 765 - 62 56 72 65 22 22 42 43 30 40 10 13 35 22 26 19 27 28 30 21 22 30 9 19
118 137 44 85 70 23 57 45 55 51 52 28
II. In the quarter ending March 30th - 803 - 49 47 68 56 21 15 50 41 42 42 21 19 23 23 16 29 48 32 22 36 45 29 15 14
96 124 36 91 84 40 46 45 80 58 74 29
III. In the quarter ending June 29th - 589 - 39 41 42 48 6 13 39 35 45 26 5 22 13 21 14 25 25 15 23 20 21 29 9 13
80 90 19 74 71 27 34 39 40 43 50 22
IV. In the quarter ending Sept. 28th - 595 - 57 45 57 36 12 14 35 39 26 39 5 13 20 19 18 21 22 21 16 15 15 28 12 10
102 93 26 74 65 18 39 39 43 31 43 22
Sum of the four quarters 2752 - 207 189 239 205 61 64 166 158 143 147 41 67 91 85 74 94 122 96 91 92 103 116 45 56
396 444 125 324 290 108 176 168 218 183 219 101
965 722 1065
Total for the Year 2752
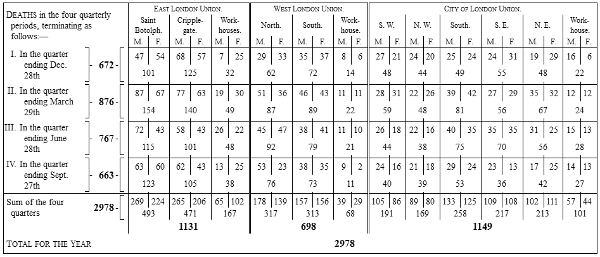
No. V.—Third Annual Enumeration of Deaths, relating to the Fifty-two Weeks dating from September 29th, 1850, to September 27th, 1851.
Deaths in the four quarterly periods, terminating as follows:— East London Union. West London Union. City of London Union.
Saint Botolph. Cripple- gate. Work- houses. North. South. Work- house. S. W. N. W. South. S. E. N. E. Work- house.
M. F. M. F. M. F. M. F. M. F. M. F. M. F. M. F. M. F. M. F. M. F. M. F.
I. In the quarter ending Dec. 28th - 672 - 47 54 68 57 7 25 29 33 35 37 8 6 27 21 24 20 25 24 24 31 19 29 16 6
101 125 32 62 72 14 48 44 49 55 48 22
II. In the quarter ending March 29th - 876 - 87 67 77 63 19 30 51 36 46 43 11 11 28 31 22 26 39 42 27 29 35 32 12 12
154 140 49 87 89 22 59 48 81 56 67 24
III. In the quarter ending June 28th - 767 - 72 43 58 43 26 22 45 47 38 41 11 10 26 18 22 16 40 35 35 35 31 25 15 13
115 101 48 92 79 21 44 38 75 70 56 28
IV. In the quarter ending Sept. 27th - 663 - 63 60 62 43 13 25 53 23 38 35 9 2 24 16 21 18 29 24 23 13 17 25 14 13
123 105 38 76 73 11 40 39 53 36 42 27
Sum of the four quarters 2978 - 269 224 265 206 65 102 178 139 157 156 39 29 105 86 89 80 133 125 109 108 102 111 57 44
493 471 167 317 313 68 191 169 258 217 213 101
1131 698 1149
Total for the Year 2978
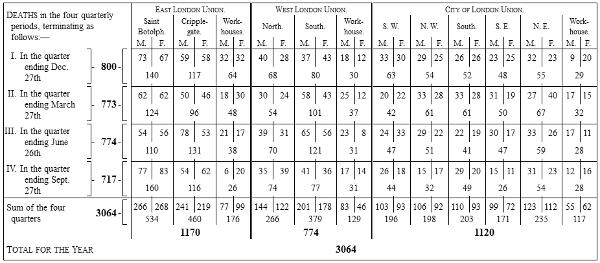
No. VI.—Fourth Annual Enumeration of Deaths, relating to the Fifty-two Weeks dating from September 28th, 1851, to September 25th, 1852.
Deaths in the four quarterly periods, terminating as follows:— East London Union. West London Union. City of London Union.
Saint Botolph. Cripple- gate. Work- houses. North. South. Work- house. S. W. N. W. South. S. E. N. E. Work- house.
M. F. M. F. M. F. M. F. M. F. M. F. M. F. M. F. M. F. M. F. M. F. M. F.
I. In the quarter ending Dec. 27th - 800 - 73 67 59 58 32 32 40 28 37 43 18 12 33 30 29 25 26 26 23 25 32 23 9 20
140 117 64 68 80 30 63 54 52 48 55 29
II. In the quarter ending March 27th - 773 - 62 62 50 46 18 30 30 24 58 43 25 12 20 22 33 28 33 28 31 19 27 40 17 15
124 96 48 54 101 37 42 61 61 50 67 32
III. In the quarter ending June 26th - 774 - 54 56 78 53 21 17 39 31 65 56 23 8 24 33 29 22 22 19 30 17 33 26 17 11
110 131 38 70 121 31 47 51 41 47 59 28
IV. In the quarter ending Sept. 27th - 717 - 77 83 54 62 6 20 35 39 41 36 17 14 26 18 15 17 29 20 15 11 31 23 12 16
160 116 26 74 77 31 44 32 49 26 54 28
Sum of the four quarters 3064 - 266 268 241 219 77 99 144 122 201 178 83 46 103 93 106 92 110 93 99 72 123 112 55 62
534 460 176 266 379 129 196 198 203 171 235 117
1170 774 1120
Total for the Year 3064
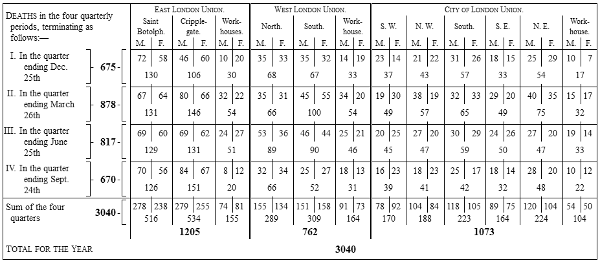
No. VII.—Fifth Annual Enumeration of Deaths, relating to the Fifty-two Weeks dating from September 26th, 1852, to September 24th, 1853.
Deaths in the four quarterly periods, terminating as follows:— East London Union. West London Union. City of London Union.
Saint Botolph. Cripple- gate. Work- houses. North. South. Work- house. S. W. N. W. South. S. E. N. E. Work- house.
M. F. M. F. M. F. M. F. M. F. M. F. M. F. M. F. M. F. M. F. M. F. M. F.
I. In the quarter ending Dec. 25th - 675 - 72 58 46 60 10 20 35 33 35 32 14 19 23 14 21 22 31 26 18 15 25 29 10 7
130 106 30 68 67 33 37 43 57 33 54 17
II. In the quarter ending March 26th - 878 - 67 64 80 66 32 22 35 31 45 55 34 20 19 30 38 19 32 33 29 20 40 35 15 17
131 146 54 66 100 54 49 57 65 49 75 32
III. In the quarter ending June 25th - 817 - 69 60 69 62 24 27 53 36 46 44 25 21 20 25 27 20 30 29 24 26 27 20 19 14
129 131 51 89 90 46 45 47 59 50 47 33
IV. In the quarter ending Sept. 24th - 670 - 70 56 84 67 8 12 32 34 25 27 18 13 16 23 18 23 25 17 18 14 28 20 10 12
126 151 20 66 52 31 39 41 42 32 48 22
Sum of the four quarters 3040 - 278 238 279 255 74 81 155 134 151 158 91 73 78 92 104 84 118 105 89 75 120 104 54 50
516 534 155 289 309 164 170 188 223 164 224 104
1205 762 1073
Total for the Year 3040
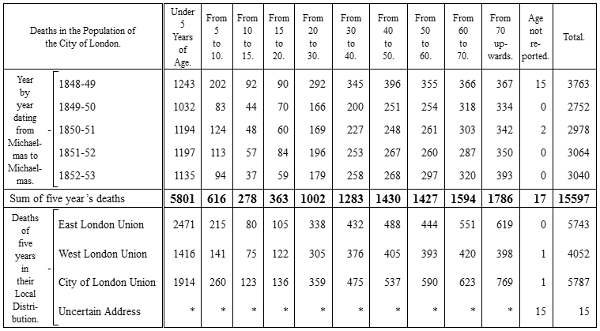
No. VIII.—Quinquennial Mortality, classified by Age, first for the entire City, next for the three Unions severally.
Deaths in the Population of the City of London. Under 5 Years of Age. From 5 to 10. From 10 to 15. From 15 to 20. From 20 to 30. From 30 to 40. From 40 to 50. From 50 to 60. From 60 to 70. From 70 up- wards. Age not re- ported. Total.
Year by year dating from Michael- mas to Michael- mas. - 1848-49 1243 202 92 90 292 345 396 355 366 367 15 3763
1849-50 1032 83 44 70 166 200 251 254 318 334 0 2752
1850-51 1194 124 48 60 169 227 248 261 303 342 2 2978
1851-52 1197 113 57 84 196 253 267 260 287 350 0 3064
1852-53 1135 94 37 59 179 258 268 297 320 393 0 3040
Sum of five year’s deaths 5801 616 278 363 1002 1283 1430 1427 1594 1786 17 15597
Deaths of five years in their Local Distri- bution. - East London Union 2471 215 80 105 338 432 488 444 551 619 0 5743
West London Union 1416 141 75 122 305 376 405 393 420 398 1 4052
City of London Union 1914 260 123 136 359 475 537 590 623 769 1 5787
Uncertain Address * * * * * * * * * * 15 15
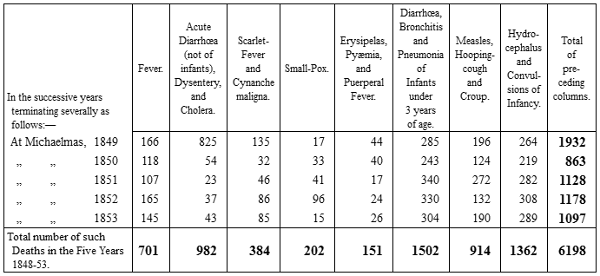
No. IX.—Number of Deaths occasioned, during the last Five Years, by certain Acute Diseases, chiefly Epidemic, Infectious, and Endemic.
In the successive years terminating severally as follows:— Fever. Acute Diarrhœa (not of infants), Dysentery, and Cholera. Scarlet- Fever and Cynanche maligna. Small-Pox. Erysipelas, Pyæmia, and Puerperal Fever. Diarrhœa, Bronchitis and Pneumonia of Infants under 3 years of age. Measles, Hooping- cough and Croup. Hydro- cephalus and Convul- sions of Infancy. Total of pre- ceding columns.
At Michaelmas, 1849 166 825 135 17 44 285 196 264 1932
„ „ 1850 118 54 32 33 40 243 124 219 863
„ „ 1851 107 23 46 41 17 340 272 282 1128
„ „ 1852 165 37 86 96 24 330 132 308 1178
„ „ 1853 145 43 85 15 26 304 190 289 1097
Total number of such Deaths in the Five Years 1848-53. 701 982 384 202 151 1502 914 1362 6198
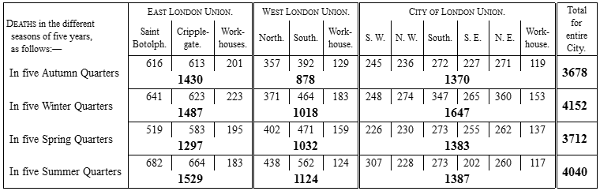
No. X.—Comparative Mortality in different seasons of the Year; namely, in the Autumn Quarters (Oct., Nov., Dec.) in the Winter Quarters (Jan., Feb., March,) in the Spring Quarters (April, May, June) and in the Summer Quarters (July, Aug., Sept.) of the Five Years from Michaelmas, 1848, to Michaelmas, 1853.
SYNOPSIS.
Deaths in the different seasons of five years, as follows:— East London Union. West London Union. City of London Union. Total for entire City.
Saint Botolph. Cripple- gate. Work- houses. North. South. Work- house. S. W. N. W. South. S. E. N. E. Work- house.
In five Autumn Quarters 616 613 201 357 392 129 245 236 272 227 271 119 3678
1430 878 1370
In five Winter Quarters 641 623 223 371 464 183 248 274 347 265 360 153 4152
1487 1018 1647
In five Spring Quarters 519 583 195 402 471 159 226 230 273 255 262 137 3712
1297 1032 1383
In five Summer Quarters 682 664 183 438 562 124 307 228 273 202 260 117 4040
1529 1124 1387
No. XI.—Comparative Mortality in Different Seasons of the Year.
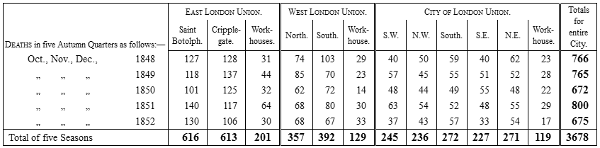
AUTUMN QUARTERS.
Deaths in five Autumn Quarters as follows:— East London Union. West London Union. City of London Union. Totals for entire City.
Saint Botolph. Cripple- gate. Work- houses. North. South. Work- house. S.W. N.W. South. S.E. N.E. Work- house.
Oct., Nov., Dec., 1848 127 128 31 74 103 29 40 50 59 40 62 23 766
„„„ 1849 118 137 44 85 70 23 57 45 55 51 52 28 765
„„„ 1850 101 125 32 62 72 14 48 44 49 55 48 22 672
„„„ 1851 140 117 64 68 80 30 63 54 52 48 55 29 800
„„„ 1852 130 106 30 68 67 33 37 43 57 33 54 17 675
Total of five Seasons 616 613 201 357 392 129 245 236 272 227 271 119 3678
No. XII.—Comparative Mortality in Different Seasons of the Year.
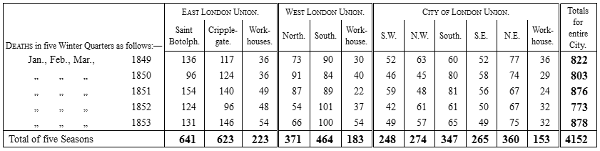
WINTER QUARTERS.
Deaths in five Winter Quarters as follows:— East London Union. West London Union. City of London Union. Totals for entire City.
Saint Botolph. Cripple- gate. Work- houses. North. South. Work- house. S.W. N.W. South. S.E. N.E. Work- house.
Jan., Feb., Mar., 1849 136 117 36 73 90 30 52 63 60 52 77 36 822
„„„ 1850 96 124 36 91 84 40 46 45 80 58 74 29 803
„„„ 1851 154 140 49 87 89 22 59 48 81 56 67 24 876
„„„ 1852 124 96 48 54 101 37 42 61 61 50 67 32 773
„„„ 1853 131 146 54 66 100 54 49 57 65 49 75 32 878
Total of five Seasons 641 623 223 371 464 183 248 274 347 265 360 153 4152
No. XIII.—Comparative Mortality in Different Seasons of the Year.
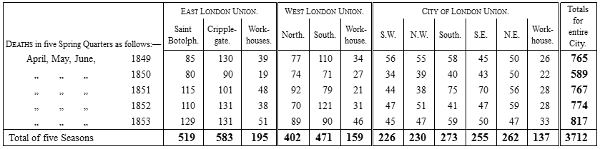
SPRING QUARTERS.
Deaths in five Spring Quarters as follows:— East London Union. West London Union. City of London Union. Totals for entire City.
Saint Botolph. Cripple- gate. Work- houses. North. South. Work- house. S.W. N.W. South. S.E. N.E. Work- house.
April, May, June, 1849 85 130 39 77 110 34 56 55 58 45 50 26 765
„„„ 1850 80 90 19 74 71 27 34 39 40 43 50 22 589
„„„ 1851 115 101 48 92 79 21 44 38 75 70 56 28 767
„„„ 1852 110 131 38 70 121 31 47 51 41 47 59 28 774
„„„ 1853 129 131 51 89 90 46 45 47 59 50 47 33 817
Total of five Seasons 519 583 195 402 471 159 226 230 273 255 262 137 3712
No. XIV.—Comparative Mortality in Different Seasons of the Year.
SUMMER QUARTERS.
Deaths in five Summer Quarters as follows:— East London Union. West London Union. City of London Union. Totals for entire City.
Saint Botolph. Cripple- gate. Work- houses. North. South. Work- house. S.W. N.W. South. S.E. N.E. Work- house.
July, Aug., Sep., 1849 171 199 73 148 295 33 145 77 86 77 73 18 1395
„„„ 1850 102 93 26 74 65 18 39 39 43 31 43 22 595
„„„ 1851 123 105 38 76 73 11 40 39 53 36 42 27 663
„„„ 1852 160 116 26 74 77 31 44 32 49 26 54 28 717
„„„ 1853 126 151 20 66 52 31 39 41 42 32 48 22 670
Total of five Seasons 682 664 183 438 562 124 307 228 273 202 260 117 4040