Test Plantings of Thomas Black Walnut in the Tennessee Valley
Reading edition
SPENCER B. CHASE, Tennessee Valley Authority
Native black walnut occurs abundantly throughout most of the Tennessee Valley. Practically every farmer has at least one "favorite tree" and each fall he collects nuts from that tree and stores them for cracking during the winter. In some sections of the Valley walnut cracking in the home is of considerable importance. Each year, some million and a quarter pounds of kernels are cracked out at the five modern cracking plants located in or adjacent to the Valley. Utilization of the crop is becoming more and more complete.
In early studies of native nut trees, TVA recognized the possibilities of black walnut, especially the improved varieties. Here was a tree that produced not only valuable nut crops but also cabinet wood without equal; in addition, it was a desirable pasture shade tree. Black walnut has long been a favorite among farmers, but few of them had ever heard of improved black walnuts. Along with TVA, the state agricultural extension services saw the advantages of the improved varieties and were eager to test them under Valley conditions. And so it was that a cooperative testing project was developed. TVA produced the trees and the seven Valley state extension services distributed them to farmers for test planting.
The Test
The Thomas walnut was used in these test plantings for several reasons. In the first place, it produces large, rather thin-shelled nuts with good cracking qualities. Few varieties are more easily cracked with a hammer or a hand-operated cracking machine. In addition, fast growth is characteristic of the variety and it should produce merchantable sawlogs earlier than the common walnut. Despite its northern origin, 5-year-old plantings at Norris, Tennessee, seemed well adapted to Valley conditions. No other variety at the time offered as many advantages.
Test planting was begun in Tennessee in 1939 and then it was extended to the other Valley states as more trees were propagated. For the most part, planting sites were selected by extension foresters and county agents. If the tests were successful they would automatically become demonstrations, so special attention was given those areas where walnut cracking in the home was an important enterprise. Many of the test plantings were located in communities that had been organized for the study and application of improved farming methods. In general, farmers planted the trees in low, fertile spots not suitable for other uses, along fences, or in pastures if they could be protected from livestock.
Through 1946, 9,614 trees were planted in 3,286 test plantings. They were scattered all over the Valley, in 92 of its 125 counties. The number of trees per planting varied with the availability of good walnut sites. Generally, there were 2 to 4 trees in each planting.
The Results
Getting survival and performance data on these widely scattered experimental plantings presented quite a problem. Examination of a few plantings showed that trees given reasonable care had survived and were beginning to bear nuts. So in 1946, the farmers who had planted the trees were polled by mail for an overall evaluation of the plantings. Questionnaires asking for information on survival, growth, and bearing were sent by the state extension foresters to 3,274 farmers. The return of questionnaires was excellent. Forty-two percent came back and three-fourths of them were filled out completely.
Survival and Mortality Causes. Eighty-one percent of the 1,373 plantings reported on were still active in 1946; that is, they still had at least one living tree. Survival reports received on 3,831 trees planted showed that 2,439 or 64 percent of the trees were living in 1946. Survival was best in the portion of the Valley north and east of Chattanooga; 84 percent in Virginia, 71 percent in North Carolina, and 66 percent in eastern Tennessee. South and west of Chattanooga survival percent was lower: 62 in Georgia, 61 in western Tennessee, 54 in Kentucky, 45 in Alabama, and 26 in Mississippi (Table 1).
Causes of mortality, as reported, were classified in five categories; losses prior to establishment, livestock and destruction, drought, insects and disease, and unknown (Table 1). Cause of mortality was listed as unknown for 42 percent of all trees reported dead. Field experience leads us to believe that most of the trees in this category probably succumbed to improper planting or complete neglect following planting. Many persons do not follow planting instructions; they often substitute their own methods with disastrous results.
Among the reported known causes, drought killed most of the trees—29 percent. We know black walnut is very susceptible to dry weather after transplanting. Weather records for the area show that the early growing season of 1941 was exceptionally dry; 1942 was also drier that average; in 1943 and 1944 near drought and drought conditions prevailed throughout most of the Tennessee Valley. Weather is usually blamed when a tree dies without apparent cause, but in this case the reported mortality due to drought appears reasonable.
Livestock, mowing, fire, and intentional removal were reported to have caused 13 percent of total mortality. Cows are curious animals and newly set trees seem to arouse all the curiosity in their make-up. Horses and cows apparently do not relish the foliage of walnut trees but they do bite at it, and in so doing usually break down the branches to such an extent that the tree dies. Some trees were accidentally destroyed simply because they had been forgotten. The next highest mortality cause reported was pre-establishment loss; this was blamed for 9 percent of the deaths. Losses resulting from delayed planting were placed in this category, also those where the report was "trees failed to leaf out." Insects and diseases were reported as causing 7 percent of the mortality.
Growth and Bearing. Those who plant improved black walnut trees naturally want to know how soon they will begin bearing. This survey shows that bearing begins much earlier than most people thought. Trees in 32 percent of the plantings established between 1939 and 1944 were bearing by 1946. Of these 342, 113 began bearing 2 to 4 years after planting; 120 bore their first crop after 5 years; 109 began bearing after 6 to 8 years (Table 2). According to the reports, the earlier plantings were slower to come into bearing than the later plantings. This probably is not a true picture. We suspect that after six or eight years the actual date of first bearing had been forgotten in many cases.
Growth was reported in terms of total height for each tree. These heights were then converted to annual growth rates for trees 3 to 8 years old and placed in arbitrary classes are follows: low (less than 1 foot) medium (1 to 2 feet), and high (over 2 feet). Test plantings in North Carolina had the highest growth rate; those in Mississippi, the lowest. In other states, growth rates fell between these two and were quite similar for the most part (Table 3). Average for all trees was 1.6 feet per year. Trees averaging less than one foot of height growth per year were slow to come into bearing. Only 14 percent of the trees in the low growth rate class were bearing. On the other hand, 71 percent of the trees with a high growth rate had come into bearing. Growth of black walnut, following recovery from transplanting shock, depends on site conditions and tree care. Trees set in fertile soil with an adequate moisture supply and kept free of livestock and other damage make rapid growth. Trees set in poor, thin or droughty soil do not make much growth if they survive at all. Black walnut is very sensitive to any wounds and, if subject to mechanical or livestock damage, growth is retarded.
Cases of exceptional growth and bearing were reported. One in eastern Tennessee is worthy of brief description. There were two trees in this planting set approximately 40 feet apart. One was on the edge of a garden; the other, in a chicken run. In seven years the first tree grew to a height of 32 feet—an average growth of 4.5 feet a year. It began bearing in 1943 and produced a crop of nuts each year up to the time of the survey. The 1946 crop, reported as a light one, yielded 3.5 pounds of kernels. The other tree, shown in Figure 1, was 18 feet tall, having averaged 2.5 feet a year. It also began bearing annual crops in 1943, and in 1946 it had a very heavy crop for its size, yielding 2.5 pounds of kernels. Here are two Thomas trees of the same age planted practically side by side; one is almost twice the size of the other, but they both began bearing annual crops three years after planting.
Field Survey in Sample Area. To check on the adequacy of the questionnaire survey, 108 test plantings in eastern Tennessee were visited and inspected. Forty of these had been reported on by mail; 68 had not. In general, the trees had been planted on the best sites available. Some were set out in farm orchards (Figure 2); a large number were planted in yards as combination nut and shade trees (Figure 3).
Field examination of the 40 plantings which had returned questionnaires revealed conditions very similar to those reported (Table 4). Survival was found to be 75 percent compared with a reported 77 percent. Average tree height was reported as 9 feet; actual height averaged 11 feet. There was some hesitancy in reporting tree deaths caused by livestock; 4 percent was reported while 23 percent was found. Such mortality was usually listed as unknown on questionnaires.
Information collected by field examination of 68 plantings which had not returned questionnaires and the 40 plantings which had returned questionnaires is shown in Table 4. Trees were found to be 2 feet taller in the 68 plantings but these trees averaged one year older than trees in the 40 plantings. Trees in the 68 plantings averaged 13 feet in height compared with 11 feet. Average age at first bearing was very similar. And here is a revealing discovery; livestock, mowing, and fire were responsible for 47 percent of the tree mortality in the 68-planting group, compared with 23 percent in the 40 plantings. This is perhaps one reason why the persons involved in these 68 plantings did not return questionnaires; it also explains most of the poorer survival. A large number of trees were planted in pastures and elsewhere without adequate protection from livestock. Even when cattle guards were used they were generally too small or weak for tree protection. Severe livestock damage resulting in poor growth and eventual death of trees was encountered frequently. We are inclined to believe that livestock accounted for a much higher percent of tree mortality than that reported in this survey.
The high percent return of questionnaires in this survey, followed by a field check in a sample area, provides a good picture of Valley-wide plantings. Since survival was found to be lower in plantings which did not return questionnaires, an actual overall survival of 64 percent may be slightly high. Other spot checks in the field will give more information on this point.
Discussion
Interest in improved black walnut is mounting in the Valley. As the test plantings came into bearing farmers were quick to see the superiority of these nuts over the wild ones to which they had been accustomed. Word spread from farm to farm, and as a result there has been an increasingly large number of inquiries about sources of improved varieties and cultural treatments. The interest was reflected in the questionnaire survey. Nineteen percent of the questionnaires returned contained unsolicited comments of one kind or another. A large percentage of them showed evidence of interest such as: "the nuts are large and easy to crack," "where can I get more grafted trees?" Only 7 percent implied disinterest: "the trees are slow growing," "the nuts are faulty."
This test-planting project will be completed in 1948. The plantings have already yielded much valuable information on the Thomas variety; they will yield much more as the trees become older. Further studies are planned on nut yield, nut quality, and tree growth in relation to the varying conditions existing in the Tennessee Valley.
Summary
Farmers in the seven Tennessee Valley states established 3,286 test plantings of Thomas black walnut in cooperation with state extension services and TVA during the period 1939-1946. A questionnaire survey in 1946 showed 81 per cent of the plantings still active and 64 percent of the trees living. Tree growth averaged 1.6 feet per year. Age at first bearing varied from 2 to 8 years, with 5 years most frequently reported.
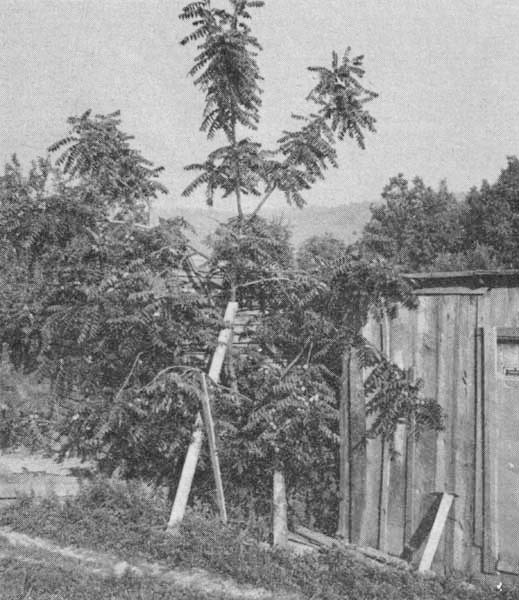
Figure 1. The Thomas variety appears well adapted to Tennessee conditions. This 7-year-old tree began bearing annual crops 3 years after planting. In 1946 it was 18 feet tall and heavily laden with nuts yielding 2½ pounds of cracked-out kernels. (Hancock County, Tenn.)
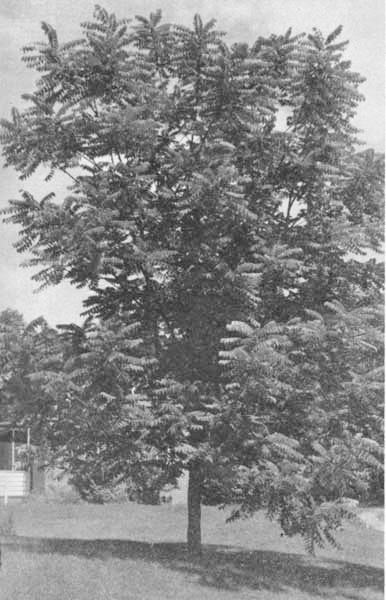
Figure 2. Black walnut makes an ideal combination nut and ornamental tree. This 8-year-old Thomas has been producing nut crops for 3 years. In addition, it has enhanced the beauty of the lawn and provided welcome shade. (Anderson County, Tenn.)
Table 1.—Number of Questionnaires Sent and Returned, Reported Tree Survival and Cause of Tree Mortality by State.
QuestionnairesTrees Reported
StateSentReturnedPlantedLiving
no.pct.no.pct.
Alabama1614427445
Georgia50282662
Kentucky1744924154
Mississippi19587226
North Carolina5864073371
Tennessee, East1,386401,51666
Tennessee, West7204480961
Virginia1804816084
All3,276423,83164
Figure 3. Thomas tree planted in the farm orchard. This young tree has received excellent care and began bearing at 5 years of age. (Hancock County, Tenn.)
Transcriber's note:
It is regretted that Fig 3 was unable to be placed.
Reported cause of tree mortality
Pre- establishmentLivestock, destructionDroughtUnknownInsects, diseasesTotal Planted Trees Lost
pct.pct.pct.pct.pct.no.
Ala.11751229150
Ga.30100204010
Ky.2246446112
Miss.1944902853
N. C.1516121344223
Tenn. (E.)71820748515
Tenn. (W.)8938738318
Va.32121244025
All913297421,406
Table 2. Number of Bearing Thomas Plantings Established 1939-44, by Age of First Bearing and Growth Class.
PlantingsAge in years at first bearingGrowth rate
YearNumber2345678LowMediumHigh
193927 1610641197
1940112 214394116 95845
19418914173532 15830
1942711121840 13436
19433811324 12116
19445 5 23
All342336741208322413192137
Table 3. Tree Survival, Growth, and Percent Bearing by State and Year of Planting
StatePlantings reported numberTrees, numberGrowth, feetBearing percent
Alabama711241.665
Georgia14161.518
Kentucky851291.571
Mississippi11191.029
North Carolina2355181.925
Tennessee, East5531,0071.532
Tennessee, West3184911.632
Virginia861351.60
Year of planting
1939, 19402556271.664
1941, 19424996931.644
1943, 19443265581.618
1945, 19462935611.50
All1,3732,4391.632
Table 4. Data Obtained from Returned Questionnaires and Actual Field Examination of 40 Plantings and Field Data Only on 68 Plantings.
Data on 40 PlantingsData on 68 Plantings
QuestionnaireFieldField
Tree Survival, percent777551
Average Height, feet91113
Cause of Tree Mortality, percent
Pre-establishment334211
Livestock and Other Destruction42347
Drought1300
Insects and Diseases842
Unknown423140