Diagrams
Reading edition
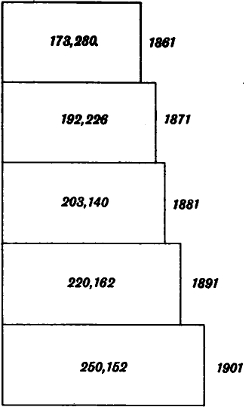
Fig. 1. Diagram showing the increase in the population of Hertfordshire from 1861 to 1901
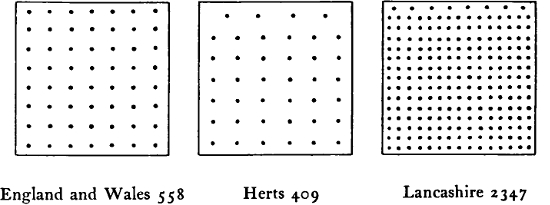
Fig. 2. Comparative density of the population of Hertfordshire to the sq. mile in 1901. Each dot represents 10 persons
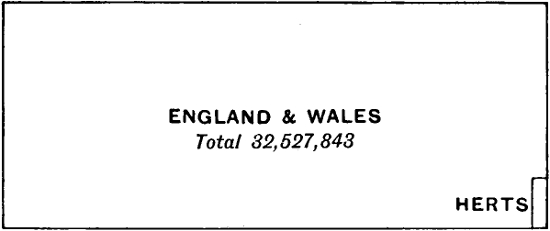
Fig. 3. The population of Herts (258,423) as compared with that of England and Wales
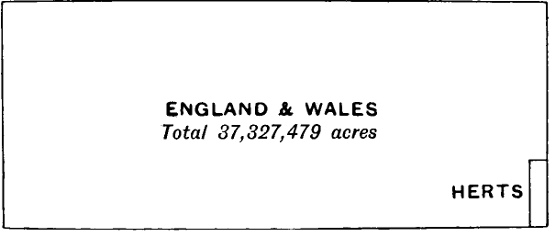
Fig. 4. The area of Herts (404,518 acres) as compared with that of England and Wales
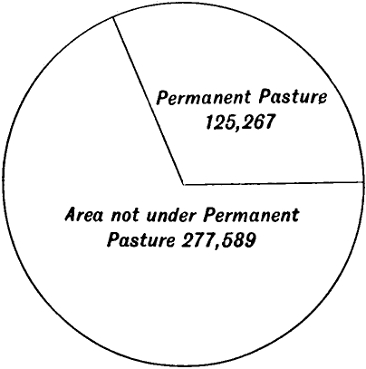
Fig. 5. Proportionate area of Permanent Pasture to total area of County
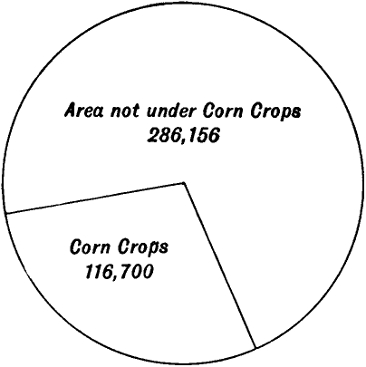
Fig. 6. Proportionate acreage of Corn Crops to total area of County
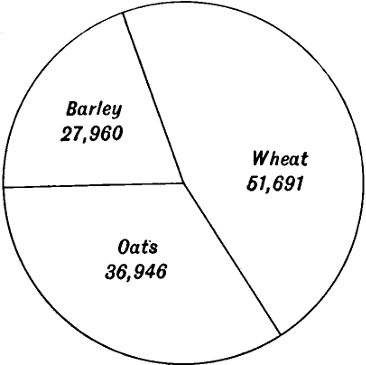
Fig. 7. Proportionate acreage of Oats, Wheat, and Barley in Herts
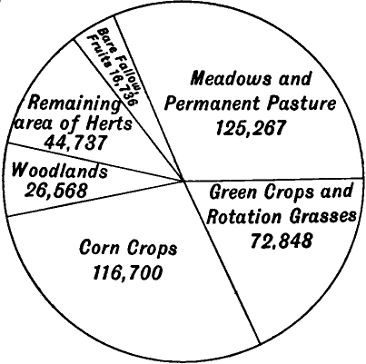
Fig. 8. Proportionate acreage of land under Cultivation and Not under Cultivation in the County
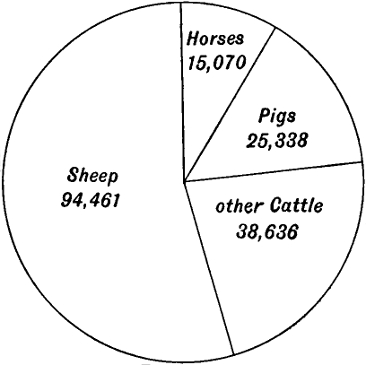
Fig. 9. Comparative numbers of Live Stock in Herts
Cambridge:
PRINTED BY JOHN CLAY, M.A. AT THE UNIVERSITY PRESS.