Part 1 — CHAPTER VIII. SCHOOL RETARDATION AMONG DELINQUENTS
Reading edition
A. In Minneapolis
Besides the estimates of deficiency based on tests, the school records may furnish valuable objective evidence about mental retardation among delinquents. The school environment is the first prominent social environment to which the child must adjust himself. If he fails in this while in regular attendance we have an important indication of mental deficiency. With laws which require attendance at school, we may even estimate the mental character of groups, on the basis of success in school, provided that we use proper caution as to the effects of late entrance and of absence from school. Moreover, whether retardation in school shows mental deficiency or not, it certainly sets forth a vital problem in connection with delinquency. We shall first consider the school retardation of delinquents and leave the problem of checking the tests by school records until later.
In order to study school retardation we tabulated the school position of 236 boys and 95 girls consecutively found delinquent in the Minneapolis juvenile court. To make the results more significant we did not include any cases dismissed at their hearing in court. Comparison with more serious delinquents is made by means of the group of 100 juvenile repeaters and 123 from the Glen Lake Farm School. The school position and actual age of each delinquent was compared with the age and grade distribution among Minneapolis elementary school children. The latter was determined by a census made the same year the returns for which included about 15,000 of 178each sex (see Table XII).[31] The ages and grades were recorded for the beginning of September, when the school year opens, and the census was taken late in the year after all the children had been registered in school. That different groups can only be properly compared when the age-grade distributions are made for the same time in the year is clear when one remembers that the ages are changing throughout the school year while the grades remain the same for at least half the year. The census was taken for another purpose so that it unfortunately does not include the high school pupils. Since the frequency and amount of retardation increases for older ages which occur relatively more frequently in the groups of delinquents the comparison somewhat exaggerates the difference between the groups. This difference in the relative ages of the groups is allowed for, however, in a later table on which the discussion will be based. The school positions of the various groups of delinquents and of ordinary school children are given in Table XIII and graphically in Figure 2.
TABLE XII.
Age and Grade Distribution in September of Pupils in the Elementary Schools of Minneapolis
BOYS
Ages
Grades 5 6 7 8 9 10 11 12 13 14 15 16 17 18+ Totals
I 61 1656 629 144 44 7 4 4 4 2 1 2556
II 1 151 979 650 221 92 28 11 4 2 1 2140
III 12 169 724 606 290 106 44 9 10 4 3 2 2140
IV 140 628 635 344 184 66 34 13 2 2046
V 2 120 489 541 371 190 88 36 9 1 1847
VI 5 94 428 594 380 223 96 20 1 1 1842
VII 7 97 422 458 397 204 60 6 2 1635
VIII 112 308 499 346 142 27 6 1444
62 1819 1777 1650 1624 1614 1552 1742 1419 1235 702 236 45 12 15489
GIRLS
Ages
Grades 5 6 7 8 9 10 11 12 13 14 15 16 17 18+ Totals
I 45 1642 493 117 38 9 6 3 1 1 1 1 2356
II 143 890 582 159 63 27 6 5 1 1 1877
III 10 165 755 553 193 77 27 12 4 1796
IV 6 168 727 618 290 132 446 18 8 1 2014
V 12 133 573 611 309 131 44 15 4 1 1833
VI 7 132 493 519 330 179 80 17 1 3 1761
VII 6 113 447 554 342 173 29 5 2 1671
VIII 6 109 432 577 348 96 12 8 1588
45 1795 1554 1634 1617 1594 1623 1552 1510 1166 626 146 18 16 14896
179TABLE XIII.
Retardation in School of Groups of Consecutive Juvenile Delinquents in Minneapolis Compared with Pupils in the Elementary Schools, the Difference in the Relative Ages of the Groups Being Disregarded
Summary Percentages
BOYS Number Retardation Advanced Satisfactory Retarded
Per Cent Av. Am't 2 1 1 2 3 4 5 6 7 8 9
Ordinary pupils 15489 70 0.37 Yr. 0.2 6.1 36.3 30.0 15.9 7.6 2.7 1.2
Ordinary delinquents 236 27 1.34 Yr. 2.5 9.7 17.4 30.1 24.6 9.7 3.4 1.3 0.9 0.4
Recidivists 100 74 1.77 Yr. 1.0 1.0 6.0 18.0 17.0 25.0 18.0 11.0 3.0
County Farm School 123 68 1.66 Yr. 0.8 13.8 17.1 22.8 21.1 15.4 5.7 3.3
GIRLS
Ordinary Pupils 14879 23 0.27 Yr. 0.3 6.8 40.0 30.2 14.0 5.9 1.8 0.
Ordinary Delinquents 95 91 2.57 Yr. 1.1 0.0 2.1 5.3 15.8 32.6 20.0 8.4 9.4 1.1 2.1 2.1
180
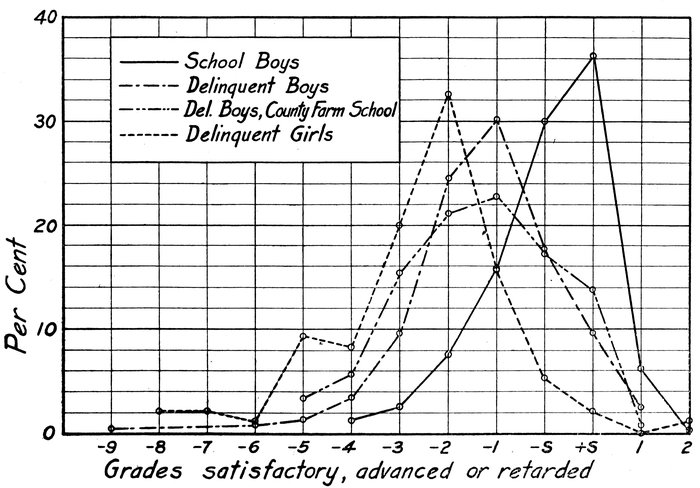
Fig. 2. School Retardation of Minneapolis Delinquents Compared With Elementary School Boys.
181In the Minneapolis group of elementary school children it will be found that there is about as much chance of a child being in either of the two most common ages for a grade. Among the boys, for example, 36% were in the series represented by age 6 in the first grade, 7 in the second grade, 8 in the third grade, etc., while 30% were in the series represented by one year older for each grade. It is, therefore, reasonable to regard either 6 or 7 as a satisfactory age in the first grade, 7 or 8 in the second, when one estimates the amount of retardation in this group. The allowance of two ages as satisfactory for a grade is in conformity with the practise of Strayer (189). The necessity of taking these ages at either the beginning or the end of the school year, and not merely “in the grade,” is emphasized by the report of the New York City Committee on School Inquiry (72). Ayres (71) also considers only those pupils over-age who are over 7 in the first grade, 8 in the second, etc., so that this may be regarded as fairly well established as a standard for measuring the retardation in school position of groups of children.
The summary of results in Table XIII shows that 70% of the ordinary delinquent boys were retarded in school position as compared with 27% among the Minneapolis boys in the elementary schools, 91% of the ordinary delinquent 182girls as compared with 23% of the Minneapolis girls of these schools. When one compares the age distribution of the delinquent groups, given in Table XIII with that of the Minneapolis school children in Table XII, it is clear that an allowance should be made for the much larger proportion of older children in the delinquent groups. This may be done by determining the percentage retarded at each age and in each group and then calculating indices of retardation by weighting the percentage retarded at each age in the proportion to the number of delinquents at that age. Table XIV gives these results for the ages 8 to 15 inclusive.
For example, in calculating the indices 39 and 70 for the frequency of retardation among ordinary delinquent boys as compared with elementary school boys, the percentages retarded at each life-age for each of these groups was multiplied by the number of ordinary delinquent boys at this age, as shown lower in the table, and the totals divided by the number of ordinary delinquents, 213. The average frequency of the retardation of a school group which compares in ages with the delinquent group was thus determined. In calculating the indices of amount of retardation the same procedure is followed except that the average number of years retarded is found for each age and this is multiplied by the number of delinquents at that age. The 16-year-olds are omitted because of the inadequacy of the school census for this age. According to the standard which regards 7 years as satisfactory in the first grade there can be no retardation under eight years of age. Since some of the pupils 13 years of age and over have reached high school and so do not show in the Minneapolis table the percentage of retardation for children 13-15 years is based on the assumption that the number of children at these ages will be the same as the average number for 11 and 12 years. No credit could be allowed for those advanced in school positions on account of the incompleteness of the Minneapolis census for older ages. The comparison is, therefore, on the basis of retardation alone.
183TABLE XIV.
Indices of Frequency and Amount of School Retardation of Minneapolis Juvenile Delinquents Compared with Minneapolis School Children of Corresponding Ages.
(Age 7 or younger regarded as satisfactory in the first grade.)
RETARDATION
Percentage Retarded at Each Life-Age
Index 8 9 10 11 12 13 14 15
School Boys 39% 8 16 24 31 35 40 45 43
Delinquent Boys 70% 0 44 50 67 58 60 77 93
School Boys 36%
Glen Lake Boys 86% 17 50 46 66 81 61 87
School Girls 35% 7 12 16 25 31 33 37 93
Delinquent Girls 90% 0 100 50 50 75 83 95 100
Index Average Amount of Retardation in Years
School Boys .61 Yr. .09 .19 .31 .43 .54 .63 .78 .64
Delinquent Boys 1.27 Yr. .00 .66 .50 .86 1.09 1.11 1.23 2.11
School Boys .54 Yr.
Glen Lake Boys 1.54 Yr. .17 .50 .62 1.25 1.86 2.11 2.03
School Girls .64 Yr. .07 .15 .22 .34 .45 .50 .59 .82
Delinquent Girls 2.29 Yr. .00 1.00 1.00 1.00 1.25 2.25 2.05 2.84
Totals Number of Children at Each Life-Age
School Boys 13,123 1650 1624 1614 1552 1742 1647 1647 1647
Delinquent Boys 213 3 9 6 21 25 47 56 46
Glen Lake Boys 108 0 6 8 13 12 21 18 30
School Girls 12,781 1634 1617 1594 1623 1552 1587 1587 1587
Delinquent Girls 82 2 1 2 2 4 12 21 338
Index equals the sum of retardation at each age multiplied by the number of delinquents at that age divided by the total number of delinquents.
From the indices of frequency of retardation in Table XIV it will be seen that retardation of one or more years below the standard of age 7 in the first grade is nearly twice as common among the ordinary delinquent boys as among a group of school boys of corresponding ages, while it is fully 2½ times as great among the ordinary girl delinquents as among a corresponding group of school girls, when estimated on the same basis.
To understand the significance of this comparison one should consider the relative difference which is shown between school children and delinquents in the statistics of health, defective sight, nose and throat obstructions, etc. The percentages of consecutive delinquents showing 184other defective or diseased conditions has never, so far as the writer is aware, been found to be double that among the school children generally when figured on a corresponding basis. Medical inspection shows that for other conditions than retardation the frequency of defects and disease found among representative groups of ordinary juvenile delinquents can often be equaled in the poorer schools of the city. To find a factor relatively twice as common among delinquents as among school children, when the frequencies are as great as with retardation, means a variation that is unquestionably significant. This is, of course, not an argument against the detection and treatment of handicaps that can be benefited by the physician. It only suggests the relative size of the two problems.
In considering the frequency of school retardation among delinquents in Minneapolis, it will be noted that the most serious condition is clearly among the girls, 90% of whom are below grade as compared with the index of 35% for the corresponding group of school girls.
One may estimate that the chance of a Minneapolis boy who is retarded in school getting into juvenile court is about 3½ times that of a boy who is up-to-grade. But the chance of a girl who is retarded in school getting into juvenile court is about 17 times as great as that of a girl who is up to grade. This calculation is easily made on the assumption that the indices of Table XIV are typical for a single year, knowing that about 194 in 10,000 school boys in Minneapolis get into the court annually and 21 in 10,000 school girls.
The best measure of the difference in school attainment cannot be shown, however, without considering the amounts instead of the frequency of retardation in the groups compared. We should regard two years retardation 185as twice as serious as one year and make a corresponding allowance for each additional year of retardation. Thus weighting our results we find in the indices of Table XIV that the boys 8-15 years of age in the Glen Lake Farm School group of delinquents have on the average lost 1.54 of a year through retardation in school attainment compared with the satisfactory standard of 7 in the first grade. The ordinary delinquent boys have lost on the average 1.27 of a year, while the indices for Minneapolis school boys of corresponding ages are—.54 and—.61 of a year respectively. Among the ordinary delinquent girls the average amount of retardation on the same basis is 2.29 years as compared with .64 of a year among the school girls of corresponding age distribution.
The indices for the amount of school retardation are the most significant figures in any of these tables, although they are based on too few numbers to afford more than rough comparisons. It is, however, a fairly reliable estimate to say that retardation in school attainment in Minneapolis is about twice as great among ordinary delinquent boys and among the detention home group while it is three times as great among ordinary delinquent girls as among corresponding groups of elementary school children. If we had been able to credit the groups with those in advance of the expected position for their ages the difference would have been even greater.
B. School Retardations Among Other Groups of Delinquents
In view of the fact that retardation in school offers an important check upon the question of the frequency of mental deficiency among groups, besides stating a different training problem of its own, it is curious that it has not been more systematically studied in connection with 186delinquency. Few investigations include any reference to the question. Auden (69) reports that among 263 committed to Borstal institutions (juvenile reformatories) in England for the year ending March 31, 1909, 71% (186) had not reached the fourth standard, corresponding to the fourth school grade. These were delinquents between 16 and 21 years of age. The next year 402 out of 554 (72%) had not reached the fourth grade. Not one person had reached the eighth grade and only 13 the seventh grade. In the Minneapolis detention home group only 23 out of the 103 over ten years of age were below the fourth grade.
Cornell gives the distribution of 236 boys in special disciplinary classes of two Philadelphia schools (93). These classes are for truant and difficult boys 8 to 14 years of age inclusive. While they are not technically delinquents the problem is similar and they show even more serious school retardation than the Minneapolis group. Summarizing his results according to the standard which counts ages six or seven as satisfactory in the first grade, and so on, we find 12.3% satisfactory; 12.3% retarded one year; 26.7% retarded two years; 30.1% retarded three years; 15.8% retarded four years; 2.5% retarded 5 years; and 0.4% retarded 6 years. Eighty-eight per cent. are thus behind a satisfactory position in the grades, and 48.8% three or more years behind. This is to be compared with 70 and 16% among ordinary Minneapolis delinquent boys (Table XIII).
Among 647 prostitutes at the Bedford (N. Y.) Reformatory 48% either could not read or write any language or had not finished the primary grades. Seven per cent. had graduated from the grammar grades. Among 610 prostitutes in other reformatories reported in the same work, only 23% had finished the fifth grade. Among 877 street 187cases from which information was obtained 814 had no more education than ability to read and write, 53 had graduated from the grammar grades or had some special education (133). Another report by Weidensall we shall consider in the next chapter.
The attending physician (60) of the Morals Court in Chicago inquired “of as many of the defendants as she could, who were charged with being public prostitutes, as to what ages they had left school.” Among 3546 cases which passed before the court in seven months the report covers 494 cases. Of these only 17 had gone beyond the fifth grade in school, only one was a high school graduate (161). Among 100 girls at the Ohio Industrial School, 11 to 18 years of age, median age 15 years, 50% were in the third or fourth grade and 54% had failed of promotion three or more times (55).
Drucker gives the age-grade distribution of 100 randomly selected minor offenders, 15 to 22 years of age, in the Cook County (Ill.) jail. This shows that 41 of these were below the eighth grade and three or more years retarded at the age they left school. They might well be examined for deficiency. Among 86 who left school at 14 or after, 24 were in the fifth grade or below (101). Among 100 consecutive admissions to the Ohio State Girls Industrial Home, Renz reports 25% in the third grade and 25% in the fourth grade, 15% in the fifth grade; 29% failed of promotion 4.5 to 6 years and 25% more failed of promotion 3 years (47). Storer reports on the same groups (55). Bluemel finds that 100 probationers in the Denver Juvenile Court were retarded in school 2 years on the average as compared with an average school retardation among the school boys of Denver of 1 year (2). At the New Jersey State Home for Girls among a group of 163 selected cases 102 had not reached the fifth grade although their average age was 17 (12).
188The school distributions by age is given for 215 delinquents in the California State School at Whittier for boys by Williams (62) in sufficient detail to make it usable for estimating the frequency of deficiency on a plan we shall consider shortly. Regarding age seven as satisfactory for the first grade, and so on, only 7 of these boys had reached this standard. Supposing that those older should have attained at least the grade which is satisfactory for the 14-year-old, and those younger the corresponding grades, we find that 29% were four or more years below this standard and 14% were five years below this standard. In the next section we shall endeavor to find out how the school records might also be used as symptomatic of mental capacity.
189