APPENDIX.
Reading edition
The following is extracted from Maxwell’s paper.
The following table contains the means of four sets of observations by the same observer (K.):—
Table IV. (K.)
44·3 (20) + 31·0 (44) + 27·7 (68) = W. 16·1 (28) + 25·6 (44) + 30·6 (68) = W. 22·0 (32) + 12·1 (44) + 30·6 (68) = W. 6·4 (24) + 25·2 (36) + 31·3 (68) = W. 15·3 (24) + 26·0 (40) + 30·7 (68) = W. 19·8 (24) + 35·0 (46) + 30·2 (68) = W. 21·2 (24) + 41·4 (48) + 27·0 (68) = W. 22·0 (24) + 62·0 (52) + 13·0 (68) = W. 21·7 (24) + 10·4 (44) + 61·7 (56) = W. 20·5 (24) + 23·7 (44) + 40·5 (60) = W. 19·7 (24) + 30·3 (44) + 33·7 (64) = W. 18·0 (24) + 31·2 (44) + 32·3 (72) = W. 17·5 (24) + 30·7 (44) + 44·0 (76) = W. 18·3 (24) + 33·2 (44) + 63·7 (80) = W.
X.—Reduction of the Observations.
By eliminating W from the equations above by means of the standard equation, we obtain equations involving each of the fourteen selected colours of the spectrum, along with the three standard colours; and by transposing the selected colour to one side of the equation, we obtain its value in terms of the three standards. If any of the terms of these equations are negative, the equation has no physical interpretation as it stands; but by transposing the negative term to the other side it becomes positive, and then the equation may be verified.
The following table contains the values of the fourteen selected tints in terms of the standards. To avoid repetition, the symbols of the standard colours are placed at the head of each column:—
Table VI.
Observer (K.) (24) (44) (68)
44·3 (20) = 18·6 + 0·4 + 2·8
16·1 (28) = 18·6 + 5·8 - 0·1
22·0 (32) = 18·6 + 19·3 - 0·1
25·2 (36) = 12·2 + 31·4 - 0·8
26·0 (40) = 3·3 + 31·4 - 0·2
35·0 (46) = - 1·2 + 31·4 + 0·3
41·4 (48) = - 2·6 + 31·4 + 3·5
62·0 (52) = - 3·4 + 31·4 + 17·5
61·7 (56) = - 3·1 + 21·0 + 30·5
40·5 (60) = - 1·9 + 7·7 + 30·5
33·7 (64) = - 1·1 + 1·1 + 30·5
32·3 (72) = + 0·6 + 0·2 + 30·5
44·0 (76) = + 1·1 + 0·7 + 30·5
63·7 (80) = + 0·3 - 1·8 + 30·5
Mr. James Simpson, formerly student of Natural Philosophy in my class, has furnished me with thirty-three observations taken in good sunlight. Ten of these were between the two standard colours, and give the following result:—
33·7 (88) + 33·1 (68) = W.
The mean errors of these observations were as follows:—
Error of (88) = 2·5; of (68) = 2·3; of (88) + (68) = 4·8; of (88) - (68) = 1·3.
The fact that the mean error of the sum was so much greater than the mean error of the difference, indicates that in this case, as in all others that I have examined, observations of equality of tint can be depended on much more than observations of equality of illumination or brightness.
From six observations of my own, made at the same time, I have deduced the “trichromic” equation—
22·6 (104) + 26 (88) + 37·4 (68) = W (2)
If we suppose that the light which reached the organ of vision was the same in both cases, we may combine these equations by subtraction, and so find
22·6 (104) - 7·7 (88) + 4·3 (68) = D (3)
where D is that colour, the absence of the sensation of which constitutes the defect of the dichromic eye.
The sensation which I have in addition to those of the dichromic eye is therefore similar to the full red (104), but different from it in that the red (104) has 7·7 of green (88) in it which must be removed, and 4·3 of blue (68) substituted. This agrees pretty well with the colour which Mr. PoleA describes as neutral to him, though crimson to others. It must be remembered, however, that different persons of ordinary vision require different proportions of the standard colours, probably owing to differences in the absorptive powers of the media of the eye, and that the above equation (2), if observed by K., would have been
23 (104) + 32 (88) + 31 (68) = W (4)
and the value of D, as deduced from these observers, would have been
23 (104) - 1·7 (88) - 1·1 (68) = D (5)
in which the defective sensation is much nearer to the red of the spectrum. It is probably a colour to which the extreme red of the spectrum tends, and which differs from the extreme red only in not containing that small proportion of “yellow” light which renders it visible to the colour blind.
From other observations by Mr. Simpson the following results have been deduced:—
Table A.
(88) (68) (88) (68)
(99·2 +) = 33·7 1·9 100 (96) = 108 7
31·3 (96) = 33·7 2·1 100 (92) = 120 5
28 (92) = 33·7 1·4 100 (88) = 100 0
33·7 (88) = 33·7 0 100 (84) = 61 11
54·7 (84) = 33·7 6·1 100 (82) = 47 21
71 (82) = 33·7 15·1 100 (80) = 34 33
99 (80) = 33·7 33·1 100 (78) = 22 47
70 (78) = 15·7 33·1 100 (76) = 10 59
56 (76) = 5·7 33·1 100 (72) = 1 92
36 (72) = 0·3 33·1 100 (68) = 0 100
33·1 (68) = 0 33·1 100 (64) = 0 83
40 (64) = 0·2 33·1 100 (60) = 3 60
55·5 (60) = 1·7 33·1
(57 -) = 0·3 33·1
In the table on the left side (99·2 +) means the whole of the spectrum beyond (99·2) on the scale, and (57 -) means the whole beyond (57) on the scale. The position of the fixed lines with reference to the scale was as follows:—
A, 116; a, 112; B, 110; C, 106; D, 98·3; E, 88; F, 79; G, 61; H, 44.
The values of the standard colours in different parts of the spectrum are given on the right side of the above table, and are represented by the curves of Fig. 9, Plate II., where the left-hand curve represents the intensity of the “yellow” element, and the right-hand curve that of the “blue” element of colour as it appears to the colour blind.
The appearance of the spectrum to the colour blind is as follows:—
From A to E the colour is pure “yellow,” very faint up to D, and reaching a maximum between D and E. From E to one-third beyond F towards G the colour is mixed, varying from “yellow” to “blue,” and becoming neutral or “white” at a point near F. In this part of the spectrum the total intensity, as given by the dotted line, is decidedly less than on either side of it, and near the line F, the retina close to the “yellow spot” is less sensible to light than the parts further from the axis of the eye. This peculiarity of the light near F is even more marked in the colour blind than in the ordinary eye. Beyond F the “blue” element comes to a maximum between F and G, and then diminishes towards H, the spectrum from this maximum to the end being pure “blue.”
The results given above were all obtained with the light of white paper, placed in clear sunshine. I have obtained similar results when the sun was hidden, by using the light of uniformly illuminated clouds, but I do not consider these observations sufficiently free from disturbing circumstances to be employed in calculation. It is easy, however, by means of such observations, to verify the most remarkable phenomena of colour blindness, as, for instance, that the colours from red to green appear to differ only in brightness, and that the brightness may be made identical by changing the width of the slit; that the colour near F is a neutral tint, and that the eye in viewing it sees a dark spot in the direction of the axis of vision; that the colours beyond are all blue of different intensities, and that any “blue” may be combined with any “yellow” in such proportions as to form “white.” These results I have verified by the observations of another colour-blind gentleman, who did not obtain sunlight for his observations; and as I have now the means of carrying the requisite apparatus easily, I hope to meet with other colour-blind observers, and to obtain their observations under more favourable circumstances.
Measurements of Colour Fields.
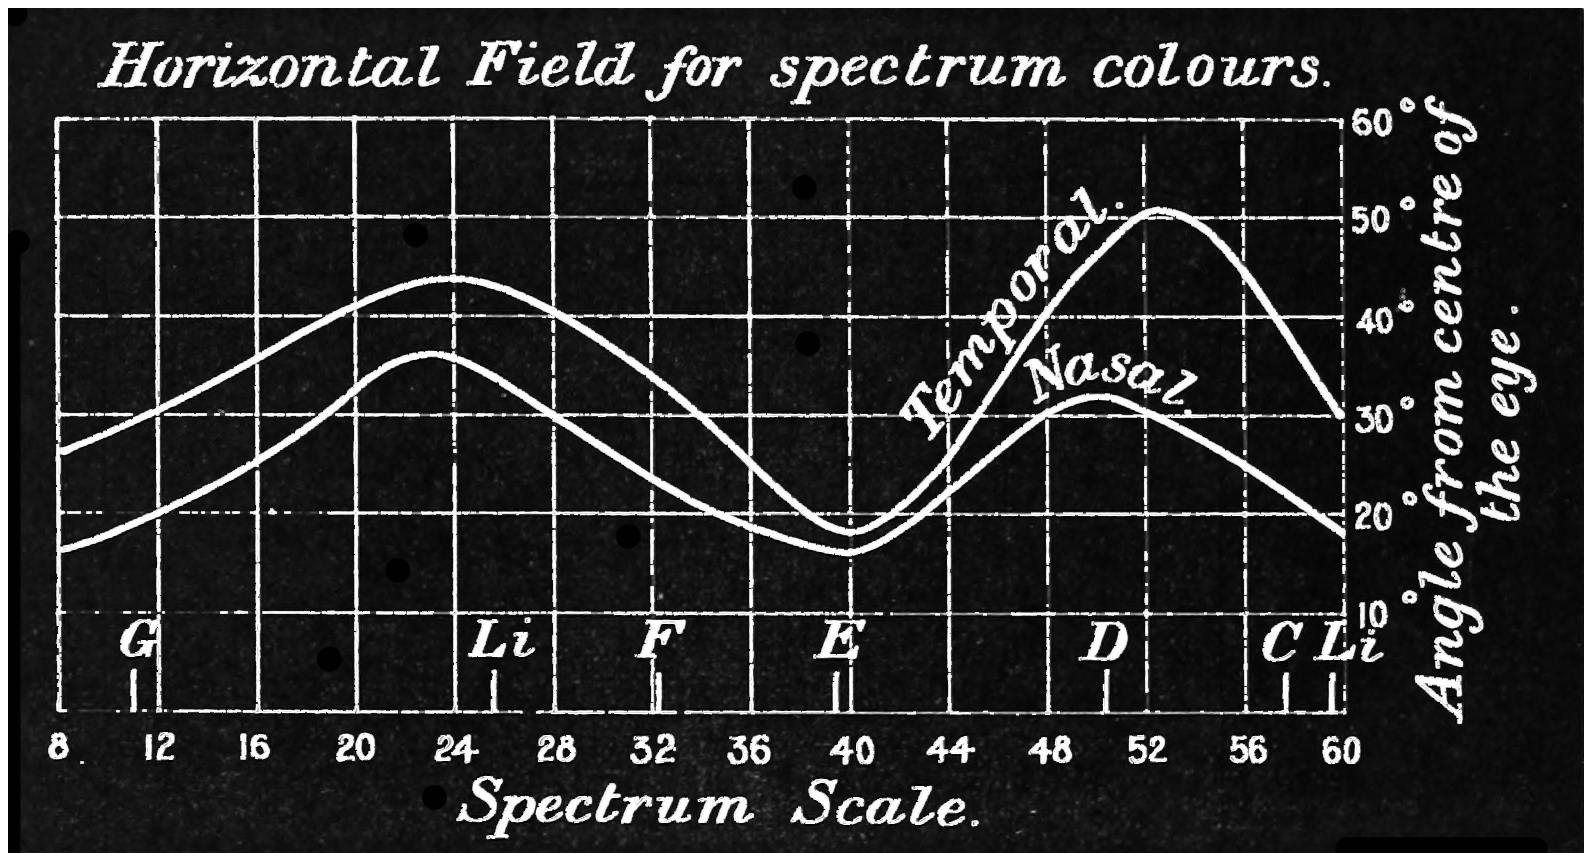
Some experiments in the measurement of the colour fields in the horizontal direction with the pure spectrum colours will help to show what importance is to be attached to the luminosity of the colour and the size of the spot of light with which the observations are made. A yellow and a blue of the spectrum were taken of such hues that when mixed they formed a patch of white light similar to the electric light. Their luminosities were measured, and the yellow found to be 1·6 of the light of an amyl-acetate lamp or 1·28 standard candles; the blue was 1/24 of this luminosity. The fields for these two colours were measured by automatically throwing spots of each colour separately on a white card which moved round a centre over which the eye was placed. The light was subsequently diminished to ½, ¼, and ⅛ of the above values, and readings again made. The following results were obtained with a spot of ·7 inch diameter:—
Light Yellow. Blue.
Nasal side. Temporal side. Nasal side. Temporal side.
Full 33° 45° 35° 45°
½ 24° 36° 26° 38°
¼ 18° 24° 22° 32°
⅛ 11° 15° 19° 30°
With a spot of ·3 inch diameter the following were obtained:—
Full 24° 32° 21° 27°
½ 17° 28° 16° 22°
¼ 13° 16° 14° 20°
⅛ 8° 10° 13° 16°
It will be evident how the field contracts as the light is diminished in brightness, and also that the blue field does not diminish equally with the yellow field, but is more persistent. Again, it will be noticed that the luminosity of the blue, for the same extent of field to be covered, has to be much lower than for the yellow.
The diminished area of the spot of light also diminishes the field, and the same order of diminution of field is obtained as with the larger spot.
Another set of experiments, made with the same aperture of slit passed through the spectrum, and the field taken at different points, give the following results:—
Spectrum scale. (See Fig. 41, Page 210. Nasal side. Temporal side.
58·6 18° 35°
54·6 27° 46°
50·6 33° 47°
46·6 25° 30°
42·6 21° 21°
38·6 17° 17°
34·6 22° 30°
30·6 25° 33°
26·6 33° 40°
22·6 37° 44°
18·6 28° 40°
14·6 22° 34°
8·6 20° 30°
Here we see that although the luminosity of the colour spots varies at the spectrum luminosity, the fields do not vary proportionally; when the luminosities of the green, yellow and red are made equal, the fields become nearly equal on the nasal side. The field for the blue, however, then becomes vastly larger than that for the others, showing a peculiarity which is very remarkable.
Fig. 41.
Spectrum Scale.
Recently published experiments on colour fields have been so largely based on the exigencies of the Hering theory, that it is somewhat difficult to decide their significance from any other aspect.
Table I.—Luminosity Curves for the Normal Eye (see Fig. 20).
I. II. III. IV. V.
Scale number. Wave- length. Outside yellow spot. Yellow spot. Fovea centralis.
64 7217
63 7082 .. 1
62 6957 1 2 2
61 6839 2 4 4
60 6728 3·5 7 8
59 6621 7·5 12·5 15·5
58 6520 12·5 21 24
57 6423 19 33 37·5
56 6330 27·5 50 60
55 6242 35 65 77
54 6152 43 80 90
53 6074 52·5 90 97
52 5996 61·0 96 100
51 5919 71·0 99 100
50 5850 79·0 100 98
49 5783 84 99 95
48 5720 85 97 90
47 5658 83·5 92·5 85
46 5596 81·0 87 79
45 5538 77·0 81 72·5
44 5481 72.5 75 66
43 5427 68·0 69 59
42 5373 62·5 62·5 51
41 5321 57 57 45
40 5270 52 50 40
39 5221 46 42·5 32
38 5172 41·5 36 27·5
37 5128 37·5 29·5 22·0
36 5085 33·5 24 18
35 5043 30·0 18·2 14
34 5002 26·5 14·2 10
33 4963 24 10·5 8·4
32 4924 21 8·5 6·5
31 4885 18·5 7·0 5·5
30 4848 16·5 5·5 4·0
29 4812 14·5 4·7 3·5
28 4776 13·0 4·0 3·0
27 4742 11·5 3·5 2·0
26 4707 10·5 2·8 2·4
25 4675 9·4 2·3 2·1
24 4639 8·2 1·82 1·9
23 4608 7·3 1·6 1·5
22 4578 6·3 1·4
21 4548 5·7 1·2
20 4517 5·0 1·08 1·0
19 4488 4·5 ·94
18 4459 4·0 ·86
17 4437 3·6 ·78
16 4404 3·1 ·70
15 4377 2·7 ·62 ·62
14 4349 2·3 ·56
13 4323 2·1 ·50
12 4296 1·9 ·45
11 4271 1·65 ·40
10 4245 1·4 ·34
9 4221 1·2 ·30
8 4197 1·0 ·26
7 4174 ·88 ·22
6 4151 ·75 ·18
5 4131 ·63 ·16
4 4106 ·50 ·14
Tables II. and III.—Curves of Luminosity of a Partially Red-Blind and of a Partially Green-Blind Person (see Fig. 23).
Scale number. Wave- length. Luminosity.
Red-blind. Green-blind.
64 7217 0 1
62 6957 1 2
60 6728 2 7
58 6520 6 21
56 6330 12 50
54 6152 26 80
52 5996 49 96
50 5850 70 98
48 5720 77 93
46 5596 77 83
44 5481 70 70
42 5373 61 55
40 5270 47 40
38 5172 34 27
36 5085 23 18
34 5002 14 10
32 4924 8·5 5·5
30 4848 5·5 3·0
28 4776 4·0 2·5
26 4707 2·7 2·0
24 4639 1·8 1·8
22 4578 1·35 1·4
20 4517 1·1 1·1
Table IV.—Luminosity of Spectrum Reduced in Intensity, so that D = 1/132·5 Amyl Lamp 1 Foot Distant (see Fig. 25).
Scale number. Mean reading. Mean reading, reduced to 100 max. P. and Q.’s readings, 100 max. Persistency curve for the centre of the eye.
55·6 ·5 ·6 2 2
53·6 5·5 7·0 3·6 3·6
51·6 13 16·7 8 8
49·6 23 29·7 22 22
47·6 40 50·0 44 44
45·6 57 71·2 69 69
43·6 70 87·5 93 93
41·6 79 98·7 100 99·5
39·6 78 97·5 99·5 98·5
37·6 74 92·5 96 93
35·6 66 82·5 89 84
33·6 55 68·7 77·5 71
31·6 44·5 55·2 61 53·5
29·6 35 43·7 45·5 36·5
27·6 24 30·0 33·5 24
25·6 17 21·7 25 16
23·6 13 16·7 18 10
21·6 10 12·5 13 8
19·6 8 10·0 9·5 6
13·6 3 3·7 4·2 3
9·6 2 2·5 2·5 2
Table V.—Limit of Colour Vision (see Fig. 26.).
Scale Number. Wave- Length. Mean reading of the colour limit of the spectrum D, being 1 amyl lamp in 1/10000ths. Luminosity of the ordinary spectrum. Luminosity of the rays when each colour disappears, each ray having the original luminosity of 1 amyl lamp in 1/100000ths.
61 6839 120 4 48·0
60 6728 67 7 46·9
58 6520 26 21 54·6
56 6330 13 50 65·0
54 6152 9·5 80 76·0
52 5996 9·0 96 86·4
50 5850 9·0 100 90·0
48 5720 9·0 97 87·3
44 5481 9·5 75 71·3
40 5270 10·5 50 52·5
36 5085 12·5 24 30·0
32 4924 18 8·5 15·3
28 4776 32 4·0 12·8
24 4639 55 1·8 12·0
20 4517 90 1·08 9·7
16 4404 160 ·70 11·2
12 4296 250 ·45 11·0
8 4197 400 ·26 10·4
4 4106 700 ·14 9·8
Table VI.—Extinction by Central Portion of Normal Eye (see Fig. 28).
I. II. III. IV. V. VI.
Scale number. Wave- length. E. Reduction of original luminosity in millionths to cause extinction. L. Luminosity of original beam. (E × L) / 100 Persistency curve 650 / E (Maximum = 100).
64 7217 55,000
63 7082 30,000 1 300·0
62 7957 15,000 2 300·0
61 6839 7500 4 300·0
60 6728 3750 7 262·5
59 6621 1900 12·5 237·5 ·34
58 6520 1050 21 220·5 ·62
57 6423 650 33 214·5 1·0
56 6333 380 50 190·0 1·71
55 6242 272 65 176·8 2·38
54 6152 196 80 156·0 3·32
53 6074 140 90 126·0 4·64
52 5996 97 96 93·12 6·70
51 5919 57 99 56·43 11·40
50 5850 35 100 35·0 18·6
49 5783 24 99 23·76 27·1
48 5720 17 97 16·49 38·2
47 5658 12·6 92·5 11·65 51·6
46 5596 10·2 87 8·87 63·7
45 5538 8·6 81 6·97 75·6
44 5481 7·4 75 5·55 87·8
43 5427 6·7 69 4·62 97·0
42 5373 6·55 62·5 4·09 99·5
41 5321 6·5 57 3·705 100
40 5270 6·55 50 3·27 98·5
39 5221 6·65 42·5 2·83 97·5
38 5172 6·85 36 2·46 95·0
37 5128 7·2 29·5 2·12 90·0
36 5085 7·6 24 1·82 81·3
35 5043 8·15 18·2 1·48 80·0
34 5002 8·8 14·2 1·25 74·0
33 4963 10·2 10·5 1·07 63·0
32 4924 11·6 8·5 ·988 56·0
31 4885 13·6 7·0 ·952 47·7
30 4848 16·3 5·5 ·896 40·0
29 4812 20·5 4·7 ·963 31·7
28 4776 26·0 4·0 1·040 25·0
27 4742 31·0 3·5 1·085 20·9
26 4707 38·5 2·8 1·078 16·9
25 4674 46·0 2·3 1·058 14·1
24 4639 56·0 1·82 1·019 11·6
23 4608 67·0 1·6 1·072 9·7
22 4578 80 1·4 1·120 8·41
21 4548 95 1·2 1·140 7·22
20 4517 107 1·08 1·156 6·1
19 4488 124 ·94 1·165 5·23
18 4459 140 ·86 1·204 4·64
17 4437 160 ·78 1·228 4·1
16 4404 180 ·70 1·260 3·60
15 4377 200 ·62 1·240 3·25
14 4349 220 ·56 1·232 2·95
13 4323 240 ·50 1·200 2·7
12 4296 270 ·45 1·215 2·4
11 4271 300 ·40 1·200 2·18
10 4245 335 ·34 1·139 1·94
9 4221 375 ·30 1·125 1·73
8 4197 430 ·26 1·118 1·51
7 4174 490 ·22 1·078 1·32
6 4151 510 ·18 ·918 1·27
5 4131 640 ·16 1·024 1·01
4 4106 750 ·14 1·050 0·86
Table VII.—Extinction by Whole Eye (see Fig. 28).
I. II. III. IV. V. VI.
Scale number. Wave- length. E. Reduction of original luminosity in millionths to cause extinction. L. Luminosity of original beam. (E × L) / 160 Persistency curve 650 / E (Maximum = 100).
38 5172 6·9 41·5 2·86 94·2
37 5128 7·1 37·5 2·66 91·6
36 5085 7·4 33·5 2·48 87·8
35 5043 7·7 30·0 2·31 84·4
34 5002 8·0 26·5 2·12 81·2
33 4963 8·4 24·0 2·02 77·5
32 4924 8·8 21·0 1·85 73·8
31 4885 9·4 18·5 1·74 69·2
30 4848 10·0 16·5 1·65 65·0
29 4812 10·7 14·5 1·55 60·6
28 4776 11·5 13·0 1·49 56·5
27 4742 13·0 11·5 1·49 50·0
26 4707 14·5 10·5 1·52 44·8
24 4639 18·5 8·2 1·52 34·1
22 4578 23·0 6·3 1·45 28·3
20 4517 30·0 5·0 1·50 21·7
18 4459 39·0 4·0 1·56 16·7
16 4404 51 3·1 1·59 12·3
14 4349 66 2·3 1·52 9·85
12 4296 80 1·9 1·52 8·12
10 4245 110 1·4 1·54 5·91
8 4197 154 1·0 1·54 4·22
6 4151 204 ·75 1·54 3·18
4 4106 307 ·5 1·54 2·11
2 4063 513 ·3 1·54 1·26
0 4020 770 ·2 1·54 ·84
From 38 to 64 the extinction is the same as with the central part of the eye.
Table VIII.—P.’s CurvesB (see Fig. 31).
I. II. III. IV. V. VI. VII.
Scale number. Wave- length. Mean reading of extinction in millionths of original luminosity. Adopted reading in millionths of original luminosity. Persistency curve (680 / ad. reading). P.’s luminosity curve. Absolute luminosity of extinction. (IV. × VI.) / 14
52 5996 68 68 10 7 34
50 5850 35 35 19·4 19 47·5
48 5720 17 17 40 39 47·3
46 5596 10·2 10 68 65 46·4
45 5538 9·3 9·0 76 76 48·8
44 5481 8·0 8·1 84 90 52·8
42 5373 7·2 7·2 94·5 98 50·3
40 5270 6·7 6·8 100 99 48·1
38 5172 7·2 7·0 97 97·5 48·7
36 5085 8·05 7·7 90 90 49·5
34 5002 8·05 8·4 81 80 47·9
32 4924 9·9 9·8 69 65 45·5
30 4848 13·2 12·5 54 50 44·6
28 4776 13·9 15·0 45·3 36 38·6
27 4742 16·8 17·0 40 31·5 38·2
26 4707 21·6 20·5 32 26·5 38·8
24 4639 30 27 25 19·5 37·6
22 4578 36 35 19 14 35
20 4517 42 45 15·5 10 32·2
16 4404 79 79 8·5 5·5 31·2
10 4245 180 190 3·6 2·5 32·2
6 4151 270 270 2·7
Table IX.—H. R.’s Curves (see Fig. 32).
I. II. III. IV. V. VI. VII.
Scale number. Wave- length. Mean reading of extinction in millionths of original luminosity. Adopted reading in millionths of original luminosity. Persistency curve (590 / ad. reading). Luminosity curve. Absolute luminosity of extinction (IV. × VI.) / 48
57 6423 1200 1200 ·49 5 125
56 6330 900 850 ·69 7 124
55 6242 500 550 1·07 10 115
54 6152 250 250 2·36 17 88
53 6074 .. 150 3·93 25 78
52 5996 90 90 6·56 35 66
51 5919 60 45 13·1 47 44
50 5850 27 27 21·8 57 32
48 5720 18 15 39·3 66 21
46 5596 10 10 59 69 14
44 5481 9·3 8 73·8 64 11
42 5373 6·5 6·2 95·1 56·5 7
40 5270 5·9 5·9 100 45 5·5
38 5172 6 6 98·3 32 4
36 5085 .. 6·6 89·4 20 2·7
35 5043 7 7·2 81·9 16 2·4
34 5002 .. 8 73·8 12·5 2·1
32 4924 10 9·6 61·5 8 1·6
30 4848 11·5 12 49·2 6 1·5
28 4776 14·5 14·5 40·7 5 1·5
26 4707 20 17·5 33·7 4 1·5
24 4639 20 22 26·8 3 1·4
22 4578 .. 30 19·7 2·4 1·5
18 4459 55 57 10·4 1·3 1·5
14 4349 115 115 5·1 ·7 1·7
10 4245 .. 160 3·7 ·5 1·7
6 4151 200 200 2·9 ·4 1·7
Table X.—V. H.’s Curves (see Fig. 33).
I. II. III. IV. V. VI. VII.
Scale number. Wave- length. Mean reading of extinction in millionths of original luminosity. Adopted reading in millionths of original luminosity. Persistency curve (530 / ad. reading). Luminosity curve. Absolute luminosity of extinction (IV. × VI.) / 75.
57 6423 500 500 1·1 31 206
56 6330 350 350 1·5 43 200
54 6152 200 180 2·9 61 146·4
52 5996 100 100 5·3 70 93·3
50 5850 40 40 13·3 73 38·9
48 5720 .. 25 21·2 69 23
46 5596 10 10 53·0 63 8·4
45 5538 6·5 6·5 81·6 58 5·0
44 5481 6·0 5·7 93 54 4·1
42 5373 5·5 5·3 100 46 3·3
40 5270 5·5 5·4 98·2 36 2·6
38 5172 5·7 5·7 93 24 1·8
36 5085 6·7 6·5 81·6 15 1·3
34 5002 7·0 7·0 75·7 9·5 ·89
32 4924 8·5 8·5 62·3 7·0 ·79
30 4848 10·7 10·5 50·5 5·0 ·70
28 4776 16 16 33·1 3·7 ·79
26 4707 .. 22·5 23·5 2·7 ·81
24 4639 30 31 17·1 1·82 ·75
22 4578 42·5 42 12·6 1·4 ·78
20 4517 55 55 9·6 1·0 ·73
16 4404 105 100 5·3 ·7 ·93
12 4296 175 170 3·1 ·45 1·02
10 4245 200 200 2·7 ·34 ·91
Table XI.—B. C.’s Curves (see Fig. 34).
I. II. III. IV. V. VI.
Scale Number. Wave- length. Adopted reading in hundred thousandths. Persistency curve 12,500 readings in V. Luminosity of original beam. Absolute luminosity of extinction III. and V.
61 6839 7500 1·6
60 6728 5500 2·3 ·5 27·5
59 6622 4000 3·1 1 40
58 6520 2800 4·5 2 56
57 6423 2000 6·2 4 80
56 6330 1500 8·3 6 90
55 6242 1150 10·8 8 92
54 6152 950 13·1 11·5 109·2
53 6074 750 16·6 16 120
52 5996 580 21·6 21·5 125
51 5919 430 29 28·5 122·5
50 5850 350 36 37 129·5
49 5783 275 45·5 47 129·2
48 5720 215 58 60 129
47 5658 170 73·4 76 129·2
46 5596 140 89·3 92 129
45 5538 125 100 98 122·5
44 5481 125 100 100 125
43 5427 130 96·1 97 126
42 5373 150 83 85 127·5
41 5321 180 69·4 65 117
40 5270 215 59 45 96·7
39 5221 250 50 30 75
38 5172 290 43 1·5 723·2
37 5128 335 37 16 53·6
36 5055 380 33 11·5 43·7
34 5002 500 25 7 35
32 4994 650 19 4 26
30 4848 850 14 2·5 23·3
28 4776 1100 11·4 2 22
26 4707 1500 8·3 1·5 22
24 4639 2000 6·2 1 20
22 4578 2700 4·6 5 13·5
18 4459 4750
14 4349 7500
10 4245 11000
Table XII.—M.’s Luminosity Curve compared with the Normal (see Fig. 30).
I. II. III. IV. V. VI. VII.
Scale number. Wave- length. Mean reading. Mean reading × 1·8. Normal luminosity curve, centre of eye. Difference of last two columns. Difference × 5·15.
61 6839 2 3·6 4 ·4 2·57
59 6621 7 12·6 12·5 -·1 ·51
57 6423 18 32·4 33 +·6 3·09
55 6242 36 64·8 65 ·2 1·03
53 6074 49 88·2 89·5 1·3 6·71
52 5996 52 95·4 96·5 1·1 5·66
51 5919 54 97·2 99·5 2·3 11·8
50 5850 54 97·2 100 2·8 14·4
49 5782 52·5 94·5 99·5 5·0 25·7
48 5720 50 90 97 7·0 36·0
47 5658 46 82·8 92·5 9·7 49·9
46 5596 41 73·8 87 13·2 68·0
44 5481 32 57·6 75 17·4 89
42 5373 23 43·2 62.5 19·3 99
40 5270 17 30·6 50 19·4 100
38 5172 10 17·5 35·5 18 93
36 5085 4 7·2 24 16·8 86·5
34 5002 1·0 1·8 14·5 12·7 65·5
31 4885 ·5 ·7 6·5 5·8 37·7
28 4776 0 0 4 4 20·6
Table XIII.—Miss W.’s Curves (see Fig. 39).
Scale number. Wave- length. Readings. Extinction in 1/100000. Persistency curve.
63 7082 0
62 6957 1
60 6728 7
58 6520 18
57 6423 28
56 6330 43
54 6152 76 900 2
52 5996 90 250 7
50 5850 95 130 13·5
48 5720 93 60 29
46 5596 83 34 51
44 5481 71 22 80
42 5321 58 18·5 92
40 5270 46 17·5 100
38 5172 32 18 94
36 5085 21 19·5 90
34 5002 12·5 22 79
32 4924 7 27 65
30 4848 4·5 34 51
28 4776 3·0 40 38·5
25 4675 1·5 60 29
20 4518 0·4 250 7
19 4488 0·0 350 5
16 4404 — 600