Chapter III · (continued 2)
Reading edition
Fig. 34.—New venous pressure instrument. (After Eyster.)
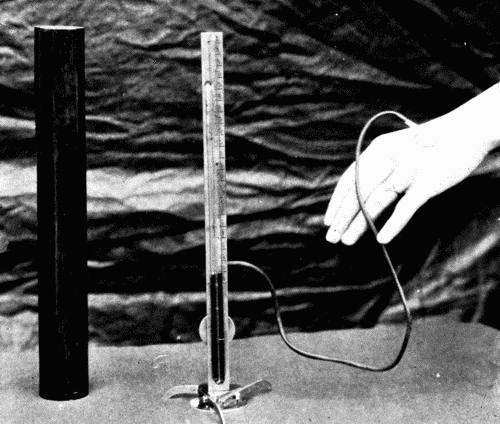
Practically Hooker and Eyster found that the normal variation in healthy subjects was from 3 to 10 cm. of water. The pressure rose in cases of decompensated hearts with dyspnea and venous stasis, and returned to normal with improvement in the condition of the patient. It might be possible with this instrument to foretell an oncoming decompensation by the rise in venous pressure.
The venous pressure may also be estimated roughly by slowly elevating the arm and noting the instant at which a particular vein collapses. By measuring the height of the vein above the heart some idea may be obtained of the pressure within the right auricle.
The Pulse
There is nothing characteristic about the pulse of a person suffering from arteriosclerosis, except it be the difference in the pulse of high tension and of low tension. The pulse of high tension has a gradual rise, a more or less rounded apex, and the dicrotic wave is slightly marked and occurs about half-way down on the descending limb. In arteriosclerosis with low tension the radial artery is usually so rigid that very little pulse wave can be obtained. The general form of a low tension pulse is a sharp upstroke, a pointed summit, and a secondary wave on the base line, which corresponds to the dicrotic wave. Such a pulse can be easily palpated, and is known as a dicrotic pulse. However, such a pulse can occur only when the artery still retains all or a large part of its elasticity; hence in arteriosclerotic low tension we would never see such a pulse as the typical dicrotic.
The Venous Pulse
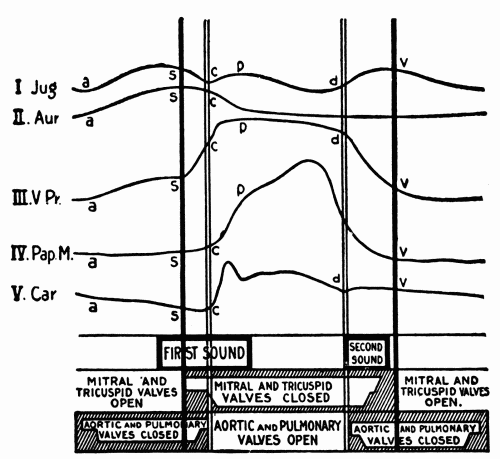
It would carry us too far to discuss fully the character of the venous pulse, but a brief summary of the essential features of the normal venous pulse is presented. The venous pulse is a term used to express the tracing obtained from the internal or external jugular vein at the root of the neck. Normally a very characteristic curve is produced, which can be readily analyzed into a series of waves corresponding to the fluctuations in the cardiac cycle. To understand these waves and their values, the accompanying figure is helpful. (Fig. 35.)
Fig. 35.—Semidiagrammatic representation of the events in the cardiac cycle: Jug., pulse in the jugular vein; Aur., contraction of auricle; V. Pr., intraventricular pressure; Pap. M., contraction of the papillary muscles; Car., carotid pulse. Below are given the times of occurrence of the heart sounds and of the opening and closing of the heart valves. (After Hirschfelder.)
Bachmann summarizes the normal waves in the venous pulse tracing as follows:
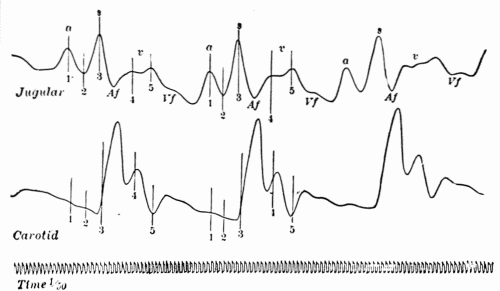
"The physiological or so-called venous pulse consists of three positive and three negative waves, bearing a more or less definite relation to the events of the cardiac cycle, and having their origin in the various movements of the chambers and structures of the right heart. The first positive wave (a) is presystolic in time, and is due to the contraction of the auricle, causing a slowing of the venous current and producing a centrifugal wave through a sudden arrest of the inflowing blood. The second positive wave (S) is presystolic in time, and originates in the sudden projection of the tricuspid valve into the cavity of the auricle during the quick, incipient rise in the intraventricular pressure occurring in the protosystolic period. The third positive wave (v) occurs toward the end of ventricular systole. It consists of two lesser waves separated by a shallow notch. The factors entering into its formation are the relaxation of the papillary muscle at a time when the intraventricular is still higher than the intraauricular pressure, resulting in an upward movement of the tricuspid leaflets and a return of the auriculoventricular septum to its position of rest.
"The first negative wave (between positive wave a and S) is due to the relaxing auricle. The second negative wave (Af) occurs during the diastole of the auricle. It is due to the dilatation of its walls, to the displacement of the auriculoventricular septum toward the apex occurring at the time of ventricular systole, and to the pull of the papillary muscles on the tricuspid valve leaflets. The third negative wave (Vf) appears during ventricular diastole and in the common pause of the heart chambers. Its cause is found in the passage of the blood from the auricle into the ventricle. It is somewhat modified possibly by the continual ascent of the auriculoventricular septum and by a wave of stasis due to the accumulation of blood coming from the periphery." (Fig. 36.)
Fig. 36.—Simultaneous tracings of the jugular and carotid pulses showing normal waves in the venous pulse and relation to carotid pulse. (After Bachmann.)
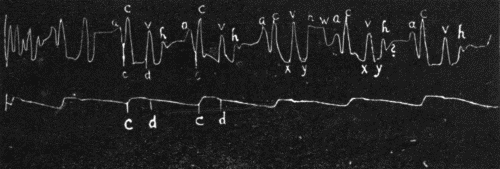
Hirschfelder has described another wave which he calls the "h" wave, which is due to the floating up of the tricuspid valve by the blood in the ventricle before the complete filling of the ventricle following the auricular systole. (Fig. 37.)
Fig. 37.—Jugular and carotid tracing from a normal individual with a well-marked third heart sound showing a large "h" and a smaller pre-auricular wave "w." ? indicates a small wave in mid-diastole following the "h" wave, occasionally found though perhaps an artefact. (After Hirschfelder.)
The Electrocardiogram
In the past few years an immense amount of work has been done by numerous observers on the changes in the electrical potential of the various portions of the heart during contraction. The very elaborate and delicate electrocardiograph with the string galvanometer devised by Einthoven is used. It has been definitely determined that the impulse to cardiac contraction originates in the sinus node, a collection of differentiated nerve cells situated at the junction of the superior vena cava with the right auricle. From there the impulse travels in certain fibers in the interauricular wall, passes through another node, the auriculoventricular or Tawara node, situated in the auricular wall just above the auriculoventricular ring, thence via the Y-bundle, or bundle of His to the ventricles. This sequence is orderly, regular, and normally invariable. (Fig. 38.)
Fig. 38.—Right side of the heart showing diagrammatically the distribution of the two vagus nerves to different parts of the viscus. The impulse to contraction originates at the sino-auricular node and passes over the wall of the auricle to Tawara's node, and thence over His' bundle across the auriculoventricular septum to be distributed throughout the ventricular wall. If the upper, sino-auricular, node is damaged, or if its impulses fail to get across the wall of the auricle, Tawara's node acts in its place to start off the ventricle. If a lesion at the base of the mesial segment of the tricuspid valve damages His' bundle, so that Tawara's node is cut off from the ventricle, then the ventricle may originate its own impulses to contraction. (Hare's Practice of Medicine.)
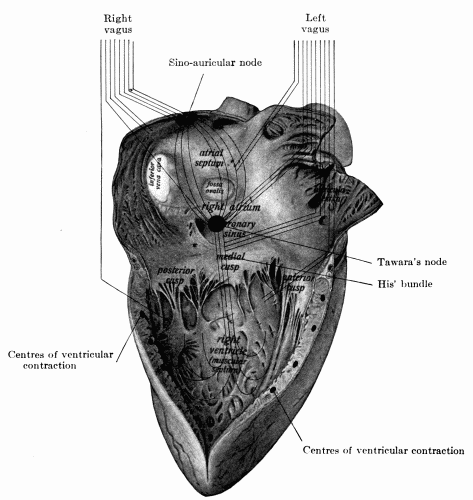
The sino-auricular (s-a) node is the most irritable portion of the heart, it is endowed with the greatest amount of rhythmicity as well. It is under the control of the vagus nerve. Its inherent rate of rhythmicity is probably more rapid than the usual numbers of impulses per minute, but it is inhibited by the vagus. Paralysis of the vagus endings increases the rate of impulse formation and therefore the rate of the heart.
The electrocardiogram is a graphic representation on a photographic film or sensitive bromide paper of the changes of electrical potential during muscular activity. The lines are made by the highly magnified string of the galvanometer as it moves across the slit in the photographic apparatus in response to the induction currents set up in the heart magnified by the special galvanometer.
The record is made in three so-called Leads.
Lead I The electrodes are attached to right arm and left arm. Lead II The electrodes are attached to right arm and left leg. Lead III The electrodes are attached to left arm and left leg.
A series of regular figures is normally obtained in which are depressions and elevations and regular spacing of these elevations and depressions. The waves so-called have been arbitrarily designated P, Q, R, S, T. There is some difference in the three leads. "The wave P is positive in all leads. P to R interval varies slightly in the three leads. All the waves of Lead II are greater than those of Leads I and III. The wave R is positive in all leads. T is usually positive in all leads, but is occasionally negative in Lead III. Even in normal individuals there is a considerable range of variation in the electrocardiogram which is within the limits of the normal." (Hart.) (Fig. 39.)
Fig. 39.—Normal electrocardiogram. (After Hart.)
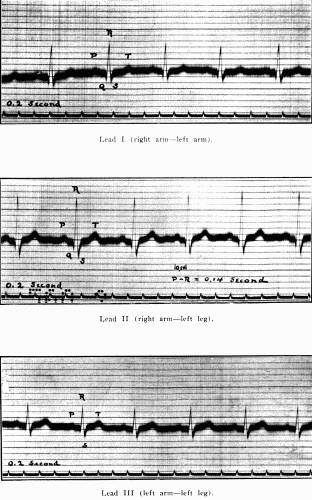
The P wave is admitted to be the wave of auricular contraction. Q, R, S, is the ventricular complex caused, it is thought, by the current passing over the ventricles. T wave is not yet definitely settled. It has been thought by some that it represented actual ventricular contraction and its height and shape had some meaning in heart force. This is denied by others. Hart defines it as "The final activity of the ventricle." The T wave is usually increased in size during exercise.
The P-R interval is almost the most important feature of the tracing. It is the actual conduction time in fractions of a second of the impulse from s-a node to the ventricles. Normally this is about 0.2 second or slightly less. Much that was hoped for from the electrocardiograph in the clinic has not been forthcoming. Its greatest value is in states of abnormal conductivity, such as various grades of heart block, extrasystoles, whether originating in auricles or in either ventricle, abnormalities of rhythm, as flutter and fibrillation. It has, however, aided materially in the intelligent interpretation of many phenomena heretofore not well understood, and has enormously increased our knowledge of the physiology and pathologic physiology of the heart.
It is not possible to enter farther into the subject here. This brief discussion must suffice. The reader is referred to works on this subject in connection with diseases of the heart.