Note 27 — Chapter XIII · POTASSIUM, RUBIDIUM, CÆSIUM, AND LITHIUM. SPECTRUM ANALYSIS
George Kamensky translation
The most accurate investigations made in this respect are carried on with spectra obtained by diffraction, because in this case the position of the dark and bright lines does not depend on the index of refraction of the material of the prism, nor on the dispersive power of the apparatus. The best—that is, the most general and accurate—method of expressing the results of such determinations consists in determining the lengths of the waves corresponding to the rays of a definite index of refraction. (Sometimes instead of this the fraction of 1 divided by the square of the wave-length is given.) We will express this wave-length in millionth parts of a millimetre (the ten-millionth parts are already doubtful, and fall within the limits of error). In order to illustrate the relation between the wave-lengths and the positions of the lines of the spectrum, we will cite the wave-lengths corresponding with the chief Fraunhofer lines and colours of the spectrum.
Fraunhofer line A B C D E b F G H
Wave-length 761·0 687·5 656·6 589·5–588·9 527·3 518·7 486·5 431·0 397·2
Colour red orange yellow green blue violet
In the following table are given the wave-lengths of the light rays (the longest and most distinct, see later) for certain elements, those in black type being the most clearly defined and distinct lines, which are easily obtained either in the flame of a Bunsen's burner, or in Geissler's tubes, or in general, by an electric discharge. These lines refer to the elements (the lines of compounds are different, as will be afterwards explained, but many compounds are decomposed by the flame or by an electric discharge), and moreover to the elements in an incandescent and rarefied gaseous state, for the spectra sometimes vary considerably with a variation of temperature and pressure.
It may be mentioned that the red colour corresponds with lines having a wave-length of from 780 (with a greater wave-length the lines are hardly visible, and are ultra red) to 650, the orange from 650 to 590, the yellow from 590 to 520, the green from 520 to 490, the blue from 490 to 420, and the violet from 420 to 380 millionth parts of a millimetre. Beyond 380 the lines are scarcely visible, and belong to the ultra-violet. For fluorine Moissan found as many as 13 bright lines from 744 to 623.
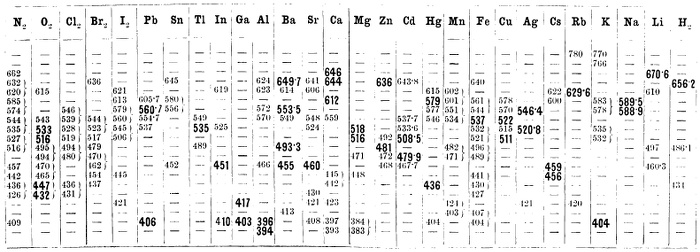
In the table (p. 565) which is arranged in conformity with the image of the spectrum as it is seen (the red lines on the left-hand and the violet on the right-hand side), the figures in black type correspond with lines which are so bright and distinctly visible that they may easily be made use of, both in determining the relation between the divisions of the scale and the wave-lengths, and in determining the admixture of a given element with another. Brackets join those lines between which several other lines are clearly visible if the dispersive power of the spectroscope permits distinguishing the neighbouring lines. In the ordinary laboratory spectroscopes with one prism, even with all possible precision of arrangement and with a brilliancy of light permitting the observations being made with a very narrow aperture, the lines whose wave-lengths only differ by 2–3 millionths of a millimetre, are blurred together; and with a wide aperture a series of lines differing by even as much as 20 millionths of a millimetre appear as one wide line. With a faint light (that is, with a small quantity of light entering into the spectroscope) only the most brilliant lines are clearly visible. The length of the lines does not always correspond with their brilliancy. According to Lockyer this length is determined by placing the carbon electrodes (between which the incandescent vapours of the metals are formed), not horizontally to the slit (as they are generally placed, to give more light), but vertically to it. Then certain lines appear long and others short. As a rule (Lockyer, Dewar, Cornu), the longest lines are those with which it is easiest to obtain reversed spectra (see later). Consequently, these lines are the most characteristic. Only the longest and most brilliant are given in our table, which is composed on the basis of a collection of the data at our disposal for bright spectra of the incandescent and rarefied vapours of the elements. As the spectra change with great variations of temperature and vapour density (the faint lines become brilliant whilst the bright lines sometimes disappear), which is particularly clear from Ciamician's researches on the halogens, until the method of observation and the theory of the subject are enlarged, particular theoretical importance should not be given to the wave-lengths showing the maximum brilliancy, which only possess a practical significance in the common methods of spectroscopic observations. In general the spectra of metals are simpler than those of the halogens, and the latter are variable; at an increased pressure all spectral lines become broader.