Note 1125 — Chapter I · : THE HEDONISTS
R. (Robert) Richards translation
Below on the same diagram is traced a demand and a supply curve.
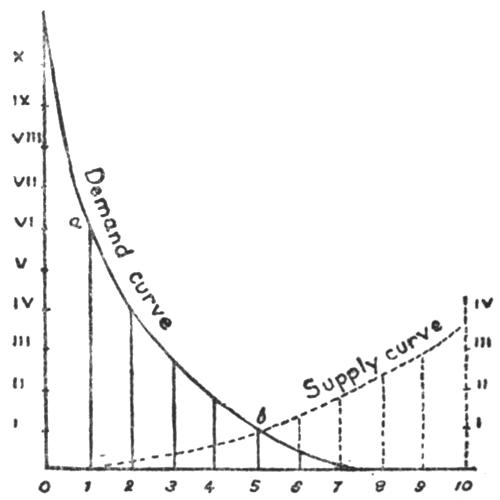
The figures along the horizontal line denote price, along the vertical the quantity demanded. In the given figure when price is 1, quantity demanded is VI, and with the price at 7 the quantity demanded falls to zero.
The dotted curve represents the supply. When price is 1, supply is nil. When price is 10, supply mounts up to IV. Exchange obviously must take place just where demand and supply are equal, i.e. at b, which marks the point of intersection of the two lines, when the amount demanded is equal to the quantity offered and the price is 5.
The vertical lines are called ordinates, and 0 X the axis of the ordinates. Distances along 0 X are called abscissæ. Each point on the curve simply marks the intersection of these, of the ordinates and the abscissæ. This is true of the point a, for example, where the perpendicular denotes the price (1) and the other line the number of units sold, in this case VI.
Though in the diagram we have considered the ordinates to represent price and the abscissæ quantities, the reverse notation would work equally well.